This paper proposes a simulator that would simulate the course of scientific publications, from writing ... The main goal of the simulator is to verify whether the OpinioNet reputation model succeeds in en- ..... IOS Press. 5. Nardine Osman ...
Simulating Research Behaviour Nardine Osman, Jordi Sabater-Mir, and Carles Sierra Artificial Intelligence Research Institute (IIIA-CSIC), Barcelona, Catalonia, Spain
Abstract. This paper proposes a simulation for research behaviour, focusing on the process of writing papers, submitting them to journals and conferences, reviewing them, and accepting/rejecting them. The simulation is currently used to evaluate the OpinioNet reputation model, which calculates the reputation of researchers and research work based on inferred opinions. The goal is to verify whether the reputation model succeeds in encouraging ‘good’ research behaviour or no, although the simulator is elaborate enough to be used for the analysis of other aspects of paper writing, submission, and review processes.
1
Introduction
The classical way in which scientific publications are produced, evaluated and credited, is being challenged by the use of modern computer science technologies [1, 5]. In particular, software versioning tools and reputation mechanisms make it realistic to think about a publication process where the publications are ‘liquid’, in the sense that they are persistently accessible over Internet and modified along time. Credit is then given to authors based on opinions, reviews, comments, etc. This would produce many beneficial results, for instance, to reduce the current large number of very similar publications (i.e. salami papers) or to organise conferences by just searching for the most prestigious liquid publications satisfying certain keywords. OpinioNet [4] is one reputation model that has been proposed with the intent of encouraging ‘good’ research behaviour. For instance, its equations are designed to give more attention to the quality of a researcher’s work than their quantity. This paper proposes a simulator that would simulate the course of scientific publications, from writing papers and submitting them to journals and conferences to reviewing them and accepting/rejecting them. The main goal of the simulator is to verify whether the OpinioNet reputation model succeeds in encouraging ‘good’ research behaviour or not, although the simulator is rich enough to be used for the analysis of other aspects of paper writing, submission, and review processes. The rest of this paper is divided as follows. Section 2 provides the background needed for understanding the followed formal publications model and the OpinioNet reputation model being evaluated. Section 3 introduces the basics of the simulator. The simulator’s algorithm is then presented by Section 4, and its assumptions and hypothesis are presented by Section 5. Section 6 then discusses the preliminary results, before concluding with Section 7.
2
Background
Reputation is widely understood as the group’s opinion about the entity in question. The OpinioNet reputation model [4] is based on the concept that in the case of the lack of explicit opinions, opinions may be deduced from related entities. For instance, in the field of publications, one may assume that if a paper has been accepted by a reputable conference, then the paper should be of a minimum quality. Similarly, a conference becomes reputable if it accepts high quality papers. OpinioNet is essentially based on this notion of opinion propagation in structural graphs, such as the publications graphs (where nodes of this graph may represent knowledge objects, such as conference proceedings and conference papers, and relations stating which is part of what). OpinioNet understands opinions as probability distributions over an evaluation space, for a particular attribute, and at a moment in time; for example, one can define a set of elements for the evaluation space for quality of a node as {poor, good, v.good, excellent}. The set of attributes that opinions may address can be, for instance, {novelty, clarity, significance, correctness}. OpinioNet then defines the structural graph accordingly: SG = hN, G, O, E, A, T, E, Fi, where N is the set of nodes, G is the set of agents that may generate opinions about nodes, O is the set of all opinions, E is the ordered evaluation space for O, A is the set of attributes that opinions may address, T represents calendar time, E ⊆ N × N specifies which nodes are part of the structure of which others (i.e. (n, n0 ) ∈ E implies n is part of n0 ), F : G × N × A × T → O is a relation that links a given agent, node, attribute, and time to their corresponding opinion. A single opinion is then represented as the probability distribution P(E|G, N, A, T ) ∈ O. We note that probability distributions subsume classical approaches and are more informative. Hence, the adoption of this approach by our simulator does not necessarily restrict its application to other scenarios.
3
Simulation Basics
In theory, it is researchers’ behaviour (defined through their profiles) that would influence the creation and evolution of papers, journals, and, eventually, fields of research. However, to keep the simulation simple, our example focuses on the evolution of one specific aspect of a research community—namely, the growth of the community’s contributions—and neglects other aspects that are not deemed crucial for the evaluation of the reputation module—such as the rise and fall of the community itself, its journals, its fields of research, etc. As such, and for the sake of simplifying the simulation, we choose to simulate a single community with a fixed number of researchers researching a given subject; we say it is the researchers’ profiles that control the production and dissemination of single contributions; and we keep the number of journals that could accept/reject these contributions fixed. In other words, we say one ‘top rated’ journal is sufficient to represent the acceptance of a contribution by any ‘top rated’ journal. We argue that since our current interest is in the future of authors’ contributions
(such as papers or book chapters), the number of journals becomes irrelevant: what is crucial is the quality of the journals (if any) that accept the authors’ contributions. In what follows, we define the simulator’s input and output. 3.1
The Simulator’s Input and Output
The simulator requires the following tuple as input: hSG0 , J, U, J , U, Ti, where SG0 describes the initial state of the system (or the initial SG graph), which should include at least a fixed number of researchers and journals; J describes the set of journal profiles (defined shortly); U describes the set of researcher profiles (defined shortly); J ⊆ N × J is a function that maps a journal in N (where N is the set of knowledge objects in SG0 ) to a journal profile in J; U ⊆ G × U is a function that maps a researcher in G (where G is the set of researchers in SG0 ) to a researcher profile in U ; and T ∈ N∗ describes the number of years to be simulated. Then, every simulation year Y results in a modified structural graph SGY . The evolution of the SG graph is then presented: ESG = {SG0 , · · · , SGT }. 3.2
Journals’ Profiles
Journals are categorised through profiles that define their quality and their required number of reviewers. A journal’s profile j ∈ J is defined as the tuple: j = hJ, RNi, where similar to the opinions on quality, J is a probability distribution over the evaluation space E describing the quality of the journal; and RN describes the number of reviewers needed to review a paper, and it is specified as a Gaussian function over the set of natural numbers N. The rules for accepting/rejecting contributions depends on the quality of the journal J. For example, very good journals are very strict about the quality of the papers they accept, other lower quality ones are not as strict. Hence, a journal’s acceptance threshold AT may be defined in terms of its quality J. A preliminary definition could be to have AT= emd(J, T), where emd is the earth movers distance that calculates the distance (whose range is [0, 1], where 0 represents the minimum distance and 1 represents the maximum possible distance) between two probability distributions [6],1 and T = {en 7→ 1} (where ∀ei ∈ E · en > ei ) describes the ideal distribution, or the best distribution possible. 3.3
Researchers’ Profiles
Similar to journals, researchers’ behaviour is also categorised through profiles that define their quality, their productivity, etc. A researcher’s profile u ∈ U is defined as the tuple: u = hQ, RP, CN, C, CA, CP, SC, V, SS, RvP, RV, RTi, where 1
If probability distributions are viewed as piles of dirt, then the earth mover’s distance measures the minimum cost for transforming one pile into the other. This cost is equivalent to the ‘amount of dirt’ times the distance by which it is moved, or the distance between elements of the ordered evaluation space E.
– Q describes the researcher’s research quality, and it is specified as a probability distribution over the evaluation space E (we assume that researchers have a fixed and ‘intrinsic’ quality of research — Section 5 argues the need for this intrinsic value — which is different from reputation values that reflect the view of the community and are calculated by reputation algorithms); – RP describes the research productivity in terms of the produced number of papers per year (since produced research work is usually presented and preserved through papers, whether published or unpublished), and it is specified as a Gaussian function over the set of natural numbers N; – CN describes the researcher’s usual number of coauthors per contribution, and it is specified as a Gaussian function over the set of natural numbers N; – C describes the accepted research quality of coauthors, and it is specified as a probability distribution over the evaluation space E; – CA describes the accepted affinity level of coauthors (currently, affinity measure describes how close are two researchers’ profiles; however, in future simulations, one may also consider affinity measures that describe how close are two researchers with respect to numerous social relations), and the range of its value is the interval [0, 1], where the value 0 represents minimum affinity and the value 1 represents maximum affinity; – CP describes the level of persistency in sticking with old coauthors, it is defined in terms of the number of past papers that two researchers have coauthored together, and it is specified as a Gaussian function over the set of natural numbers N; – SS describes the submission strategy of the researcher, and the range of its value is the interval [−1, +1], where a value −1 represents an extreme ‘risk-averse’ strategy in which the researcher does not submit a paper to any journal unless its paper is of the highest quality possible, a value of +1 represents an extreme ‘risk-seeking’ strategy in which the researcher doesn’t mind submitting a paper to a journal of much higher quality, and the value 0 represents a more neutral approach in which the researcher usually submits its papers to journals of the same quality (of course, values in between represent different levels of risk-averse and risk-seeking strategies);2 – RvP describes the researcher’s review productivity in terms of the number of papers the researcher accepts to review per year, and it is specified as a Gaussian function over the set of natural numbers N; – RV describes the review quality in terms of how close the researcher’s reviews are from the true quality of the papers in question, it is defined in terms of the distance from the true quality of the paper in question, and the range of this distance is the interval [−1, +1]; and – RT describes the reviewers’ threshold for accepting to review a paper for a given journal, it is defined in terms of the earth mover’s distance between 2
We assume that the quality of journals and that of researchers may be compared since they are measured on the same scale. Our assumption is based on the idea that the quality of the researchers, their papers, and the journals that accept those papers are all based on the quality of the research work being carried out and presented.
the reviewer’s quality of research and that of the journal’s, and the range of its value is the interval [0, 1]. We note that although the researchers’ profiles may seem too complex, (1) many ideas have already been overly simplified, as illustrated by Section 5.1, and (2) additional simplifications are straightforward.
4
Simulation Algorithm
While the previous section has introduced the simulator as a black box, this section presents an overview of the simulation algorithm. (For the simulator’s technical details, we refer the interested reader to our technical document [3].) The algorithm’s steps are outlined below. 1. Generate the groups of coauthors for the given year The idea is that each group of coauthors will produce one paper that will then be added to the SG graph. In summary, the algorithm selects the authors one by one, giving the authors that intend to write more papers this year (specified by the research productivity RP of the researcher) a higher probability of being selected first. Then, for each selected author, the algorithm searches, in an iterated manner, for a suitable group of coauthors, where the ‘suitability’ is based on the restrictions imposed by each researcher through its preferred number of coauthors (CN), the accepted quality of coauthors (C), the accepted affinity of coauthors (CA), and the accepted persistency of coauthors (CP)). The algorithm iterates until all researchers are assigned to as many coalitions as needed. 2. Then, for each paper resulting from a created group of coauthors, the simulator performs the following: (a) Calculate the intrinsic quality of the paper We base our simulation on the idea that papers have a true quality that researchers (and reviewers) often try to guess. Of course, in reality, this value does not exist. However, simulation may assume such values to compare and analyse the performance of researchers. We assume that when researchers from various qualities (where a researcher’s true quality is specified by the parameter Q) are grouped together then the resulting paper’s true value would be an aggregation of the researchers’ true value. (b) Choose the journal to submit the paper to After a paper is created, it is submitted to some journal. The selection of the journal assumes that researchers tend to have certain submission strategies (specified through the parameter SS), and the submission strategy for a given journal is an aggregation of its authors’.3 The final 3
Although, in fields that are known to have an enormous number of authors per paper (for example, it is not uncommon for Physics articles to have a few thousand authors each) and by the law of large numbers, the simple aggregation method of the authors’ SS values would fail since it would result in similar values for all papers. In such cases, it might be useful to calculate the resulting submission strategy by adopting it from the leading author.
calculated submission strategy is then used to help select the journal to submit to by enforcing constraints on the distance between the paper’s true quality (calculated by step 2(a) above) and that of the journal’s (J). (c) Choose the reviewers to review the paper This action is based on the number of reviews needed RN, the availability of the reviewers (researchers are assumed to review a certain number of papers per year, determined by RvP, and they accept the journals’ requests to review papers based on a first come first serve basis), the quality of the researcher Q, the quality of the journal J, and the reviewer’s threshold for accepting a journal (RT). (d) Generate the reviewers’ opinions (reviews) about the paper in question Reviewers’ opinions are based on the intrinsic quality of the paper (calculated by step 2.(a).) and the researcher’s review quality (RV), which determines how close the review would be to the paper’s true value. (e) Accept/Reject the paper by the chosen journal This calculation is based on the quality of the journal J, the journal’s acceptance threshold (AT), and the reviewers’ aggregated opinions, where the aggregation take into consideration the reviewers’ reputation at the time. Note that if the paper is accepted, then it is linked (in the SG graph) to the journal through the part of relation. (f) Reputation measures are calculated by OpinioNet After reviews are created and papers are accepted/rejected accordingly, the simulator calls the OpinioNet reputation model to calculate the reputation of papers based on the new reviews and acceptance results, as well as the authors’ reputation based on the reputation of their papers. 3. Repeat the entire process for the following year.
5
Assumptions and Hypotheses
After introducing the proposed simulation algorithm, and before moving on to the experiments and results, this section is intended to clarify our stance by highlighting and discussing the assumptions we make as well as clarifying the claims the simulation algorithm is designed to test. 5.1
Assumptions
As discussed earlier, trying to simulate the real behaviour of researchers requires a thorough study of various aspects, from how people choose their coauthors and how they choose where to submit their work to, to how do journals select reviewers, and how is the quality of a paper related to the research quality of its authors. We argue that the proposed simulation algorithm is sophisticated enough to capture the actions that have an impact on reputation measures, yet it is simplified enough to overlook unnecessary complicated behaviour. As a result, a bunch of assumptions are made, which we discuss below. We note that many of the fixed values that we refer to in our assumptions are in fact either drawn
from a predefined Gaussian function, or some noise is added to them to make our scenarios more realistic. On the Static Nature of the Research Community. We say both the community and the researchers’ behaviour are static: researchers do not join or leave the community; journals do not evolve or die; the field of research is fixed; each paper cites a fixed number of other papers; a researcher’s productivity does not change with time; a researcher’s quality of research does not evolve with time; a researcher’s review productivity does not evolve with time; a researcher’s review quality does not evolve with time and his reviews always fall at a fixed distance from that of the true quality of the paper being reviewed; a researcher’s submission strategy does not evolve with time; a researcher’s acceptable journal quality for reviewing papers is fixed; and journals do not evolve and they always accept papers of the same quality. These assumptions are introduced to keep the simulation simple. Although, to keep the simulation more realistic, some randomness is introduced when generating the measures specifying a ‘fixed’ behaviour. We postpone the study of dynamic and evolving behaviour for future work. On Selecting Coauthors. Selecting the coauthors to collaborate with is usually a complex matter that depends on a variety of issues, such as the subject of study, the practicality of collaboration, and so on. Our proposed simulator, however, is not aimed at studying the dynamics of human relations, their collaboration, and coalition formations, but the production of papers on an annual basis. Hence, for simplicity, the production of papers assumes researchers produce a fixed number of papers per year, and coauthor their papers with a group of other researchers. Again, for simplicity, we assume the strategy of selecting coauthors is fixed and that coauthors are selected based on their quality, their affinity, and their persistence. Of course, different weights may be given to each. On the True Quality of Researchers and Research Work. Although in reality the true quality of a researcher is neither definite nor accessible, we do assume that researchers have defined true and fixed qualities, since we feel the need to base several other actions on these qualities. For example, we say the true quality of a paper is based on the true quality of its authors. And this is crucial because we say, for instance, that how good a reviewer is depends on how close its opinion is from the true quality of the paper in question. But how is the true quality of the paper calculated? We argue that when researchers from various qualities are grouped together then the resulting paper’s true (quality) value would be an aggregation of the researchers’ true (quality) value. However, we also assume that when the dispersion in quality is large (where the Gini coefficient [2] is used to describe dispersion), the aggregation tends to follow a mean nature; and when the dispersion in quality is low, the aggregation tends to follow a more superadditive nature. The equation we propose for calculating a paper’s true value X is then defined as follows: X = G · mean({Qa }) + (1 − G) · superadd({Qa })
(1)
where, {Qa } represents the set of all authors’ true value Q, G represents the Gini coefficient, mean represents some mean function, and superadd represents some superadditive function.45 The superadditivity implies that when a group of researchers in the same quality range are combined, then they may be able to produce some work that is a little bit better than what each may produce on their own. However, when very good researchers coauthor papers with very poor ones, then the poor ones could possibly pull the quality of the produced paper below the excellent researcher’s standard quality. In other words, the effect that a single researcher has on the true quality of a paper is dependent on its quality of coauthors. On Selecting the Journal to Submit a paper to. We say researchers have different, and ‘fixed’, submission strategies. We define submission strategies following the prospect theory classification of strategies into risk seeking, risk averse, and risk neutral ones. The submission strategy of a paper is then an aggregation of its authors’. For example, if the submission strategy is ‘risk seeking’, then the paper may be submitted to some journal which is of better quality than the paper in question. If the submission strategy is ‘risk averse’, then the paper cannot be submitted to a journal unless it is of higher quality. Of course, varying levels of these strategies are considered. On Selecting the Reviewers. Journals usually try to get good reviewers, based on availability. But how do reviewers choose whether to accept/reject reviewing papers for a given journal. We assume that reviewers accept journals based on a first come first serve basis, as long as the journal is of acceptable quality and the reviewer is available to do more reviews. On Accepting/Rejecting papers by a given Journal. We assume accepting/rejecting a paper is only based on reviewers’ opinions, and not on the number of papers submitted, the acceptance rate, etc. This is necessary because we have already assumed the number of journals to be fixed. In other words, we say one journal of a given quality is enough to represent all potential journals of that same quality. Furthermore, when accepting/rejecting a paper, the journal’s editors do not base their decision on the true quality of the paper (since this information is not available), but on the aggregated reviewers’ opinions. When aggregating reviewers’ opinions, we say that the reliability of a review (or opinion) is based on the researcher’s current reputation in his/her community (as calculated by the OpinioNet algorithm), rather than how confident it claims to be (which is how the current review process works). We believe this is a stronger reliability measure since the reviewer does not assess himself, but is assessed by the community. 4
5
We argue that it does not matter much which exact mean or superadditive functions we choose, since the effect of that would be minute. In any case, we hope future extensive simulations would clarify which choices are better. It is not clear yet whether the proposed approach for calculating a paper’s true values would provide better results than a simple variance of authors’ quality values. Future extensive simulations could also clarify which choices are better.
On the Fate of Papers. Finally, we say that, for the sake of simplicity, both accepted and rejected papers are forgotten. Neither of them is submitted to other journals in the following years; only new papers are created each year. In practice these new papers would in fact be a modification of (i.e. a new version of) already existing ones. However, we currently postpone the simulation of the version of relation that links related papers for future simulations. This assumption is acceptable since the current simulation simply focuses on the number of journals and the quality of the journals that accept them, rather than the evolution of papers. 5.2
Hypotheses
The OpinioNet reputation model has been used in an attempt to encourage ‘good’ research behaviour [3]. The proposed simulator aims at verifying whether OpinioNet achieves its goal or not through testing the following hypotheses. Hypothesis 1 It is more profitable to produce few high quality papers than sev-
eral lower quality ones. Hypothesis 2 It is more profitable to follow a ‘risk-neutral’ submission strategy.
The first hypothesis implies that it would be more profitable, in terms of reputation, to spend more time on producing few high quality research papers than numerous papers of lower quality. This, we believe, lowers the dissemination overhead in researchers’ contributions and encourages researchers to spend more time on high quality research, as opposed to wasting time on repackaging already existing ideas for the sole purpose of increasing reputation. The second hypothesis implies that it is more profitable (again, in terms of reputation) to submit one’s contributions to journals that lie in the same quality range of the paper. For instance, if authors choose journals that are much better, then they end up wasting the community’s time and resources, and they also waste time before their work is accepted. However, if the authors choose journals that are of much lower quality than the work submitted, then they miss the chance of having this work published in more reputable journals. Naturally, proving/disproving this hypothesis will be influenced by the assumption that papers may only be submitted once. We believe resubmitting usually requires the creation of news versions, which we postpone for future (and more advanced) simulations. Nevertheless, the current simulation may illustrate the effort, time, and potential gain in reputation that could be wasted by preferring one submission strategy over another. To test the claims above, we define two different simulations, one for each of these claims. In each of these simulations, we keep the value of the relevant parameters in the researchers’ profiles fixed while we vary the other values. For instance, the parameter describing the researcher’s productivity (RP) should be fixed when testing the first hypothesis, while the parameter describing the researcher’s submission strategy (SS) should be fixed for testing the second hypothesis. The following section discussed the details of our simulation examples and their results.
6
Results and Analysis
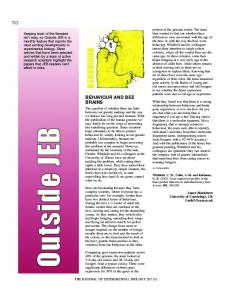
For our preliminary simulation, we choose to simulate a small research community composed of a fixed set of 20 researchers. The simulation then runs for 10 time-steps, where each time-step represents one calendar year. In other words, our simulated example represents a fixed community of 20 researchers with varying behaviour and its evolution over 10 years. At each time-step, papers are added following the constraints of the various profiles. With the addition of each paper, the following measures are calculated: (1) the OpinioNet reputation of the papers affected by this addition, and (2) the OpinioNet reputation of authors affected by this addition. The evolution of these measures along time is then plotted for further analysis, as illustrated shortly. Evaluating Hypothesis 1. In this experiment, we divide the researchers into 3 groups: (1) those with a high quality research and low productivity level, (2) those with a medium quality research and a medium productivity level, and (3) those with low quality research and a high productivity level. We note that the productivity level represents the number of papers produced per year. All the other values defining the researchers’ profiles are kept fixed. For example, all researchers share the same criteria in selecting their co-authors. The results are presented by Figure 1, which shows that those who focus on the quantity cannot do better than those who focus on the quality of their work. However, if we have two researchers that have the same quality of work, then it is not very clear whether focusing on quantity would help or not. For this reason, we run a second experiment, where all the researchers now share the same quality of work, but have different productivity levels. Four categories of productivity are distinguished: (1) those with very high productivity level per year, (2) those with an average productivity level per year, (3) those with a very low productivity level per year, and (4) those who produce a paper every several years (around 5 years on average). The results of this experiment are presented by Figure 2, which illustrates that as long as a researcher is producing papers relatively ‘frequent’ enough, then s/he needs not focus on the quantity of their papers. However, there is a limit for this ‘frequency’. For example, we show that researchers who produce only one paper every 5 years cannot compete with those who are continuously active. These results confirm hypothesis 1, which states that it is more profitable to produce few high quality papers than several low quality ones; yet, researchers are required to remain active not become dormant for long periods of time. Evaluating Hypothesis 2 In this experiment, we divide the researchers into 3 groups: (1) those with a ‘risk-seeking’ submission strategy, (2) those with a ‘risk-neutral’ submission strategy, and (3) those with ‘risk-averse’ submission strategy. All the other values defining their profiles are kept fixed. For example, all researchers are of a medium-high quality; all researchers share the same criteria in selecting their co-authors, etc. The results of this experiment are presented by Figure 3, which shows that the researchers that are more picky in their
Reputation of Authors
Researchers with high quality paperss, but low productivity level Researchers with medium quality papers, and medium productivity level Researchers with low quality papers, but high productivity level
1 0.8 0.6 0.4 0.2
0
1
2
3
4
5
6
7
8
9
10
Years
Reputation of Authors
Fig. 1. Reputation of authors: first experiment results evaluating Hypothesis 1
Researchers Researchers Researchers Reserachers
1
with with with with
high productivity level medium productivity level low productivity level a very low productivity (around 1 paper per year)
0.8
0.6
0
1
2
3
4
5
6
7
8
9
10
Years
Reputation of Authors
Fig. 2. Reputation of authors: second experiment results evaluating hypothesis 1
Researchers highly selective w.r.t. journals they submit their papers to Researchers reasonably selective w.r.t journals they submit their papers to Researchers not selective w.r.t. journals they submit their papers to
1
0.8
0.6
0
1
2
3
4
5
6
7
8
9
10
Years
Fig. 3. Reputation of authors: experiment results evaluating hypothesis 2
selection of the journals to submit their papers to have their reputation fluctuating much more than others. This is because they risk their work being rejected by some journals, but when they do get published, their gain in reputation is relatively high. An intriguing issue to note is that all three groups tend to have a similar reputation after a long period of time (10 years in this case). We believe that this might be related to the quality of the researchers. For example, researchers with a very high quality might be better off choosing a ‘risk-seeking’ submission strategy than a ‘risk-averse’ one. We hope future simulations to clarify this issue.
7
Conclusion
This paper has presented a simulator that simulates the details of the publication process, from writing papers and submitting them to journals, to the review process and the final decision of accepting/rejecting papers. The simulator is rich enough to be used in analysing different aspects of the publication process. However, this paper has focused on using it to verify the OpinioNet reputation model’s success in encouraging ‘good’ behaviour, such as encouraging the focus on the quality of work produced as opposed to its quantity. Future work should help us understand the details and preconditions of hypotheses 1 and 2 better. We also plan to extend our future simulations for testing additional hypotheses such as: (1) Is it more profitable to collaborate with researchers of high research quality? (2) Are more reputable researchers less susceptible to the selected quality of coauthors? (3) Is it more profitable to repackage one’s research work into different versions? And so on.
Acknowledgements This work has been supported by the LiquidPublications project (funded by the European Commission’s FET programme) and the Agreement Technologies project (funded by CONSOLIDER CSD 2007-0022, INGENIO 2010).
References 1. Fabio Casati, Fausto Giunchiglia, and Maurizio Marchese. Publish and perish: why the current publication and review model is killing research and wasting your money. Ubiquity, 2007:3:1–3:1, January 2007. 2. Corrado Gini. Variability and Mutability (Italian: Variabilit` a e mutabilit` a). Clarendon Press, 1912. Reprinted in Memorie di metodologica statistica (Ed. Pizetti E, Salvemini, T). Rome: Libreria Eredi Virgilio Veschi (1955). 3. Nardine Osman, Jordi Sabater-Mir, Carles Sierra, Adri´ an Perreau de Pinninck Bas, Muhammad Imran, Maurizio Marchese, and Azzurra Ragone. Credit attribution for liquid publications. Deliverable D4.1, LiquidPublications Project, June 2010. 4. Nardine Osman, Carles Sierra, and Jordi Sabater-Mir. Propagation of opinions in structural graphs. In Helder Coelho, Rudi Studer, and Michael Wooldridge, editors, Proceeding of the 19th European Conference on Artificial Intelligence (ECAI’10), volume 215 of Frontiers in Artificial Intelligence and Applications, pages 595–600, Amsterdam, The Netherlands, The Netherlands, 2010. IOS Press. 5. Nardine Osman, Carles Sierra, Jordi Sabater-Mir, Joseph R. Wakeling, Judith Simon, Gloria Origgi, and Roberto Casati. LiquidPublications and its technical and legal challenges. In Dani`ele Bourcier, Pompeu Casanovas, M´elanie Dulong de Rosnay, and Catharina Maracke, editors, Intelligent Multimedia: Managing Creative Works in a Digital World, volume 8, pages 321–336. EPAP, Florence, 2010. 6. Shmuel Peleg, Michael Werman, and Hillel Rom. A unified approach to the change of resolution: Space and gray-level. IEEE Transactions on Pattern Analysis and Machine Intelligence, 11(7):739–742, 1989.