ANNALS OF THE ORADEA UNIVERSITY Fascicle of Management and Technological Engineering ISSUE #1, MAY 2015, http://www.imtuoradea.ro/auo.fmte/
SIMULATION METHOD IN PC CRASH USING POINT CLOUD FILES Dragos Sorin DIMA1, Dinu COVACIU2 1
Transilvania University of Braşov,
[email protected] Transilvania University of Braşov,
[email protected]
2
-8.826 -10.295 -1.531 140 139 139 -8.826 -10.280 -1.531 145 144 143 The first three columns are in absolute coordinates take it from laser scanner and can be arranged in the 3D windows view in PC Crash (software program for accident reconstruction) aligned at zero point elevation if a part of this area is known as zero elevation point. The next three columns represent the color in rgb format this part of information is facultative as far as we intend to have only the shape of the ground. If we intend to have also the color of the background this information shall be also take into account. For use in PC Crash the point cloud can be used as it is take it by the laser scanner but the main problem it will be that in the simulation all the points will be calculated and the simulation it can be very slow. In this case we can select the area on which we intend to calculate the trajectory and we can triangulate this area with fewer points so that the calculation will be done on surfaces instead of points and the simulation process will be faster, and also the movement of the cars on this kind of surfaces will be smooth.
Abstract—The aim of this paper intend to familiarize the reconstructions experts with the new technic of using for simulations of the accidents the 3D point clouds scans. In the new version of PC Crash (software program for accident reconstruction) this facility is already working, as it was been implemented from the version 10.1. The main advantages of using these scans are in the reference with the precision of the simulation process. Also as far as we can appreciate the result of the simulation is quite close with the real situation in the field of the crime scene. One of the main advantages of using this method it is represented by the possibility of a good and fine appreciation of the deformed line of the car profile which conducts to a good evaluation of the total energy consumed in the impact by calculating the EES (energy equivalent speed) parameter with crash 3 and Burg methods. Keywords—Point cloud, 3D scans, accident reconstruction and simulation, PC Crash I. INTRODUCTION
T
HE 3D Point Cloud represent in fact the file from a 3D laser scan scene crime or damaged vehicle result in an accident investigation. At this moment the 3D laser scanners devices provided by FARO, ARTEC, CREAFORM - (scanner producers) etc. rest at a considerable price due to the precision of the final measurement, but in the meantime on the market arrive all-purpose application for a good balance between the price and the final result quality. Also if we look on the market we can observe that the prices of this device have been decreased by ten times in the last three years. So we appreciate that this method will be very soon available for all crime scene investigators to provide a 3D laser scanned file instead a simple 2D outline.
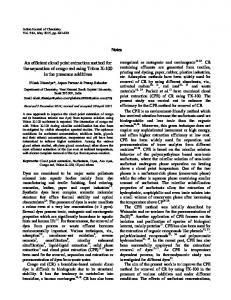
III. CASE STUDY This example it is realize on the base of a real full scale crash test performed in Linz in 2014 at the test crash facility of “DSD Datentechnik G.m.b.H.”, the PC Crash software provider and developer with the occasion of the annual Easter Seminar [1]. The aerial photography is presented in fig. 1 below:
II. WORKING IN PC CRASH The format file of the 3D laser scanned image can be interpreted in different software programs but the most portable format that we can use we considered to be the .xyz file called as point cloud file. In fact this file contains a list of 6 variables 3 coordinates and 3 color values separated by space (see the example below). -8.806 -10.336 -1.531 135 136 138 -8.810 -10.312 -1.531 142 141 142 -8.839 -10.265 -1.531 144 143 144 -8.844 -10.253 -1.530 148 148 148
Fig. 1. End position of the cars after impact.
Using PC Rect 4.2 software program [2], we can 193
ANNALS OF THE ORADEA UNIVERSITY Fascicle of Management and Technological Engineering ISSUE #1, MAY 2015, http://www.imtuoradea.ro/auo.fmte/ obtain a very good aerial view from this scene which can be scaled and can provide further dimensions because this image is rectified.
accurate than the photographic rectified image. Also we can see that this scanned image is constituted by 6.25 million of points, for this resolution. But the real value of this representation in point cloud is that the image file is 3D constructed as it can be seen below:
Fig. 4. The 3D point cloud image in 3D window
In PC Crash for handle this kind of file we have now a special menu which is very easy to use:
Fig. 2. The rectified image of the impact scene
The next step is to scan the area with a 3D laser scanner and import the point cloud obtained into PC Crash [3], [4], the result for comparison is presented below in Fig. 3. Fig. 5. Meniu related to point cloud in PC Crash
By using this menu we can use this 3D image in the way that we can obtain the maximum information from the impact. For documentation we need to know the maximum deformation of the vehicles involved in the impact [5]-[8]. This residual deformation can give us the image of the total deformation energy consumed in the impact. Whit this information and with the energy consumed in the post-crash displacement we can have an image and an estimation of the speed necessary to cover the energy conservation in the impact. Therefor we have to measure de depth of the deformation for each vehicle and to calculate the EES (energy equivalent speed) for each vehicle. In fact as far as we have the 3D representation of the deformed vehicle it is quite easy to define the deformation area. So in the next image we can select exact the height of the main deformation represented with orange color and to define this area associated with a new lawyer for further use. This procedure have to be realize for each car individually and after that in the menu related with Crash3 method [7] we have to determinate the most
Fig. 3. Point cloud image from laser scanner.
As far as we can see the scanned image is more 194
ANNALS OF THE ORADEA UNIVERSITY Fascicle of Management and Technological Engineering ISSUE #1, MAY 2015, http://www.imtuoradea.ro/auo.fmte/ in PC Crash [4] we can determinate the speed involved in the crash that we study. Because the PT Cruiser have also the possibility to communicate with the can-bus of the vehicle after a scan with the Bosch CDR (Crash Data Recorder) thee results for the acceleration can be seen in the next figure:
appropriate value of the EES parameter.
Fig.6. Definition of the deformed profile
The result of this appreciation will give us also the impact real position as it is figured below:
Fig. 9. Acceleration from the can-bus of the impact vehicle.
The values for the speed obtained in the real measurement form different devices are presented below:
Fig. 10. Speed evaluation of the test. Fig.7. Impact position
In the next frames we intend to show some of the impact moments as there was take it from the tests.
If we define the new contour area as deformation line the software take directly tis values to calculate the EES parameter and the EBS (energy barrier speed) one.
Fig. 11. The impact moment
The next frames will give a image from the rest of the impact parameters and the final evaluation will be in the
Fig. 8. The Crash3 calculation of deformation
With these calculations and with the optimization module 195
ANNALS OF THE ORADEA UNIVERSITY Fascicle of Management and Technological Engineering ISSUE #1, MAY 2015, http://www.imtuoradea.ro/auo.fmte/ comparison between the real impact and the simulated impact. This kind of test are designated to provide the prove and also the validation of the mathematical model which is beside the calculation in PC Crash program.
For all images in this simulation we are able to provide all the stages of the real impact as far as with the evaluation of the real damages.
ACKNOWLEDGMENT This work was partially supported by the strategic grant POSDRU/159/1.5/S/137070 (2014) of the Ministry of Labor, Family and Social Protection, Romania, cofinanced by the European Social Fund – Investing in People, within the Sectorial Operational Programme Human Resources Development 2007-2013. REFERENCES [1] [2]
CD-ROM: DSD Crash Tests April 2014,c DSD, Linz 2014 PC-Rect. Operating & Technical Manual. Version 4.1, Dr. Steffan Datentechnik, Linz 2009. [3] PC-Crash. A Simulation Program for Vehicle Accidents. Manual. Version 10.1, Dr. Steffan Datentechnik, Linz 2015. [4] Moser, A. and Steffan, H., "Automatic Optimization of PreImpact Parameters Using Post-Impact Trajectories and Rest Positions", SAE 980373. [5] Steffan, H. And Moser, A., "The Collision and Trajectory Models of PC-Crash", SAE 960886. [6] PC-Crash. A Simulation Program for Vehicle Accidents. Technical Manual. Version 6.2, Dr. Steffan Datentechnik, Linz 2001. [7] CRASH3 Technical Manual, Accident Investigation Division, N.C.S.A., N.H.T.S.A., 1986. [8] Moser A., Steffan H., Automatic Optimization of Pre-Impact Parameters Using Post-Impact Trajectories and Rest Positions, SAE Technical Paper No. 980373, Warrendale PA 1998. [9] CD-ROM: EES Seminar Graz 2–3 11. 1996, c DSD, Linz 1996. [10] Burg H., Moser A., Handbuch der Verkehrsunfallrekonstruktion, Vieweg & Sohn Verlagsgesellschaft mbH, Wiesbaden 2007. [11] www.dsd.at accessed on may 2015
a)
b)
c) Fig. 12. The real tests a,b,c
As far as we will see in the presentation the simulation will make almost the same estimation of the final result. IV. CONCLUSION This case documentation which is describe in this paper wish to demonstrate once more if it is necessary that the simulation software program PC Crash ver. 10.2 can be a very powerful tool for accident reconstruction. 196