Jun 2, 2014 - Abstractâ In this study we have some estimators for exponential distribution in simulation study. These estimators were classical estimator like ...
International Journal of Mathematics Trends and Technology – Volume 10 Number 2 – Jun 2014
Simulation Study for Some Estimators of Exponential Distribution Irtefaa Abdulkadhim Neama #1, Fahad Ghalib Abdulkadhim *2 1
Department of Mathematics Department of Computer Science s Faculty of Computer Science and Mathematics University of Kufa Najaf , Iraq 2
Abstract— In this study we have some estimators for exponential distribution in simulation study. These estimators were classical estimator like maximum likelihood estimator (MLE) and robust estimators that is called MAD/MED robust estimator. These methods are used to estimate the parameter of exponential distribution . We applied the simulation in MATLAB and then compared the results that we have them. The results of the study proved that the method of MAD/MED robust is better than the classical method MSE in the event that the data regular (without pollution) or contaminated. Keywords— Maximum Likelihood estimator, M- Estimator, MAD/MED Robust estimator, Exponential Distribution, Simulation
I. INTRODUCTION The main branch of statistical inference is an estimation. There are some procedures of estimation. Some of these procedures which depend on a number of samples are called the classical methods like a maximum likelihood estimators(MLE) and some robust procedure like m-estimator and MAD/MED robust estimator . The exponential distribution is a simplest model for the description of time to failure in the reliability theory. II. EXPONENTIAL DISTRIBUTION[1][2] This distribution is commonly used to model waiting times between occurrences of rare events , lifetimes of electrical or mechanical devises . A random variable X has exponential density if :
f(x) = e if x ≥ 0 0 otherwise
…(1)
is called the rate parameter . We say that the random variable X Exp() , and so mean , variance and distribution function are easy to compute . They are :
E(X) = Var(X) = F(x) =
ISSN: 2231-5373
1 1
0 if x < 0 1 − e if x ≥ 0
http://www.ijmttjournal.org
Page 93
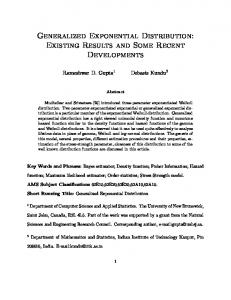
International Journal of Mathematics Trends and Technology – Volume 10 Number 2 – Jun 2014 Exponential Distribution 0.35 lemda=0.5 lemda=1.5 lemda=3
probability density function
0.3
0.25
0.2
0.15
0.1 lemda =0.5
lemda = 3
0.05
0
lemda =1.5
0
100
200
300
400 500 600 random variables
700
800
900
1000
Fig.(1) : Density functions of exponential variables for different rate parameters 0.5, 1.5, and 3 Example : Jobs are sent to a printer at an average of 3 jobs per hour. (a) What is the expected time between jobs? (b) What is the probability that the next job is sent within 5 minutes? Solution Job arrivals represent rare events, thus the time T between them is Exponential with rate 3 jobs/hour i.e. =3 . (a) Thus E(T) = = hours or 20 minutes . (b) Using the same units (hours) we have 5 min. = 1/12 hours . Thus we compute : P(T < 1/12) = Exp3(1/12) = 1-
.
= 1 −
= 0.2212
III. MAXIMUM LIKELIHOOD ESTIMATOR (MLE)[1][3] The method of maximum likelihood (Harter and Moore (1965a), Harter and Moore (1965b), and Cohen (1965) is a commonly used procedure because it has very desirable properties. Let x1 , x2 , x3 , … , xn be independent a random variables of size n , we assumed that the likelihood function (LF) of the probability density function of (1) is : L() =
ISSN: 2231-5373
exp(− x ) = exp −
x
http://www.ijmttjournal.org
Page 94
International Journal of Mathematics Trends and Technology – Volume 10 Number 2 – Jun 2014 = ( −nx) Where : x =
1 n
x
The derivative of the likelihood function's logarithm is : d d ln L() = (n ln () − n x) d d The maximum likelihood estimate for the rate parameter is : =
1 x
IV. MAD/MED ROBUST ESTIMATOR [3][4][5] The word ' robust ' is loaded with many sometimes inconsistent connotation . We shall use it in a relatively narrow sense ; for our purposes , ' robustness' signifies insensitivity against small deviations from the assumptions . Robust statistics provides an alternative approach to standard statistical methods , such as those for estimating location, scale and regression parameters . The motivation is to produce estimators that are not unduly affected by small departures from the model assumptions under which these standard methods are usually derived: the standard methods are comparatively badly affected . Robust statistics seeks to provide an alternative approach to standard statistical methods that emulate popular statistical methods , but which are not unduly affected by outliers or other small departures from model assumptions , such as those for estimating the parameters . The population median MED(X) and the population absolute deviation MAD(X) are very important quantities of distribution . In this method we use the MED and MAD population to find alternative simple method for robust estimator . Suppose that X has an exponential distribution with pdf in eq. (1) then : MED = log(2)* MAD(X)
.
TABLE I MED(X ) AND MAD(X) FOR SOME USEFUL RANDOM VARIABLES.
Hence , a robust estimator for rate parameter is : =
ISSN: 2231-5373
MED(X) log 2
http://www.ijmttjournal.org
Page 95
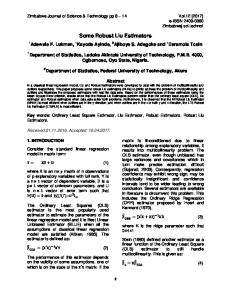
International Journal of Mathematics Trends and Technology – Volume 10 Number 2 – Jun 2014 V. Simulation Study [6][7] Simulation is the imitation of the operation of a real-world process or system over time. The act of simulating something first requires a model to be developed; this model represents the key characteristics or behaviors of the selected physical or abstract system or process. The model represents the system itself, whereas the simulation represents the operation of the system over time. Simulation is used in many contexts, such as simulation of technology for performance optimization, safety engineering, testing, training, education. Training simulators include flight simulators for training aircraft pilots to provide them with a lifelike experience. Simulation is also used with scientific modeling of regular systems or human systems to gain insight into their functioning. Simulation can be used to show the eventual real effects of alternative conditions and courses of action. Simulation is also used when the real system cannot be engaged, because it may not be accessible, or it may be dangerous or unacceptable to engage, or it is being designed but not yet built, or it may simply not exist. We will show the steps of the simulation of this study in the next flowchart .
Start Input n Let I from 1 to rep.
If data is
Outliers
Generate Exp. Random variable
Regulare
Generate Exp. Random variable
Calculate MLE
Calculate MLE
Calculate robust
Calculate robust
No
If i = rep. Yes Calculate MSE
Print Results FIG(2) : FLOWCHART FOR THE SIMULATION STRATEGY
End
ISSN: 2231-5373
http://www.ijmttjournal.org
Page 96
International Journal of Mathematics Trends and Technology – Volume 10 Number 2 – Jun 2014 In the simulation study we consider some different sample sizes , we take sample size n= 5 , 10 ,30 , 50 and 100 , and we supposed two values for rate parameter = 0.5 and 1 to show more results for comparison , for iteration (repetitions ) equal to ( 1000 ) , These assumptions are displayed in two method of estimation that are studied in this paper . They are maximum likelihood estimator and MAD/MED estimator . In the simulation study we take two types of data that are regular ( that data have no outliers ) and the second type of data was had outliers with ratio 20% . So the numerical results that we get it showed in the next tables . In table (2) the results were from simulation for regular data to MLE and table (3) showed the results for same method (MLE) but the data has 20% outliers. Consequently , the table (4) displayed the results for robust estimator but for regular data and when the data has 20% outlier for same method , that is showed in table (5).
TABLE (2) : RESULTS FOR MAXIMUM LIKELIHOOD ESTIMATORS FOR R EGULAR DATA
sample size 5 10 30 50 100
=0.5
0.3593 0.2631 0.4383 0.3667 0.5442
=1
MSE 1.9793x10⁻⁵ 5.6136x01-5 3.8111x10⁻⁶ 1.7775x10⁻⁵ 1.9524x10⁻⁶
MSE 7.9173x10⁻⁵ 2.2455x10⁻⁴ 1.5244x10⁻⁵ 7.1101x10⁻⁵ 7.8097x10⁻⁶
0.7186 0.5261 0.8765 0.7334 1.0884
TABLE(3) : RESULTS FOR MAXIMUM LIKELIHOOD ESTIMATORS FOR DATA THAT HAS (20%) OUTLIERS
sample size 5 10 30 50 100
=0.5
1.3013 1.9352 1.2506 0.7336 0.7603
=1
MSE 6.4208x10⁻⁴ 0.0021 5.6333x10⁻⁴ 5.4583x10⁻⁵ 6.7739x10⁻⁵
MSE 7.7835x10⁻⁴ 0.0023 6.4713x10⁻⁴ 4.2147x10⁻⁵ 3.8133x10⁻⁵
1.8822 2.5140 1.8044 1.2053 1.1953
TABLE(4) : RESULTS FOR R OBUST ESTIMATOR FOR REGULAR DATA
sample size 5 10 30 50 100
=0.5
0.2794 0.5819 0.4603 0.4603 0.4790
ISSN: 2231-5373
MSE 4.8663x10⁻⁵ 6.7129x10⁻⁵ 1.5786x10⁻⁶ 1.5786x10⁻⁶ 4.4162x10-7
=1
1.2053 1.4751 1.3917 1.2083 1.0625
MSE 4.2159x10⁻⁵ 2.2575x10⁻⁴ 1.5346x10⁻⁴ 4.3401x10⁻⁵ 3.9095x10⁻⁶
http://www.ijmttjournal.org
Page 97
International Journal of Mathematics Trends and Technology – Volume 10 Number 2 – Jun 2014 TABLE(5) : RESULTS ROBUST ESTIMATOR FOR DATA THAT HAS (20%) OUTLIERS
sample size 5 10 30 50 100
=0.5
0.9051 0.9760 0.9313 0.7566 0.7009
=1
MSE 1.6414x10⁻⁴ 2.2661x10⁻⁴ 1.8599x10⁻⁴ 6.5821x10⁻⁵ 4.0344x10⁻⁵
1.8103 1.9521 1.6994 1.3329 1.2737
MSE 6.5654x10⁻⁴ 9.0642x10⁻⁴ 4.8915x10⁻⁴ 1.1084x10⁻⁴ 7.4924x10⁻⁵
VI. Conclusions In this paper , a simple and robust estimation for exponential distribution are compared .The results that we get it from simulation study showed that : 1.The classical method estimation MLE is good method when the data has no outliers . 2. The worst results was in sample size (10) , for all . 3. When the data has outliers , then the best method is robust and foe all sample sizes . 4. A big sample size successes to obtain good results for these two methods .
VII.
References
[1] M. Ahsonullah & G. hamedani , " Exponential distribution , Theory and method" , Nova Science Puplishers , Inc. , New York , 2010. [2] Larsen R.J. ,and Marx M.L. ,''Mathematical statistics and applications'' , PERSON , 5th Edition , 2012. [3] Kapur J.N. ,and Saxena H.C. ,''Mathematical statistic '' , S. CHAND &Company LTD., 2009. [4] Olive D. J, " Applied Robust Statistics " , Southern Illinois University , 2008 . [5] Gather U. and Schultze V. , " Robust Estimation of Scale of an Exponential Distribution " , Department of Statistics , university of Dortmund , 87, D44221 , Germany [6] Davis Timothy A. ,Sigmon K.,"MATLAB Primer ",CHAPMAN & HALL /CRC,2005. [7] J. Banks, J. Carson, B. Nelson, D. Nicol ''Discrete-Event System Simulation'' Prentice Hall. p. 3. ISBN 0-13- 088702-1,2001.
http://en.wikipedia.org/wiki/Simulation
ISSN: 2231-5373
http://www.ijmttjournal.org
Page 98