The Journal of Neuroscience, May 28, 2014 • 34(22):7639 –7644 • 7639
Brief Communications
Simultaneous Recordings from the Primary Visual Cortex and Lateral Geniculate Nucleus Reveal Rhythmic Interactions and a Cortical Source for Gamma-Band Oscillations Andre M. Bastos,1,2,5 Farran Briggs,1,6 Henry J. Alitto,1,3 George R. Mangun,2,4,7 and W. Martin Usrey1,3,7 Centers for 1Neuroscience, 2Mind and Brain, Departments of 3Neurobiology, Physiology and Behavior, and 4Psychology, University of California Davis, Davis, California 95616, 5Ernst Stru¨ngmann Institute for Neuroscience in Cooperation with Max Planck Society, 60528 Frankfurt, Germany, 6Department of Physiology and Neurobiology, Geisel School of Medicine at Dartmouth, Lebanon, New Hampshire 03756, and 7Department of Neurology, University of California Davis, Sacramento, California 95817
Oscillatory synchronization of neuronal activity has been proposed as a mechanism to modulate effective connectivity between interacting neuronal populations. In the visual system, oscillations in the gamma-frequency range (30 –100 Hz) are thought to subserve corticocortical communication. To test whether a similar mechanism might influence subcortical-cortical communication, we recorded local field potential activity from retinotopically aligned regions in the lateral geniculate nucleus (LGN) and primary visual cortex (V1) of alert macaque monkeys viewing stimuli known to produce strong cortical gamma-band oscillations. As predicted, we found robust gammaband power in V1. In contrast, visual stimulation did not evoke gamma-band activity in the LGN. Interestingly, an analysis of oscillatory phase synchronization of LGN and V1 activity identified synchronization in the alpha (8 –14 Hz) and beta (15–30 Hz) frequency bands. Further analysis of directed connectivity revealed that alpha-band interactions mediated corticogeniculate feedback processing, whereas beta-band interactions mediated geniculocortical feedforward processing. These results demonstrate that although the LGN and V1 display functional interactions in the lower frequency bands, gamma-band activity in the alert monkey is largely an emergent property of cortex. Key words: cortex; LGN; monkey; oscillations; V1; vision
Introduction Understanding how visual information is dynamically routed across the complex network of visual brain areas is an important and unresolved question. Recent theories on the role of gammaband oscillations in visual processing emphasize a putative role in enhancing interareal interactions (Fries, 2005; Gregoriou et al., 2009). Along these lines, an emerging view is that gamma-band oscillations signal information in the feedforward or bottom-up direction of processing (Buschman and Miller, 2007; Bastos et al., 2012; Bosman et al., 2012; Roberts et al., 2013). Although gamma-band activity in precortical structures has been reported, the evidence in support of this in mammals comes Received Oct. 1, 2013; revised March 31, 2014; accepted April 24, 2014. Author contributions: A.M.B., F.B., G.R.M., and W.M.U. designed research; F.B. and H.J.A. performed research; A.M.B. and H.J.A. analyzed data; A.M.B., F.B., G.R.M., and W.M.U. wrote the paper. Supported by NIH Grants EY013588 (W.M.U.), EY018683 (F.B.), and MH055714 (G.R.M.), and NSF Grants BCS0727115 and BCS-1228535 (G.R.M. and W.M.U.), and an NSF Graduate Research Fellowship 2009 (090358; A.M.B.). We thank K.E. Neverkovec, D.J. Sperka, and R. Oates-O’Brien for assistance, Pascal Fries for advice, and Michael Schmid for comments on the paper. The authors declare no competing financial interests. Correspondence should be addressed to Dr W. Martin Usrey, University of California Davis, 1544 Newton Court, Davis, CA 95618. E-mail:
[email protected]. DOI:10.1523/JNEUROSCI.4216-13.2014 Copyright © 2014 the authors 0270-6474/14/347639-06$15.00/0
from studies that made measurements in anesthetized cats (Neuenschwander and Singer, 1996; Castelo-Branco et al., 1998; Koepsell et al., 2009). Given the influence anesthesia can have on rhythmic brain activity (Xing et al., 2012a; Saxena et al., 2013; Vijayan et al., 2013), it is critical to investigate gamma-band activity and interareal interactions in the alert state. We made simultaneous recordings from the lateral geniculate nucleus (LGN) and primary visual cortex (V1) in alert macaque monkeys to determine whether oscillatory interactions in the gamma-frequency band support feedforward subcortical-tocortical visual processing. Recordings were made while animals passively viewed drifting grating stimuli that have previously been shown to induce significant gamma activity in visual cortex (Bosman et al., 2012; Roberts et al., 2013). Despite finding robust visually evoked gamma-frequency activity in V1, we did not observe visually evoked gamma activity in the LGN. The LGN and V1, however, did display prominent oscillatory interactions, in a broad range of subgamma frequencies, with alpha-band frequencies reflecting corticogeniculate feedback interactions, and beta-band frequencies reflecting geniculocortical feedforward interactions. These results indicate that network gamma-band oscillations observed between visual cortical areas (Gregoriou et al., 2009; Bosman et al., 2012;
7640 • J. Neurosci., May 28, 2014 • 34(22):7639 –7644
Bastos et al. • Oscillatory Interactions Between LGN and V1
Roberts et al., 2013) are an emergent feature of corticocortical interactions, but not geniculocortical interactions.
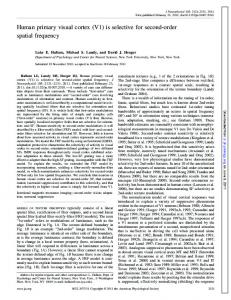
Materials and Methods Four macaque monkeys (Macaca mulatta; two female and two male) were used in this study. All procedures were approved by the Institutional Animal Care and Use Committee at the University of California, Davis, and conformed to NIH guidelines. Surgical procedures were described previously (Briggs and Usrey, 2009). Briefly, under full surgical anesthesia, a head post, and two recording cylinders were secured to the skull. One recording cylinder was positioned above the LGN, and the other was positioned above V1. Visual stimulation. Visual stimuli were generated with a VSG 2/5 (Cambridge Research Systems) and presented on a gamma-calibrated Sony monitor (140 Hz; mean luminance 38 cd/ m 2) located 700 mm in front of the animal. Animals were trained to fixate on a central dot for a liquid reward. Trials were aborted if eye position deviated by ⬎0.35°. Eye position was monitored with an infrared video eye tracker (Applied Science Laboratories; refresh rate 240 Hz). Five hundred ms after obtaining fixation, a drifting sinusoidal grating was presented for 1.2–2.5 s. Grating orientation and spatial fre- Figure 1. Time-frequency response to visual stimulation in the LGN and V1. A, B, Activity profiles for V1 recordings in Monkeys quency were set to match the overall preference B and O, respectively. Color values indicate decreases or increases in power compared with the baseline, in terms of percentage of neurons at the V1 recording site. Stimulus change. Stimulus onset occurred at time 0. The top subplots show the gamma-band (30 –100 Hz), whereas the bottom subplots contrast was 60 –70% (except one session in show the lower-frequencies (4 –30 Hz). Scales set by the maximal or minimal percentage change from baseline, whichever was which the contrast was 20%), temporal fre- largest. Top subplots are masked between 0 and 320 ms prestimulus to avoid a prestimulus artifact caused by juice reward around quency was 4 Hz, and the diameter of the sinu- this time period. Baseline activity was assessed from the artifact-free prestimulus window indicated. The artifact had negligible power at frequencies 4 –30 Hz, so the lower subplots remain unmasked. C, D, Activity profiles for LGN recordings in Monkeys B and soidal grating patch was 2°. Electrophysiology. Twenty-one simultaneous O, respectively. Conventions similar to A and B. recordings of local field potentials (LFPs) were were epoched beginning 0.5 s before stimulus onset to 1 s poststimulus made from the LGN and V1 in two monkeys and 209 single-unit recordonset. ings were made from the LGN in two additional monkeys. For the LFP For the time-frequency analysis (Fig. 1), power was estimated using recordings, single platinum/iridium electrodes (⬃0.1 M⍀; FHC) were sliding windows of 0.2 or 0.25 s duration (for high-frequencies vs lowsemichronically implanted within parafoveal regions of the LGN. V1 frequencies, respectively), centered at 0.4 or 0.375 (high vs low, respecrecordings were made with platinum-in-glass electrodes (0.5–1 M⍀; Altively) seconds before stimulus onset, until 0.75 s after stimulus onset, in pha Omega). Voltage recordings from LGN and V1 electrodes were amsteps of 0.02 s. We first multiplied the 0.2 s data epochs by a discrete plified and recorded by a PC equipped with a Power 1401 data spheroidal sequence of 3 multitapers (Mitra and Pesaran, 1999) and then acquisition system and Spike2 software package (Cambridge Electronic Fourier transformed the resulting sequence, which resulted in Fourier Design). Neuronal activity was recorded at 20 kHz, with a 60 Hz hardcoefficients with a frequency smoothing of ⫾10 Hz and a frequency ware notch filter. Off-line, the signals were low-pass filtered at 120 Hz resolution of 5 Hz. For the lower frequencies (4 –30 Hz) we multiplied the and down-sampled to 1000 Hz to extract LFPs. LGN and V1 electrodes data by a Hanning taper to retain maximal frequency resolution given were placed in precise retinotopic alignment (Briggs et al., 2013), such our window size of 0.25 s (resulting in a frequency resolution of 4 Hz). that receptive fields from the two locations were within ⬍2° of one anPoststimulus-onset power was divided by prestimulus-onset power other in visual space (range: 0.2–1.8°, mean: 1.0°). Online assessment of (from 0.4 to 0.34 s before stimulus onset). For the spectral analyses illusreceptive field overlap was confirmed by offline analysis of event-related trated in Figures 2 and 3 A, B, we used 0.25 s windows and Hanning potentials in the simultaneously recorded LGN and V1 channels. tapers. Single-unit recordings were made from LGN neurons with platinumFor the spectral analysis of the visual stimulation period (Figs. in-glass electrodes (Alpha Omega). Responses were amplified, filtered 3C–F, 4A–C), we used epochs of data beginning 200 ms after the onset and recorded to a PC computer with a Power 1401 data acquisition of visual stimulation. Nonoverlapping windows of 0.5 s together with interface and Spike 2 software (Cambridge Electronic Design). multitapering (using 8 Hz smoothing) were used to optimally detect Data analyses. Analyses of LFP signals were performed using the Fieldthe presence of oscillatory synchronization: we calculated the pairtrip (Oostenveld et al., 2011) open source MATLAB toolbox and custom wise phase consistency (PPC; Vinck et al., 2010) and the phase slope MATLAB scripts (MathWorks). Data were normalized within each reindex (PSI; Nolte et al., 2008) in the frequency range of 1–100 Hz. cording session so that the mean of each channel for each session was zero PPC is a measure of oscillatory synchronization: at each frequency, it and the SD was one. Data were then pooled across sessions. Artifact measure the consistency over trials of phase differences between two rejection was performed using a semiautomatic procedure based on varisignals. PSI is a frequency-resolved measure of the directed influences ance, maximum/minimum, and velocity criteria. Less than 10% of the between two signals. PSI multiplies the phase difference of two sigtrials were rejected. This yielded a total of 1669 (Monkey B) and 1184 nals, which can be used to infer the leading/lagging relationship between two signals at a frequency f, by their coherency at that same (Monkey O) trials. For all nonaborted trials, LGN and V1 recordings
Bastos et al. • Oscillatory Interactions Between LGN and V1
J. Neurosci., May 28, 2014 • 34(22):7639 –7644 • 7641
Results
Figure 2. Power spectra of baseline and visual stimulation periods. A, B, Results from cortical recordings in Monkeys B and O, respectively. Red traces show power during visual stimulation and blue traces show power during the prestimulation baseline in which the monkeys maintained fixation on a central dot. Dotted lines represent the mean ⫾ 2 SEM. Green bars indicate frequency bins that are significantly different between conditions. a.u., Arbitrary units. The spectra are broken between lower frequencies and frequencies surrounding the gamma peak to enhance visualization of the peaks. C, D, Results from LGN recordings in Monkeys B and O, respectively. Conventions similar to A and B.
frequency. This product is integrated over a series of frequency bins to produce an estimate of directed influence at a frequency f. For this analysis, an integration window of ⫾5 Hz was used, although small changes in the integration window did not qualitatively affect the results. When the PSI produces a positive value at a frequency, f, this indicates that V1 precedes LGN (a feedback influence) at that frequency, whereas if the value is negative, it indicates that the LGN precedes V1 (a feedforward influence). Throughout, we have plotted the mean of the power, PPC, and PSI estimates ⫾SEM (calculated using jackknife resampling). These estimates are provided to aid data visualization and to depict the statistical confidence associated with each estimate. Statistical tests. We used nonparametric randomization testing to determine statistical significance of each data feature (stimulus vs baseline power contrast, non-zero PSI, and correlation across sessions between PPC and V1 power) and to correct for multiple comparisons across frequencies. This entails creating a reference distribution by randomizing a particular data feature to test the null hypothesis that, for example: (1) there is no difference between prestimulus power versus poststimulus onset power, (2) there is no significant leading/lagging relationship between the LGN and V1, and (3) there is no significant correlation over sessions between LGN-V1 PPC and V1 power. The reference distribution is created by performing the randomization 1000 times, and for each randomization, taking the maximum and minimum value of the respective data feature over frequencies. This procedure corrects for multiple comparisons over frequencies, and creates a reference distribution to which the empirical value is compared. If the empirical value is greater than the 97.5th percentile of the reference distribution (created from the maximum values over randomizations) or less than the 2.5th percentile value of this reference distribution, (created from the minimum values over randomizations) it is considered statistically significant in a twosided test, corresponding to p ⫽ 0.05.
We made simultaneous recordings of visually evoked responses in the LGN and V1 of two alert macaque monkeys. In V1 of both animals, visual stimulation by the drifting sinusoidal grating increased gamma-band power in the frequency range of ⬃30 –100 Hz (Fig. 1 A, B, top). In contrast, visual stimulation did not significantly modulate power in the gamma frequency range in the LGN (Figs. 1C,D, top). Instead, power modulation in the LGN was concentrated at lower-frequencies, with visual stimulation decreasing beta-band power (20 –30 Hz) and increasing alphaband power (centered at 10 Hz; Fig. 1C,D, bottom). Within the LGN, the onset of low-frequency events begins slightly before the onset of visual stimulation, which may reflect activity changes associated with fixation and/or stimulus expectation. To characterize the visually induced modulations of gamma-band activity further, we compared spectral power in the baseline period (500 –250 ms before visual-stimulationonset) with a time window centered from 100 to 350 ms poststimulus onset. Figure 2 shows the respective power spectra for the LGN and V1. These spectra confirm the presence of an oscillatory gamma-band peak in the cortex (⬃30 –55 Hz) but not in the LGN. In the cortex, this peak increased significantly with visual stimulation (frequencies of increase: Monkey B, 16 – 100 Hz; Monkey O, 28 –100 Hz; p ⬍ 0.05, randomization test; Fig. 2 A, B). Along these lines, the stimulus-to-baseline power ratio revealed that the gamma frequency that was maximally enhanced by visual stimulation was 44 Hz in Monkey B, and 52 Hz in Monkey O (Fig. 3 A, B). Although visual stimulation did not affect gamma power in the LGN ( p ⬎ 0.05, randomization test), visual stimulation did modulate lower frequency power (Fig. 2C,D). In particular, alpha-band power was enhanced (frequencies of increase: 4 –10 Hz, Monkey B, p ⬍ 0.05, nonsignificant but similar trend in Monkey O, randomization test) and beta-band power was reduced (frequencies of reduction: 22–26 Hz, Monkey B, p ⬍ 0.05, 18 –34 Hz; Monkey O, p ⬍ 0.05, randomization test). The gamma-frequency spectral modulations were consistent over recording sessions. In V1, all sessions showed gamma band increases with visual stimulation (range of percentage increase of gamma power from baseline in V1: 3 to 1868% increase, mean ⫽ 210%). The variability in gamma-band power was likely a result of the laminar position of the V1 electrode, which was variable over sessions (Maier et al., 2010; Buffalo et al., 2011; Xing et al., 2012b). In the LGN, gamma power modulations were inconsistent over sessions (16 sessions showed weak decreases, 5 showed weak increases, most sessions showed ⬍10% modulation in either direction). Therefore, consistent stimulus-dependent gamma-frequency power increases were restricted to the cortex and not observed in the LGN. To determine at which frequencies the LGN and V1 interact, we investigated oscillatory synchronization using the PPC measure (Vinck et al., 2010). The PPC spectrum between the LGN and cortex displayed a pronounced peak in the beta range (28 Hz in Monkey B, 20 Hz in Monkey O; Fig. 3C,D). We next examined directed interactions using the PSI (Nolte et al., 2008). In both monkeys, we observed two prominent peaks in the PSI spectra, indicating feedforward interactions in the beta-frequency range (16 –28 Hz in Monkey B, 14 –26 Hz in Monkey O) and feedback interactions in the alpha-frequency range (6 –12 Hz in Monkey B, 8 –12 Hz in Monkey O; Fig. 3E, F; p ⬍ 0.05, randomization test). These findings indicate that gamma-band synchronization in V1 is likely produced via cortical mechanisms, because at the V1 gamma frequencies that were most strongly enhanced by visual
7642 • J. Neurosci., May 28, 2014 • 34(22):7639 –7644
Bastos et al. • Oscillatory Interactions Between LGN and V1
stimulation (44 Hz in Monkey B and 52 Hz in Monkey O; Fig. 3 A, B), directed interactions between the LGN and cortex were not significantly different from zero (Fig. 3 E, F ). To rule out the possibility that gamma oscillations were present in the spiking activity of LGN neurons but not detectable in the LFP, we analyzed single-unit spiking data from two additional alert monkeys performing a similar fixation task while recorded neurons were excited with a drifting grating stimulus. Using 500 ms windows and multitaper spectral estimation with 8 Hz smoothing together with randomization testing, we tested whether the spiking activity of single neurons (n ⫽ 209; 84 cells in Monkey C, 52 P cells and 32 M cells); 125 cells in Monkey Bl, 58 P cells and 67 M cells) showed significant gamma-band power (relative to a spike shuffle control) that was also enhanced by visual stimulation. Furthermore, because Fourier analysis of spiking activity can result in frequency components that are related to bursting and refractory period behavior but not oscillations (Mures¸an et al., 2008), we examined whether these cells had oscillatory side lobes in the autocorrelograms corresponding to the peak Figure 3. Power modulation spectra in V1 and LGN-V1 interactions. A, B, Ratio of baseline to visual stimulation power across frequency in the gamma-band. In Mon- cortical recordings in Monkeys B and O, respectively. Dashed lines indicate confidence levels for significant deviations at p ⬍ 0.05. key C, no cells showed gamma oscillations C, D, LGN-V1 oscillatory synchronization, measured by the PPC, during visual stimulation. Dotted lines indicate the mean ⫾ 2 SEM. according to these criteria, whereas in E, F, LGN-V1 directed interactions, measured by the PSI. Dashed lines indicate the statistical significance threshold at p ⬍ 0.05. Monkey Bl, only two cells showed gamma Positive values above the dashed line indicate significant directed influences from V1 to LGN (feedback influences), negative values oscillations (data not shown). These re- below the dashed line indicate significant directed influences from LGN to V1 (feedforward influences). Dotted lines indicate the sults are consistent with those from the mean ⫾ 2 SEM. LFP analyses (Figs. 1–3), indicating that induce rhythmic gamma-band activity in the LGN. Therefore, LGN temporal dynamics are either very weakly or not at all oscilcommunication between LGN and V1 in alert animals during latory in the gamma-frequency band. visual stimulation is not dependent on subcortical– cortical Last, we hypothesized that if gamma-band power increases in gamma synchronization. Interestingly, however, subcortical– V1 are directly derived from LGN inputs, we should see a systemcortical synchronization was present between the LGN and V1 at atic relationship between LGN–V1 interactions, as measured lower-frequencies, peaking at 20 and 28 Hz and encompassing a with the PPC, and gamma power in V1. To test this, we computed broad range of frequencies from ⬃8 to 38 Hz. Within this frethe correlation between the LGN-V1 PPC in the 8 –38 Hz range quency range, analysis of directed influences revealed that the and power in V1 at each frequency from 2 to 100 Hz, across alpha-band (8 –12 Hz) reflected feedback (V1 to LGN) influrecording sessions (Fig. 4A). The resulting correlation spectrum ences, whereas the beta-band (15–30 Hz) reflected feedforward revealed that whereas LGN-V1 phase synchronization was posi(LGN to V1) influences. tively correlated with low-frequency V1 power (2–10 Hz, permuA correlation between the strength of LGN-V1 oscillatory syntation test for multiple comparisons, r ⫽ 0.71, p ⬍ 0.05; Fig. 4B), chronization with V1 gamma-band power across sessions reit was negatively correlated with gamma power in V1 (26 – 48 Hz, vealed a negative correlation suggesting that V1 gamma same test, r ⫽ ⫺0.70, p ⬍ 0.05; Fig. 4C), and not significantly oscillations are not directly inherited from feedforward LGN incorrelated with high-gamma (50 –100 Hz) power. These results put. At the same time, V1 low-frequency (2–10 Hz) power was suggest that V1 populations that are the most strongly driven by positively correlated with LGN–V1 interactions. Previous studies direct feedforward LGN inputs are the least gamma-modulated have shown that whereas supragranular V1 populations (above by visual stimulation. Together, these results support the notion layer 4C) express the strongest gamma power within V1, infrathat visually evoked gamma oscillations arise in the cortex. granular (L5/6) V1 populations express the strongest lowDiscussion frequency power (Xing et al., 2012b; Smith et al., 2013). Therefore, the most likely interpretation of the correlations beWe made simultaneous recordings of LFPs from retinotopically tween LGN-V1 oscillatory synchronization and V1 power is that corresponding regions of the LGN and V1 in alert macaque monsessions with relatively strong gamma-band power in V1 rekeys to investigate the presence, strength, and communication of corded activity from the supragranular layers, whereas sessions rhythmic activity in the two structures. Whereas visual stimulation induced robust gamma-band oscillations in V1, it did not with relatively strong low-frequency power in V1 sampled neu-
Bastos et al. • Oscillatory Interactions Between LGN and V1
J. Neurosci., May 28, 2014 • 34(22):7639 –7644 • 7643
Figure 4. Session by session correlation of LGN-V1 PPC and V1 power, and schematic of LGN-V1 connectivity. A, Correlation spectrum between LGN-V1 PPC and V1 power. Dashed lines denote correlation values that are significant at p ⬍ 0.05. B, C, Power by PPC scatter plots of the V1 frequencies (B, 2–10 Hz; C, 26 – 48 Hz) that are significantly positively (B) and negatively (C) correlated with LGN-V1 PPC across sessions (N ⫽ 21). D, Schematic of functional and anatomical connections. The lines interconnecting areas or subpopulations indicate anatomical connections. Dotted lines indicate secondary (weaker) projections. Where functional data exist to indicate which frequency bands mediate the synaptic interactions (Maier et al., 2010; Buffalo et al., 2011; Xing et al., 2012b), the corresponding frequency is indicated.
ronal activity from the infragranular layers. This would mean that the V1 layers with strongest reciprocal anatomical connectivity to the LGN (granular and infragranular) are also the layers that synchronize to the LGN with oscillations in the subgamma range. Future studies with laminar resolution will be needed to confirm these predictions. Previous reports have described robust gamma-frequency (25–110 Hz) oscillatory activity in the spike trains of neurons in the retina, LGN, and V1 (Neuenschwander and Singer, 1996; Castelo-Branco et al., 1998). Moreover, intracellular measurements indicate that cells in the retina and LGN are able to code visual information in spike times relative to the ongoing gamma oscillation (Koepsell et al., 2009). Therefore, it is important to consider why gamma-band activity is not evident in the activity of LGN neurons in the current study. One possibility is that the differences may be due to the species studied. Previous reports of gamma oscillations in the LGN come from studies using anesthetized cats. In the cat, recurrent connections between excitatory
cells and inhibitory cells, which are thought to be necessary to establish pyramidal-interneuron network gamma (PING; Buzsa´ki and Wang, 2012), are present within the LGN (Bickford et al., 2008). However, such connectivity, to our knowledge, has not been found in the macaque LGN. Another possibility is the use of anesthesia. The current study was conducted using alert monkeys. To our knowledge, gamma-band oscillations in the LGN have not been reported in the alert state. Furthermore, recent studies indicate that anesthesia profoundly modulates gammaband synchronization in visual cortex compared with the alert state and may affect gamma in different ways depending on the anesthetic agent and its synaptic and network-level effects (Xing et al., 2012a; Saxena et al., 2013). The results from the current study reveal synchronization between the LGN and V1 at alpha and beta frequencies, with the faster frequency (beta) involved in feedforward communication and the slower frequency (alpha) involved in feedback communication. A dissociation between higher and lower frequencies for
7644 • J. Neurosci., May 28, 2014 • 34(22):7639 –7644
transferring feedforward and feedback information, respectively, has been proposed as a general mechanism for corticocortical communication (Bastos et al., 2012). This segregation of putative feedforward and feedback processing through faster and slower frequencies has also been observed in corticostriatal (Litvak et al., 2012), and hippocampus to entorhinal cortex (Colgin et al., 2009) interactions, and therefore may be a generic mechanism across systems. Although speculative, this property of neuronal activity could provide a means for brain areas to segregate input and output activity (Bastos et al., 2012), and may play an important role in signaling top-down predictions and bottom-up prediction errors among different hierarchical processing levels (Friston, 2008). Considering the results of the present study in combination with previous studies, we propose the following model of LGN-V1 dynamics (Fig. 4D). In this model, the LGN provides strong feedforward input with energy in the beta-frequency band to cells in layer 4C of V1. These cell populations provide strong, intrinsic “feedforward” connections to the superficial layers (Alonso and Martinez, 1998). Pyramidal cells and interneurons in the superficial layers, with reciprocal connections interconnecting them, could then form a minimal circuit capable of generating a gamma-frequency rhythm (a “PING” network; Buzsa´ki and Wang, 2012). Cells in the infragranular layers of V1, including corticogeniculate neurons in layer 6, then synchronize their responses in a lower frequency band (Bollimunta et al., 2011; Buffalo et al., 2011; ⬍20 Hz), leading to the observed directed corticogeniculate influences in the alpha range (Fig. 3 E, F ). Future studies with laminar resolution will be needed to confirm these predictions, and to discover which mechanisms mediate both the functional segregation and integration of oscillatory synchronization at different frequencies.
References Alonso JM, Martinez LM (1998) Functional connectivity between simple cells and complex cells in cat striate cortex. Nat Neurosci 1:395– 403. CrossRef Medline Bastos AM, Usrey WM, Adams RA, Mangun GR, Fries P, Friston KJ (2012) Canonical microcircuits for predictive coding. Neuron 76:695–711. CrossRef Medline Bickford ME, Wei H, Eisenback MA, Chomsung RD, Slusarczyk AS, Dankowsi AB (2008) Synaptic organization of thalamocortical axon collaterals in the perigeniculate nucleus and dorsal lateral geniculate nucleus. J Comp Neurol 508:264 –285. CrossRef Medline Bollimunta A, Mo J, Schroeder CE, Ding M (2011) Neuronal mechanisms and attentional modulation of corticothalamic alpha oscillations. J Neurosci 31:4935– 4943. CrossRef Medline Bosman CA, Schoffelen JM, Brunet N, Oostenveld R, Bastos AM, Womelsdorf T, Rubehn B, Stieglitz T, De Weerd P, Fries P (2012) Attentional stimulus selection through selective synchronization between monkey visual areas. Neuron 75:875– 888. CrossRef Medline Briggs F, Usrey WM (2009) Parallel processing in the corticogeniculate pathway of the macaque monkey. Neuron 62:135–146. CrossRef Medline Briggs F, Mangun GR, Usrey WM (2013) Attention enhances synaptic efficacy and the signal-to-noise ratio in neural circuits. Nature 499:476 – 480. CrossRef Medline Buffalo EA, Fries P, Landman R, Buschman TJ, Desimone R (2011) Laminar differences in gamma and alpha coherence in the ventral stream. Proc Natl Acad Sci U S A 108:11262–11267. CrossRef Medline Buschman TJ, Miller EK (2007) Top-Down versus bottom-up control of
Bastos et al. • Oscillatory Interactions Between LGN and V1 attention in the prefrontal and posterior parietal cortices. Science 315: 1860 –1862. CrossRef Medline Buzsa´ki G, Wang XJ (2012) Mechanisms of gamma oscillations. Annu Rev Neurosci 35:203–225. CrossRef Medline Castelo-Branco M, Neuenschwander S, Singer W (1998) Synchronization of visual responses between the cortex, lateral geniculate nucleus, and retina in the anesthetized cat. J Neurosci 18:6395– 6410. Medline Colgin LL, Denninger T, Fyhn M, Hafting T, Bonnevie T, Jensen O, Moser MB, Moser EI (2009) Frequency of gamma oscillations routes flow of information in the hippocampus. Nature 462:353–357. CrossRef Medline Fries P (2005) A mechanism for cognitive dynamics: neuronal communication through neuronal coherence. Trends Cogn Sci 9:474 – 480. CrossRef Medline Friston K (2008) Hierarchical models in the brain. PLoS Comput Biol 4:e1000211. CrossRef Medline Gregoriou GG, Gotts SJ, Zhou H, Desimone R (2009) High-frequency, long-range coupling between prefrontal and visual cortex during attention. Science 324:1207–1210. CrossRef Medline Koepsell K, Wang X, Vaingankar V, Wei Y, Wang Q, Rathbun DL, Usrey WM, Hirsch JA, Sommer FT (2009) Retinal oscillations carry visual information to cortex. Front Syst Neurosci 3:4. CrossRef Medline Litvak V, Eusebio A, Jha A, Oostenveld R, Barnes G, Foltynie T, Limousin P, Zrinzo L, Hariz MI, Friston K, Brown P (2012) Movement-related changes in local and long-range synchronization in Parkinson’s disease revealed by simultaneous magnetoencephalography and intracranial recordings. J Neurosci 32:10541–10553. CrossRef Medline Maier A, Adams GK, Aura C, Leopold DA (2010) Distinct superficial and deep laminar domains of activity in the visual cortex during rest and stimulation. Front Syst Neurosci 4:31. CrossRef Medline Mitra PP, Pesaran B (1999) Analysis of dynamic brain imaging data. Biophys J 76:691–708. CrossRef Medline Mures¸an RC, Jurjut¸ OF, Moca VV, Singer W, Nikolic´ D (2008) The oscillation score: an efficient method for estimating oscillation strength in neuronal activity. J Neurophysiol 99:1333–1353. CrossRef Medline Neuenschwander S, Singer W (1996) Long-range synchronization of oscillatory light responses in the cat retina and lateral geniculate nucleus. Nature 379:728 –732. CrossRef Medline Nolte G, Ziehe A, Nikulin VV, Schlo¨gl A, Kra¨mer N, Brismar T, Mu¨ller KR (2008) Robustly estimating the flow direction of information in complex physical systems. Phys Rev Lett 100:234101. CrossRef Medline Oostenveld R, Fries P, Maris E, Schoffelen JM (2011) FieldTrip: open source software for advanced analysis of MEG, EEG, and invasive electrophysiological data. Comput Intell Neurosci 2011:156869. CrossRef Medline Roberts MJ, Lowet E, Brunet NM, Ter Wal M, Tiesinga P, Fries P, De Weerd P (2013) Robust gamma coherence between macaque V1 and V2 by dynamic frequency matching. Neuron 78:523–536. CrossRef Medline Saxena N, Muthukumaraswamy SD, Diukova A, Singh K, Hall J, Wise R (2013) Enhanced stimulus-induced gamma activity in humans during propofol-induced sedation. PloS One 8:e57685. CrossRef Medline Smith MA, Jia X, Zandvakili A, Kohn A (2013) Laminar dependence of neuronal correlations in visual cortex. J Neurophysiol 109:940 –947. CrossRef Medline Vijayan S, Ching S, Purdon PL, Brown EN, Kopell NJ (2013) Thalamocortical mechanisms for the anteriorization of alpha rhythms during propofolinduced unconsciousness. J Neurosci 33:11070 –11075. CrossRef Medline Vinck M, van Wingerden M, Womelsdorf T, Fries P, Pennartz CM (2010) The pairwise phase consistency: a bias-free measure of rhythmic neuronal synchronization. Neuroimage 51:112–122. CrossRef Medline Xing D, Shen Y, Burns S, Yeh CI, Shapley R, Li W (2012a) Stochastic generation of gamma-band activity in primary visual cortex of awake and anesthetized monkeys. J Neurosci 32:13873–13880a. CrossRef Medline Xing D, Yeh CI, Burns S, Shapley RM (2012b) Laminar analysis of visually evoked activity in the primary visual cortex. Proc Natl Acad Sci U S A 109:13871–13876. CrossRef Medline