articles
© 2002 Nature Publishing Group http://www.nature.com/natureneuroscience
Spatial coding of position and orientation in primary visual cortex William H. Bosking, Justin C. Crowley and David Fitzpatrick Dept. of Neurobiology, Box 3209, Duke University Medical Center, Durham, North Carolina 27710, USA Correspondence should be addressed to D.F. (
[email protected])
Published online: 19 August 2002, doi:10.1038/nn908 We examined the spatial distribution of population activity in primary visual cortex (V1) of tree shrews with optical imaging and electrophysiology. A line stimulus, thinner than the average V1 receptive field, evoked a broad strip of neural activity of nearly constant size for all stimulus locations tested within the central 10° of visual space. Stimuli in adjacent positions activated highly overlapping populations of neurons; nevertheless, small changes in stimulus position produced orderly changes in the location of the peak of the population response. Statistically significant shifts in the population response were found for stimulus displacements an order of magnitude smaller than receptive field width, down to the limit of optical imaging resolution. Based on the pattern of population activity, we conclude that the map of visual space in V1 is orderly at a fine scale and has uniform coverage of position and orientation without local relationships in the mapping of these features.
Within primary visual cortex, visual stimuli evoke a complex distributed pattern of neural activity whose spatial and temporal properties are thought to encode the features of the stimulus. Despite its significance for understanding the neural representation of stimulus features, the spatial distribution of neurons activated by a single visual stimulus has seldom been visualized1,2. Population activity patterns for simple stimuli are most often inferred from single unit recordings, taking into account the tuning of individual neurons for stimulus attributes and the mapping of these properties across the cortical surface3–5. Hubel and Wiesel4 first used this approach to predict the size and spatial organization of the neural activity in V1 that would be evoked by a thin line stimulus. They envisioned the active population occupying a strip of cortex at least 1 mm in width, punctuated by hot spots of activity reflecting the joint constraints imposed by the orderly mapping of visual space, orientation preference and ocular dominance. Although most of these predictions about the population response to simple stimuli were confirmed by subsequent two-deoxyglucose labeling experiments1, several key questions remain. First, how sensitive is the spatial distribution of population activity to small changes in stimulus position? In principle, changes in the distribution of population activity could yield a representation of stimulus position that is much finer than the receptive field sizes of individual neurons6–9, but this prediction has never been tested experimentally and depends on an orderly fine-scale mapping of visual space. Although there is little question about orderly mapping at coarse and moderate spatial scales1,10–13, at distances less than a millimeter, scatter in receptive field positions of nearby neurons obscures this orderly relationship3,14–16. Furthermore, in cat visual cortex, there is evidence for pronounced jumps in the mapping of visual space at fine scales. For example, in some cases, sites in V1 separated by less than 200 µm have largely non-overlapping receptive fields17,18. These results predict considerable variability in the size, shape 874
and displacement of population activity for small changes in stimulus position, factors that would limit reliable population coding of stimulus position. Second, how uniform is the size of the population response for various combinations of stimulus orientation and position? At a given eccentricity, uniformity in the size of the population response (uniform coverage) is thought to be necessary to ensure equal processing capabilities for all stimulus orientations at each location in space 4,19–21 . The degree to which uniformity is achieved, however, depends at least in part on how orientation preference and visual space are mapped in relation to each other. Imaging studies demonstrate that the map of orientation preference is inhomogeneous: in some regions, the progression of orientation preference is slow and smooth, whereas in other regions (such as pinwheel centers), neighboring sites prefer orthogonal orientations22–25. Furthermore, these irregularities in the mapping of orientation preference may be correlated with irregularities in the mapping of visual space. Results from mathematical models suggest that an inverse relationship between rate of change in orientation preference and position preference might result as a natural consequence of mapping multiple features onto the two-dimensional cortical surface and might be required to ensure uniformity in coverage26,27. In contrast, experimental evidence suggests a positive correlation between the rate of change in position preference and orientation preference in the cat visual cortex17,18, a relationship that would be expected to produce significant variability in the size of the active population. Addressing these issues requires a technique that permits highresolution monitoring of the spatial distribution of activity evoked by different stimuli in the same region of cortex. Here we describe the distribution of activity evoked by a thin line stimulus in V1 of the tree shrew using both intrinsic signal imaging techniques24,28–31 and electrophysiological recordings. Our results show that this stimulus activates large populations of neurons in visual cortex and that stimuli presented to nearby regions of visunature neuroscience • volume 5 no 9 • september 2002
articles
© 2002 Nature Publishing Group http://www.nature.com/natureneuroscience
a
b
al space result in distributions of activity that overlap significantly. Nevertheless, these populations are highly structured and shift in predictable ways with small changes in stimulus position.
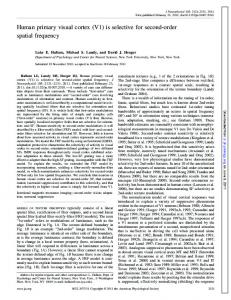
RESULTS Population response size and progression We investigated the distribution of neural activity resulting from a spatially restricted stimulus using an elongated bar (0.25° × 60°) panned rapidly back and forth over 1° of visual space. When presented to different locations within the central 10° of the visual field, this stimulus activated a strip of V1 approximately 1 mm in width (Fig. 1a). Within the activated region, there was periodic variation in the magnitude of the signal, consistent with the layout of orientation domains within this
Fig. 1. Cortical activity pattern (population response) elicited by presentation of a single bar stimulus. (a) Single-condition image indicating cortical response to a vertical bar (solid bar shown in inset; dashed bar represents vertical meridian in this and subsequent figures) as compared to a blank screen. The dark areas indicate regions of cortex that responded strongly to the stimulus. The long axis of the optical imaging window was aligned with the V1/V2 border so that iso-azimuth lines in visual space run horizontally across the imaging window. (b) Orientation specificity of the response to a single bar. Areas of strongest response to the vertical bar (top 20% of the pixel values, red overlay; top 40%, blue overlay) are shown over an orientation difference image in which dark areas are regions of cortex that were preferentially activated by a vertical grating (inset). Scale bar, 1 mm (a, b).
region of the cortex; however, areas of cortex that had an orientation preference orthogonal to the stimulus were still activated above background (Fig. 1b). The population response was remarkably consistent in width and moved in a regular fashion across the cortical surface (Fig. 2a and b). For the case shown in Fig. 2, the full-width at half-height of the population response for different positions was 1.26 ± 0.20 mm. Similar results were obtained for 9 additional series of stimuli from 7 animals (vertical bar series, 1.13 ± 0.32 mm, n = 6; horizontal bar series, 1.01 ± 0.30 mm, n = 3; overall average population response width, 1.09 ± 0.32 mm, n = 9). The population response for stimuli separated by 1° in visual space was highly overlapping (∼80%; Fig. 2a–c). Nevertheless, the peak response shifted in a very consistent fashion for each 1° change in stimulus position (r2 = 0.993; Fig. 2c). A similar relationship was observed in all cases (vertical bar series, r2 = 0.980, n = 6; horizontal bar series, r2 = 0.982, n = 3; overall, r2 = 0.981, n = 9). Furthermore, the slope of the linear regression, which
Fig. 2. Population responses and position preference progress in a smooth and continuous fashion across the surface of V1. (a) Population responses to the elongated bar stimulus presented at 10 different screen positions spaced at 1° intervals. (b) Population response profiles obtained from positions 3 (solid black), 5 (dashed black), 7 (solid gray) and 9 (dashed gray) in (a). The rectangle on position number 7 in (a) outlines the 1 mm cross section over which the pixel values were averaged. (c) Population response profile progression with displacement of the stimulus. The peak of each response profile is indicated by the black diamonds, and the shaded bars indicate the full-width at half-height. (d) Position tuning curves for the sites indicated by colored circles in (a). Each curve shows the grayscale value for that pixel location for each of the 10 positions tested. (e) Position preference map generated from the series of 10 images shown in (a) for the region of cortex indicated by the brackets on position 7. Position preference is color coded (key at right). Areas of cortex that had a position preference of < 3° or > 9° are depicted in gray because the Gaussian fitting procedure was less reliable near the limits of the sampled region of visual space. Black lines indicate iso-azimuth contour lines spaced at 0.5° intervals beginning with an azimuth 3° right of the center of the screen. Scale bars, 1 mm (a, e). nature neuroscience • volume 5 no 9 • september 2002
875
© 2002 Nature Publishing Group http://www.nature.com/natureneuroscience
articles
Fig. 3. Electrophysiological recordings confirm position tuning derived from intrinsic signal imaging. (a) Population response to presentation of a bar at position 5 in the series of 16 stimuli used in this experiment. Multi-unit activity was recorded at site 5, in the middle of the active region, and at site 9, in a region that was outside the active region for this stimulus position. (b) Position tuning curves obtained by recording multi-unit activity at sites marked 5 and 9 in (a). The same bar stimulus that was used for optical imaging was shown at 1 of 16 different positions spaced at 1° intervals. Note the complementary tuning curves for these two recording sites: responses for site 5 are most robust at stimulus position 5 and are absent at stimulus position 9, whereas the opposite is seen for site 9. (c) Correlation (r2 = 0.83; n = 23) between peaks of the position preference curves obtained by electrophysiology and optical imaging methods. Scale bar, 1 mm.
provides an estimate of the magnification factor, was also very consistent (vertical bar series, 206 µm/°, n = 6; horizontal bar series, 174 µm/°, n = 3; overall, 196 µm/°, n = 9). The central visual field representation is essentially isotropic: the ratios of vertical to horizontal magnification factor in two cases where both were examined were 1.03 and 0.98. To evaluate the minimal separation distance at which reliable shifts in the population response occur, in one animal we evaluated the population response for stimuli that were separated by distances ranging from 0.125° to 9° of visual space. Statistically significant differences were found for stimulus separation distances down to 0.49°, which corresponds to separations in the peaks of the population response of approximately 100 µm on the cortical surface (Supplementary Methods and Supplementary Fig. 1 online). Similar estimates (0.55° and 0.63°) were obtained in two additional animals in which the sampled distances ranged from 1° to 7° and from 1° to 9°. Thus, orderly changes in the location of the peak of the population response are to be expected down to the limits of our ability to examine the issue with optical imaging of intrinsic signals30,31. These small separation distances are roughly an order of magnitude smaller than the average receptive field width of tree shrew layer 2/3 neurons (4.7°, see next section; 5°, F. Mooser et al., Soc. Neurosci. Abstr. 26, 53.14, 2000). Position preference maps Position preference maps were derived from position tuning curves constructed for each pixel in the imaged area (Fig. 2a, d and e). In all cases examined (n = 5), the position preference map revealed a smooth progression of position preference across V1, with a nearly constant rate of change of position preference and with no reversals, jumps or other abnormalities. Multi-unit electrophysiological recordings confirmed that the position tuning curves derived from optical imaging were in accord with measurements of spiking activity evoked by the same stimuli (Fig. 3a and b). The position preferences for individual sites calculated from optical imaging data and from electrophysiological data were well correlated (r2 = 0.83, n = 23; Fig. 3c). Furthermore, the average full-width at half-height of position tuning determined for each of these sites by the two methods was similar (optical imaging, 3.9 ± 1.3°; electrophysiology, 5.0 ± 2.9°; n = 23). Overall, the full-width at half-height of position tuning for all sites from which we recorded multi-unit activity was 4.7 ± 2.5° (n = 39), whereas analyzing optical imaging data from large regions of V1 in several animals gave a full-width at half-height of 4.9 ± 0.8°. Our determination of a site’s position preference was made without regard to the site’s preferred orientation: oscillating vertical or horizontal bars were used to probe position tuning of 876
sites that included the full range of orientation preferences. Thus, the conclusion that the map of position preference is smooth and continuous assumes that a site’s position preference is independent of the stimulus orientation used to derive it. To test this assumption, in three animals we used unit recordings to evaluate the azimuthal position tuning of individual sites by presenting long (60°) vertical bars panned left–right within a 1° window and short (1°) horizontal bars panned up and down within the same region of the screen. Position tuning curves obtained by the two methods were quite similar, and the position preferences were highly correlated (r2 = 0.72). The average difference in position tuning (0.6 ± 0.5°) was small compared to the average width of a layer 2/3 cell receptive field (5°). Activation patterns resulting from two stimuli The population response profiles and position preference maps obtained in response to single line stimuli were highly stereotyped within and across individuals. However, presentation of additional stimuli could reveal non-linearities in the patterns of activity; namely, changes in the size, shape and progression of the population response not predicted from the response to single stimuli. As a simple test of the stability of these activation patterns, we performed optical imaging experiments with two bar stimuli presented simultaneously (Fig. 4a). The two bars oscillated in phase and were presented at separations ranging from 1 to 10°. At small separations (1–2°), a single pattern of activity was apparent; in contrast, two distinct activity patterns were nature neuroscience • volume 5 no 9 • september 2002
articles
© 2002 Nature Publishing Group http://www.nature.com/natureneuroscience
Fig. 4. Orderly progression of population response is unaltered by the presence of an additional line stimulus. (a) Population response for a series of two bar stimuli. For each separation, the population response is shown for position 1 alone (P1; position held constant), position 2 alone (P2; position varied), and for bars presented at both P1 and P2 simultaneously (P1P2). The separation between the bars is indicated along the right. (b) The peak of the population response related to stimulus P2 plotted for both one bar (gray square) and two bar (white circle) conditions for various stimulus separations (Methods). Progression of the peak of activity related to P2 is unaltered by the presence of P1.
always evident at larger separations (5–6°). At intermediate separations (3–4°), two peaks were apparent in the population response, but the activity did not return to baseline levels between the peaks. At all separations, the area of activation was predictable from the responses to the two individual stimuli. The locations of the activity peaks in the two bar condition were in good agreement with the peaks of activity obtained when stimuli were placed at the same positions in isolation; furthermore, the regular progression of the population response observed with single bars was still evident and had essentially the same slope in the twobar condition (Fig. 4b). Independent mapping of orientation and position The orderly change in the position of the population response profiles suggests that the local structure of the map of visual space is independent of the mapping of orientation preference, which nature neuroscience • volume 5 no 9 • september 2002
shows considerable variation in both rate and direction of change over the same region. We confirmed this by overlaying isoazimuth contour lines from the map of visual space over the orientation preference map for the same region (Fig. 5a), and over an image indicating the rate of change in orientation preference (Fig. 5b). In some regions of the orientation map, orientation preference changed rapidly and multiple pinwheel centers were evident, whereas in other regions, orientation preference changed much more slowly. Nevertheless, position preference changed at a very similar rate in these different regions as judged by the distance between the position preference contour lines. In a different animal, we used optical imaging to obtain higher-resolution maps of both orientation preference and visual space (Fig. 5c). Population responses were obtained for a vertical bar located at nine different positions spaced at 1° intervals (Supplementary Fig. 2). The iso-azimuth contour lines from the position preference map revealed a smooth progression of position preference across the sampled region, whereas the orientation preference map exhibited variability in structure, with several pinwheel centers. To confirm the regular progression of the position preference map in this case, we made a series of 14 electrophysiological recordings spaced at approximately 50 µm intervals (Fig. 5d). The progression of position preferences determined by the physiological recordings was well fit by a line (r2 = 0.86). Although the match between the electrophysiology and optical imaging data was not exact, the change in position preference between adjacent recording sites never exceeded 1°. Differences between electrophysiological and imaging estimates of position preference are likely the result of small errors in electrode placement, listening distance of the electrodes, and scatter in receptive field positions for individual sites. Indeed, the position preference for the recording sites fell within the range expected given our estimates of the likely variation from these sources (gray bars, Fig. 5d; Methods and Supplementary Methods). The independence of position and orientation mapping was evaluated quantitatively by comparing the change in position preference and orientation preference for all possible pairs of recording sites shown in Fig. 5c and d. Separation distance between recording sites was well correlated with difference in position preference (Fig. 6a, r2 = 0.652) as well as with orientation path length (total change in orientation preference along the line connecting two recording sites; Methods; Fig. 6b, r2= 0.814). However, there was no consistent relationship between rate of change in orientation preference and rate of change in position preference (Fig. 6c, r2 = 0.004). A similar analysis was applied to the optical imaging data for position and orientation obtained from this case using 500 pairs of randomly selected pixels located less than 800 µm apart (Fig. 6d–f). Change in position preference was well correlated with the cortical distance separating the pair of sites (Fig. 6d, r2 = 0.936), as was orientation path 877
© 2002 Nature Publishing Group http://www.nature.com/natureneuroscience
articles
Fig. 5. The fine mapping of visual space is independent of the map of orientation preference. (a) Iso-azimuth contour lines from the map of visual space (0.5° intervals) shown over the orientation preference map for the same region (same animal and region as in Fig. 2). Orientation preference is color coded (key beneath panel). (b) Iso-azimuth contour lines from the map of visual space (red) shown over an orientation rate of change map. Rate of change of orientation preference is coded as grayscale (key beneath panel). For this comparison, the rate of change in orientation was calculated specifically along the vertical axis of the image, corresponding to the axis along which we were examining the mapping of position preference. (c) High-resolution map of orientation preference, color coded as in (a), and position preference (iso-azimuth contours spaced at 1° intervals, shown in black) obtained in a separate animal. (d) Progression of position preference determined by optical imaging and multi-unit recording at the 14 recording sites indicated in (c). Position preference at each site determined from the optical imaging data (gray squares) and by multi-unit physiological recording (white circles). Gray bars represent the expected range for the unit recording data, given known sources of error (Methods and Supplementary Methods). Scale bar, 1 mm (a, b); 200 µm (c).
length (Fig. 6e, r2 = 0.714). In contrast, rate of change in position preference was not correlated with rate of change in orientation preference (Fig. 6f, r2 = 0.002). Analysis of all the position preference maps examined (4 maps of the vertical axis of visual space and 1 map of the horizontal axis of visual space from 4 animals) confirmed that change in position preference was well correlated with separation on the cortex (r2 = 0.938 ± 0.019), as was orientation path length (r2 = 0.646 ± 0.064), whereas there was no relationship between the rate of change of position and the rate of change in orientation preference (r2 = 0.011 ± 0.010). Coverage uniformity analysis The constant size of the population response at different stimulus positions and for orthogonal stimulus orientations suggests that coverage for orientation and position is relatively uniform: that is, the same number of neurons will be activated by a stimulus of a given size, regardless of its orientation and position in the central region of visual space. We quantified the degree of coverage uniformity using position and orientation preference data from one animal (Fig. 7a). As expected, the number of pixels representing each of four stimulus orientation bins was variable when the analysis simulated a small population response (1° position bin size, Fig. 7b and c), but was much more uniform when the analysis simulated a larger population response (4° position bin size, Fig. 7d). The relationship between coverage uniformity and the size of the population response was quantified using a coverage uniformity index (standard deviation in number of pixels per bin/mean number of pixels per bin)21. Values over 1 for this index indicate large variability in the representation of orientation preference. A small population response was associated with poor uniformity; however, as the size of the population response increased, coverage uniformity rapidly improved, reaching maximal values when 878
population responses reached 1 mm (5°) in width (Fig. 7e, black curve). Considering that the size of the cortical point spread in the tree shrew is roughly 800 µm (the difference between the width of the population response, 1 mm, and the cortical distance that corresponds to the width of the stimulus, 200 µm), most oriented stimuli that activate cortex would be represented by populations of neurons that are large enough to exhibit uniform coverage of orientation and position. In addition, coverage uniformity departed only minimally from that expected if position preference is mapped in a perfectly uniform manner (Fig. 7e and below). How would the degree of uniformity be altered if there were systematic local relationships between the two maps, as suggested in theoretical and experimental studies 17,21,26,27? We assessed coverage uniformity for cases in which we generated artificial maps of visual space with a local rate of change in position preference that was uniform (consistent with the results described here), positively correlated with rate of change in orientation preference (as described in the cat17), or inversely correlated with rate of change in orientation preference (predicted from modeling of map relationships26,27). For examples of the artificial maps of visual space used for this analysis, see Supplementary Fig. 3. On the whole, map relationships had effects that would be expected: at the smallest bin sizes, an inverse correlation provides more uniformity in coverage than a positive correlation or the uniform map condition (Fig. 7f). However, the impact of map relationships on coverage uniformity diminishes at larger bin sizes. Indeed, for the size of the population response illustrated in this study (1 mm), there were no significant differences among the three conditions (uniform, positive correlation, inverse correlation). Thus, although local relationships between feature maps and the map of visual space have effects on coverage uniformity, these effects are minimized by the large size of the population response. nature neuroscience • volume 5 no 9 • september 2002
© 2002 Nature Publishing Group http://www.nature.com/natureneuroscience
articles
Fig. 6. Quantitative analysis confirms the lack of relationship between fine structure of orientation and position maps. (a–c) Analysis for the physiological recording sites indicated in Fig. 5c and d. The changes in position preference, orientation path length (Methods) and cortical separation distance were calculated for all possible pairs of sites. Position preference was determined from the multiunit physiological recordings; orientation preference was determined from the optical imaging data. (a) Change in position preference versus cortical separation distance. (b) Orientation path length versus cortical separation distance. (c) Rate of change in position preference versus rate of change in orientation preference. (d–f) Similar analysis for 500 random pairs of sites selected from the same region of cortex from the same case. However, here optical imaging data was used to determine both position preference and orientation preference. (d) Change in position preference versus cortical separation distance. (e) Orientation path length versus cortical separation distance. (f) Rate of change in position preference versus rate of change in orientation preference.
DISCUSSION Our results provide quantitative evidence on the size and regularity of the spatial distribution of neural activity that accompanies the presentation of a spatially restricted line stimulus in layer 2/3 of V1. We find that thin lines, a fraction of the width of the average receptive field of layer 2/3 neurons, evoke broad patterns of activation in V1 that are relatively constant in size and organization. Stimuli presented to adjacent regions in visual space activate highly overlapping populations of neurons; nevertheless, small changes in stimulus position produce regular, predictable shifts in the peaks of the activated population. These results reveal a mapping of visual space in V1 that is orderly at a fine scale and whose local structure is independent of the mapping of orientation preference. Regular progression of the population response One of the most striking features of our data is the regularity in the progression of the population response for small changes in stimulus position. Studies using single or multi-unit recordings to evaluate retinotopy for comparable cortical distances have concluded that the cortical representation is more coarse than that described here; in general, scatter in the distribution of the receptive field centers obscures consistent shifts in the progression of receptive fields for electrode displacements of less than 400–500 µm (refs. 3, 14–16). Given all the potential sources of variability in single-unit recording, it is not surprising that electrophysiological measures arrive at coarser estinature neuroscience • volume 5 no 9 • september 2002
mates for the scale of map organization. Optical imaging techniques sample the level of activity in a large population of neurons distributed over several millimeters of the cortical surface, revealing an orderly progression in the average neuronal response that may be less clear when the responses of individual units or small unit clusters are evaluated. Indeed, our own electrophysiological recordings show a progression of position preference values less tight than those found in the optical recordings (Figs. 5 and 6). The retinotopic precision indicated by our imaging results suggests that, with a sufficient sample size, the scatter at any point in the map is not sufficient to obscure the orderly shift in the peak of the active population. A study32 of retinotopy in layer 4 of macaque V1 hinted at the resolution that might exist at the earliest stages of cortical processing, showing orderly shifts in receptive field position for electrode displacements of 100–200 µm. However, it had been thought that retinotopic order would be much less precise in the supragranular layers to accommodate the emergence of larger receptive field sizes and response properties such as orientation and direction selectivity that are not found in layer 4 of primates16,19. Given that similar transformations in receptive field properties occur in the projection from layer 4 to layer 2/3 in tree shrew (F. Mooser et al., Soc. Neurosci. Abstr. 26, 53.14, 2000) and that the bulk of intrinsic signal arises from supragranular layers, our data suggest that retinotopic precision need not be compromised in the process of generating more elaborate cortical response properties. Although a similar analysis remains to be done in the macaque, imaging results suggest that a comparable precision in mapping is likely to be present in layer 2/3 of this species13. The smooth and orderly mapping of visual space described here departs significantly from reports of systematic local distortions that are correlated with the map of orientation preference in cat visual cortex17,18. Evidence gathered by combining unit recordings of receptive field location with optical imaging of orientation preference suggests non-uniformity in the movement of receptive field centers, with highly overlapping fields where orientation preference changes slowly and jumps in progression near pinwheel centers in the orientation map 17,18. Receptive field size distortions comparable in magnitude to 879
© 2002 Nature Publishing Group http://www.nature.com/natureneuroscience
articles
Fig. 7. Coverage is uniform for biologically relevant population response sizes and largely invariant with alterations in map relationships. (a) An orientation preference map with a grid overlay consisting of isoazimuth and iso-elevation contours spaced at 1° intervals (black lines) indicating the layout of the map of visual space. White lines indicate regions sampled in (b–d). (b–d) The relationship between coverage uniformity and population response sizes. Orientation preference was divided into four bins (22.5 ± 22.5°, 67.5 ± 22.5°, 112.5 ± 22.5°, 157.5 ± 22.5°), and the number of pixels in each bin was plotted. In (b) and (c), small population response sizes have been simulated using 1° × 1° windows of the map of visual space to sample the available orientation values. In (d), a larger population response size has been simulated using a 4° × 4° window of the map of visual space. A value of 4° in the map of visual space corresponds to a distance of 800 µm; thus, the 4° square approximates the size of the cortical point image. (e) Black curve illustrates coverage uniformity (Methods) versus population response size for the same case illustrated in (a–d). For comparison, the green curve illustrates coverage uniformity values calculated from an artificial map of position preference that had the same average magnification factor but was completely uniform in rate of change in position preference for each axis. (f) Coverage uniformity for cases in which artificially generated maps of position preference were combined with real orientation preference maps (n = 8). Position preference maps used for analysis were uniform in structure (green curve) or had rates of change that were either positively correlated (blue curve) or inversely correlated (red curve) with the rate of change in orientation preference. For small sample windows, map relationships produced significant differences in coverage uniformity, but at the larger and more biologically relevant sample sizes, no significant differences were obtained. Scale bar, 1 mm (a).
those observed in the cat would have been evident in our imaging data had they been present (Supplementary Fig. 3). Furthermore, we found no correlation between rate of change in position preference and rate of change in orientation preference derived from our optical measures and from a more limited sample of unit recording sites. A study using tetrode recordings in cat visual cortex also failed to find a correlation between rate of change in these features; however, this study did not specifically target pinwheel centers33. Although additional work is necessary to resolve this discrepancy, it is worth noting the possibility that species differences in cortical architecture may be a factor. For example, ocular dominance columns, which are a prominent feature of cat V1, are not present in tree shrew visual cortex. Moreover, the fine structure of the maps of ocular dominance and orientation are correlated: orientation pinwheel centers tend to be located in the centers of ocular dominance columns34–38. Thus, it is conceivable that the variation in the mapping of visual space in the cat that has been described could have as much to do with the mapping of ocular dominance as orientation: that is, the local magnification factor within strongly monocular regions may be less than that of binocular regions. Whatever the relationship in other species, the results presented here indicate that distortions in the mapping of visual space are not a universal feature of V1 organization and are not required for the joint mapping of orientation and visual space. Uniformity of coverage The concept of coverage uniformity emerged from the pioneering functional architecture studies of Hubel and Wiesel4,16,19, 880
who concluded that 1–2 mm of cortex contained all the machinery necessary to analyze the full range of stimulus features for a given region of visual space. Our results provide strong support for this idea, at least with respect to orientation. Coverage uniformity is near maximal even for population response sizes equal to the point image, implying that the conjoint representation of position and orientation is accomplished without significant gaps that might impair stimulus detection. Considerations of the map of visual space and its relationship to the map of orientation preference have raised doubts about uniformity of coverage in cat visual cortex17. In that study, the cortical distance required to represent a complete set of orientation values (1 mm) corresponded, on average, to displacements of receptive field centers by 2 receptive field diameters. This observation implies that small stimuli could produce a population response that is on the order of 500 µm in width, and that fails to access neurons with a complete range of preferred orientations. These estimates of population response size are significantly smaller than the values predicted from calculations of point image size in other studies of cat visual cortex (roughly 2 mm)3,33; thus, it will be important to validate these observations with direct visualization of the population response to small stimuli. Efforts to model the conjoint representation of orientation and visual space in V1 have led to suggestions that distortions in the mapping of visual space might be necessary to achieve coverage uniformity26,27. In these models, variations in the rate of change of orientation preference are accompanied by complementary changes in the rate of change in the progression of receptive field centers in the map of visual space. The results presented here indicate that map relationships of this type are not required nature neuroscience • volume 5 no 9 • september 2002
© 2002 Nature Publishing Group http://www.nature.com/natureneuroscience
articles
to achieve coverage uniformity. Moreover, our analysis of artificial maps that showed the properties predicted by these models (negative correlations in the rate of change in visual space and orientation preference) suggests that map relationships of this type are likely to have only a minor impact on coverage uniformity for biologically relevant population response sizes. Regularity in the mapping of each feature, and the relative scaling of the two maps, seem to be far more critical for coverage uniformity than local map relationships. Although we find no evidence for local relationships between orientation and visual space maps, other studies have demonstrated systematic relationships between orientation preference and other types of functional maps in cat and macaque visual cortex, including ocular dominance, spatial frequency and direction preference24,29,34–40. It seems likely that broad tuning, relative scaling and regularity of mapping are sufficient to insure uniform coverage for each feature alone. However, local relationships between maps may be required for uniformity in the representation of multiple feature combinations; indeed, local relationships between the maps of orientation, ocular dominance and spatial frequency are optimized for uniformity of coverage in the cat visual cortex21. A distributed spatial code for position and orientation Systematic changes in the spatial distribution of activity in large neuronal populations have long been argued to serve as the basis for accurate coding of sensory and motor information in cortical and subcortical centers8,9,41–43. Although these arguments have been based on inferences from the recordings of single units, the observations of population behavior presented here confirm that spatial coding can provide a powerful mechanism to reliably predict the properties of simple visual stimuli in V1. The pattern of activity in a large population of neurons that are broadly tuned for position and orientation allows for small changes in the position of the stimulus, a fraction of the width of a single neuron’s receptive field, to be reliably detected and differentiated from other changes in stimulus features that are conflated in the responses of individual members of the population.
METHODS Animal preparation. Fourteen tree shrews of both sexes (age approximately 2 to 6 months) were used for these experiments. Procedures for animal surgery and preparation for both optical imaging and electrophysiology have been described elsewhere44,45 and were approved by the Duke University Animal Care and Use Committee. All optical imaging data and electrophysiological recordings were obtained with only the contralateral eye open. Although no attempt was made to precisely define the location of the horizontal or vertical meridian, all recordings were obtained from a region of V1 known to contain the representation of central visual space44–46. This region included azimuths from near the vertical meridian to near 20° contralateral, and elevations from approximately –10° to +10°. Optical imaging. Optical imaging of intrinsic signals was accomplished using a video acquisition system (Optical Imaging, Mountainside, New Jersey). Red light (700 ± 10 nm) was used to illuminate the cortical surface. Our procedures for obtaining orientation preference maps using optical imaging have been described elsewhere44,45. The stimulus used for position preference experiments was an elongated bar (0.25° × 60°) panned within a 1° wide window for 9 s. Video images were acquired during the last 8 s of this period. Data acquired during presentation of a blank screen were subtracted from data acquired during presentation of the vertical bar stimulus to obtain an image reflecting the cortical activity in response to the vertical bar (the population response). Each experiment consisted of 8–20 trials with the stimulus located in a particular nature neuroscience • volume 5 no 9 • september 2002
position. In two animals, we evaluated cortical response to the simultaneous presentation of two bars. These bars were panned in phase and were separated by 1° to 10°, with one bar held in a constant position while the position of the other was varied. In one of these animals, the presentation of two bar stimuli was interleaved with presentation of single bars in the same position (Fig. 4). Population response analysis. Population responses were filtered to remove blood vessel artifacts and high-frequency noise (for details of our image analysis, see Supplementary Methods). Population response width and progression were analyzed by selecting a 1 mm wide strip of cortex to evaluate from each case. From this strip of cortex, we generated a plot depicting mean grayscale value versus distance (response profiles; Fig. 2b). Gaussian curves were fit to each response profile; the center of the population response was determined by the peak of the fitted Gaussian, and the width of the population response was the full-width at halfheight. Linear regressions were used to assess the regularity of the population response progression with movement of the stimulus. These values and all data are reported as mean ± s.d. Similar procedures were used to evaluate the population responses to two bar stimuli, except in this case the grayscale plot from the image was fit by a sum of two Gaussians. Locations of the two peaks of activity in the two bar condition were compared directly to the location of the peaks obtained to each single bar presented in isolation. Position preference maps were obtained by combining data from the 8–16 stimulus positions tested for each animal using described procedures45. Briefly, a position tuning curve was generated for each pixel in the imaged area by extracting the grayscale value obtained for each stimulus position tested. Gaussian curves were then fit to the position tuning curves to determine the position preference (peak of the Gaussian curve) and tuning width for each pixel, and the position preference for each pixel was then color coded. Orientation path length. Because orientation preference is mapped in a cyclic fashion across the cortical surface, and because the gradient of orientation preference can change or reverse in some locations, the simple difference in orientation preference between two points is insufficient as a measure of the mapping of orientation preference between those two points. Therefore, we defined orientation path length as the total amount of change in orientation preference along the line connecting two points, and calculated this variable by summing the absolute value of changes in orientation preference found between intermediate points along the line. The rate of change of position and orientation preference were obtained by dividing the difference in position and the orientation path length, respectively, by the cortical distance between two sites. Computation of coverage. Coverage was examined in one case for which we had position data for both the vertical and horizontal axes of the map of visual space as well as an orientation preference map. Coverage calculations also were performed using artificial maps (Supplementary Methods) that were generated to have position preference change in a uniform fashion, or in a manner that was positively or inversely correlated to the rate of change in the orientation preference map. For these calculations, orientation preference was divided into four quadrants (0–45°, 45–90°, 90–135°, 135–180°). To determine coverage at the 0.5° level, we divided the imaged area into 0.5° × 0.5° position bins and counted the number of occurrences of each orientation quadrant in each bin. To obtain coverage for the larger bin sizes, we combined data from adjacent 0.5° bins. To simulate different size response populations, we varied the size of the window in which pixels were counted, from a 1° square to a 7° square. This was done for all windows of that size within the overall analysis area. For each position bin size, coverage uniformity was defined as standard deviation in the number of pixels per bin divided by the mean number of pixels per bin21. Electrophysiology. A small hole was opened in the skull over V1 and tungsten electrodes (50 mm length, 14 ΜΩ; FHC, Bowdoinham, Maine) were inserted through the dura mater and used to record single and 881
© 2002 Nature Publishing Group http://www.nature.com/natureneuroscience
articles
multi-unit responses. The position of recording locations relative to the surface vasculature was noted for alignment with imaging data. The bar stimulus used for optical imaging was presented in 16 different screen positions in pseudo-random order. Each stimulus location was displayed for 2 s with a 500 ms interstimulus interval. Position preference and tuning width for each site were determined by fitting a Gaussian curve to the position tuning data with the same algorithm used to compute position preference for the optical imaging data. In some cases, position preference was also determined by presentation of short bars (1°) that were orthogonal to the orientation of the long bars. For example, to determine the azimuth preference for a given site, short horizontal bars were panned up and down within the same 1° window that was used with the long vertical bars. Electrophysiological determination of the preferred position of a site is subject to several sources of error that are not present for optical imaging, including small errors in placement of the electrode and the ability to detect spiking neurons that are some distance away from the electrode (Supplementary Methods). Note: Supplementary information is available on the Nature Neuroscience website.
Acknowledgments We thank A. Basole, H. Chisum, M. Pucak, T. Tucker and L. White for discussions and D. Katz for advice with data analysis. This research was supported by a grant from the National Institutes of Health (EY06821) and by The McKnight Foundation (to D.F.).
Competing interests statement The authors declare that they have no competing financial interests.
RECEIVED 29 MARCH; ACCEPTED 30 JULY 2002 1. Tootell, R. B., Switkes, E., Silverman, M. S. & Hamilton, S. L. Functional anatomy of macaque striate cortex. II. Retinotopic organization. J. Neurosci. 8, 1531–1568 (1988). 2. Grinvald, A., Lieke, E. E., Frostig, R. D. & Hildesheim, R. Cortical pointspread function and long-range lateral interactions revealed by real-time optical imaging of macaque monkey primary visual cortex. J. Neurosci. 14, 2545–2568 (1994). 3. Albus, K. A quantitative study of the projection area of the central and the paracentral visual field in area 17 of the cat. I. The precision of the topography. Exp. Brain Res. 24, 159–179 (1975). 4. Hubel, D. H. & Wiesel, T. N. Ferrier lecture. Functional architecture of macaque monkey visual cortex. Proc. R. Soc. Lond. B. Biol. Sci. 198, 1–59 (1977). 5. Jancke, D. et al. Parametric population representation of retinal location: neuronal interaction dynamics in cat primary visual cortex. J. Neurosci. 19, 9016–9028 (1999). 6. Hinton, G. E., McClelland, J. L. & Rumelhart, D. E. in Parallel Distributed Processing Vol. 1 (eds. Rumelhart, D. E. & McClelland, J. L.) 77–109 (MIT Press, Cambridge, Massachusetts, 1986). 7. Baldi, P. & Heiligenberg, W. How sensory maps could enhance resolution through ordered arrangements of broadly tuned receivers. Biol. Cybern. 59, 313–318 (1988). 8. McIlwain, J. T. Distributed spatial coding in the superior colliculus: a review. Vis. Neurosci. 6, 3–13 (1991). 9. McIlwain, J. T. Population coding: a historical sketch. Prog. Brain Res. 130, 3–7 (2001). 10. Talbot, S. A. & Marshall, W. H. Physiological studies on neural mechanisms of visual localization and discrimination. Am. J. Ophthalmol. 24, 1255–1264 (1941). 11. Daniel, P. M. & Whitteridge, D. The representation of the visual field on the cerebral cortex in monkeys. J. Physiol. (Lond.) 159, 203–221 (1961). 12. Van Essen, D. C., Newsome, W. T. & Maunsell, J. H. The visual field representation in striate cortex of the macaque monkey: asymmetries, anisotropies, and individual variability. Vision Res. 24, 429–448 (1984). 13. Blasdel, G. & Campbell, D. Functional retinotopy of monkey visual cortex. J. Neurosci. 21, 8286–8301 (2001). 14. Hubel, D. H. & Wiesel, T. N. Receptive fields, binocular interaction and functional architecture in the cat’s visual system. J. Physiol. (Lond.) 160, 106–154 (1962).
882
15. Creutzfeldt, O. D., Kuhnt, U. & Benevento, L. A. An intracellular analysis of visual cortical neurones to moving stimuli: response in a co-operative neuronal network. Exp. Brain Res. 21, 251–274 (1974). 16. Hubel, D. H. & Wiesel, T. N. Uniformity of monkey striate cortex: a parallel relationship between field size, scatter, and magnification factor. J. Comp. Neurol. 158, 295–305 (1974). 17. Das, A. & Gilbert, C. D. Distortions of visuotopic map match orientation singularities in primary visual cortex. Nature 387, 594–598 (1997). 18. Das, A. & Gilbert, C. D. Topography of contextual modulations mediated by short-range interactions in primary visual cortex. Nature 399, 655–661 (1999). 19. Hubel, D. H. & Wiesel, T. N. Sequence regularity and geometry of orientation columns in the monkey striate cortex. J. Comp. Neurol. 158, 267–293 (1974). 20. Swindale, N. V. Coverage and the design of striate cortex. Biol. Cybern. 65, 415–424 (1991). 21. Swindale, N. V., Shoham, D., Grinvald, A., Bonhoeffer, T. & Hubener, M. Visual cortex maps are optimized for uniform coverage. Nat. Neurosci. 3, 822–826 (2000). 22. Blasdel, G. G. & Salama, G. Voltage-sensitive dyes reveal a modular organization in monkey striate cortex. Nature 321, 579–585 (1986). 23. Bonhoeffer, T. & Grinvald, A. Iso-orientation domains in cat visual cortex are arranged in pinwheel-like patterns. Nature 353, 429–431 (1991). 24. Blasdel, G. G. Orientation selectivity, preference, and continuity in monkey striate cortex. J. Neurosci. 12, 3139–3161 (1992). 25. Bonhoeffer, T. & Grinvald, A. The layout of iso-orientation domains in area 18 of cat visual cortex: optical imaging reveals a pinwheel-like organization. J. Neurosci. 13, 4157–4180 (1993). 26. Durbin, R. & Mitchison, G. A dimension reduction framework for understanding cortical maps. Nature 343, 644–647 (1990). 27. Obermayer, K., Ritter, H. & Schulten, K. A principle for the formation of the spatial structure of cortical feature maps. Proc. Natl. Acad. Sci. USA 87, 8345–8349 (1990). 28. Grinvald, A., Frostig, R. D., Lieke, E. & Hildesheim, R. Optical imaging of neuronal activity. Physiol. Rev. 68, 1285–1366 (1988). 29. Blasdel, G. G. Differential imaging of ocular dominance and orientation selectivity in monkey striate cortex. J. Neurosci. 12, 3115–3138 (1992). 30. Bonhoeffer, T. & Grinvald, A. in Brain Mapping: the Methods (eds. Toga, A. W. & Mazziotta, J. C.) 55–97 (Academic, New York, 1996). 31. Grinvald, A. et al. in Modern Techniques in Neuroscience Research (eds. Windhorst, U. & Johansson, H.) 893–969 (Springer, Berlin, 1999). 32. Blasdel, G. G. & Fitzpatrick, D. Physiological organization of layer 4 in macaque striate cortex. J. Neurosci. 4, 880–895 (1984). 33. Hetherington, P. A. & Swindale, N. V. Receptive field and orientation scatter studied by tetrode recordings in cat area 17. Vis. Neurosci. 16, 637–652 (1999). 34. Obermayer, K. & Blasdel, G. G. Geometry of orientation and ocular dominance columns in monkey striate cortex. J. Neurosci. 13, 4114–4129 (1993). 35. Hubener, M., Shoham, D., Grinvald, A. & Bonhoeffer, T. Spatial relationships among three columnar systems in cat area 17. J. Neurosci. 17, 9270–9284 (1997). 36. Crair, M. C., Ruthazer, E. S., Gillespie, D. C. & Stryker, M. P. Ocular dominance peaks at pinwheel center singularities of the orientation map in cat visual cortex. J. Neurophysiol. 77, 3381–3385 (1997). 37. Crair, M. C., Ruthazer, E. S., Gillespie, D. C. & Stryker, M. P. Relationship between the ocular dominance and orientation maps in visual cortex of monocularly deprived cats. Neuron 19, 307–318 (1997). 38. Kim, D. S., Matsuda, Y., Ohki, K., Ajima, A. & Tanaka, S. Geometrical and topological relationships between multiple functional maps in cat primary visual cortex. NeuroReport 10, 2515–2522 (1999). 39. Shmuel, A. & Grinvald, A. Functional organization for direction of motion and its relationship to orientation maps in cat area 18. J. Neurosci. 16, 6945–6964 (1996). 40. Weliky, M., Bosking, W. H. & Fitzpatrick, D. A systematic map of direction preference in primary visual cortex. Nature 379, 725–728 (1996). 41. Sparks, D. L., Holland, R. & Guthrie, B. L. Size and distribution of movement fields in the monkey superior colliculus. Brain Res. 113, 21–34 (1976). 42. Groh, J. M., Born, R. T. & Newsome, W. T. How is a sensory map read out? Effects of microstimulation in visual area MT on saccades and smooth pursuit eye movements. J. Neurosci. 17, 4312–4330 (1997). 43. Treue, S., Hol, K. & Rauber, H. J. Seeing multiple directions of motion— physiology and psychophysics. Nat. Neurosci. 3, 270–276 (2000). 44. Bosking, W. H., Zhang, Y., Schofield, B. & Fitzpatrick, D. Orientation selectivity and the arrangement of horizontal connections in tree shrew striate cortex. J. Neurosci. 17, 2112–2127 (1997). 45. Bosking, W. H., Kretz, R., Pucak, M. L. & Fitzpatrick, D. Functional specificity of callosal connections in tree shrew striate cortex. J. Neurosci. 20, 2346–2359 (2000). 46. Kaas, J. H., Hall, W. C., Killackey, H. & Diamond, I. T. Visual cortex of the tree shrew (Tupaia glis): architectonic subdivisions and representations of the visual field. Brain Res. 42, 491–496 (1972).
nature neuroscience • volume 5 no 9 • september 2002