mixture signal with a mask extracted from the modulation spectrogram ... Systematic evaluation shows an acceptable ... find methods which are proposed to estimate the short-time ..... The separation performance of the modulation masks was.
Single Channel Speech Separation with a Frame-based Pitch Range Estimation Method in Modulation Frequency A. Mahmoodzadeh
H. R. Abutalebi
H. Soltanian-Zadeh
H. Sheikhzadeh
Speech Proc. Research Lab ECE Dept. Yazd University Yazd, Iran
Speech Proc. Research Lab ECE Dept. Yazd University Yazd, Iran & Idiap Research Institute1 Martigny, Switzerland
Control and Intelligent Processing Center of Excellence, University of Tehran Tehran, Iran & Image Analysis Lab. Henry Ford Health System Detroit, USA
EE Dept. Amirkabir University of Technology Tehran, Iran
Abstract— Computational Auditory Scene Analysis (CASA) has attracted a lot of interest in segregating speech from monaural mixtures. In this paper, we propose a new method for single channel speech separation with frame-based pitch range estimation in modulation frequency domain. This range is estimated in each frame of modulation spectrum of speech by analyzing onsets and offsets. In the proposed method, target speaker is separated from interfering speaker by filtering the mixture signal with a mask extracted from the modulation spectrogram of mixture signal. Systematic evaluation shows an acceptable level of separation comparing with classic methods. Keywords-modulation frequency; speech separation; pitch frequency; acuostic frequency
I.
INTRODUCTION
In a natural environment, speech is simultaneously degraded with acoustic interference. Many applications such as automatic speech recognition, telecommunication and audio information retrieval require an effective system that segregates speech from interference in the monaural (one-microphone) situation. While the monaural speech segregation has proven to be very challenging, human have a remarkable ability to segregate an acoustic mixture and focus to a target sound, even with one ear. This perceptual process is known as Auditory Scene Analysis (ASA). Research in ASA has urged the scientists to spend more effort in constructing Computational ASA (CASA) based on ASA principles. Current CASA systems, however, face a number of challenges in monaural speech segregation. Various algorithms have been proposed for monaural speech enhancement [1], [2], and they are generally based on some analysis of speech or interference and subsequent speech amplification or noise reduction. For example, it is possible to find methods which are proposed to estimate the short-time spectra of interference and then attenuate interference
1 H. R. Abutalebi has been on sabbatical at Idiap Research Institute during Fall 2010-Summer 2011.
accordingly [3], [4], or to extract speech based on speech modeling [5], [6]. Another method in dealing with speech separation is to perform eigen-decomposition on an acoustic mixture and then apply subspace analysis to remove interference [7]. Hidden Markov models have been used to model both speech and interference and then separate them [8], [9]. These methods usually assume certain properties of interference and lack the capacity for dealing with general acoustic interference, because a variety of interference makes it very difficult to model and predict [3]. Many studies have been devoted to developing a CASA system for monaural speech segregation [10][13]. These systems aim to segregate target sound without making many assumptions about interference and tend to have a wider scope of applicability than speech enhancement methods. Hu and Wang decompose an acoustic mixture into time-frequency (TF) units to retain the signals within the T-F units where target speech is more intense than interference and remove others [14]. In [15], [16], the authors use binary masks for speech separation. All these techniques, however, require very accurate pitch estimates, which is a difficult task in itself for single speakers, and even more so in the presence of interfering speakers. In this paper, we propose an incoherent modulation analysis approach to the problems of target talker enhancement and single channel speech separation with using the modulation analysis and filtering in the modulation frequency domain. Psychoacoustic experts believe that the human auditory system analyzes and possibly even segregates sounds in this domain [17]. The modulation frequency domain has been used for speaker recognition [18] and automatic speech recognition [19]. It has also been used by Kollmeier and Koch to address the cocktail party problem in two channels. They used phase and intensity differences between modulation frequency representations of stereo channels to separate speakers.
Another argument in favor of a modulation frequency domain approach is that it only requires a rough estimate of a desired speaker’s pitch range and that it takes only a simple algorithm to achieve an acceptable level of speaker separation (as we will demonstrate in this paper). The simulation results indicate that the proposed system extracts a majority of target speech without including much interference. This paper is organized as follows. In Sections II and III, we propose a working definition for modulation frequency analysis and onset and offset algorithm. In Section IV, we first give a brief description of our system and then present the details of each stage. The results of the system on the determination of range of pitch frequency are reported in Section V. The paper concludes with a discussion in Section VI. II. SYSTEM DESCRIPTION The main idea of our system is to produce a mask for single channel speech separation. Thereupon, at first the modulation spectrum of the speech signal is calculated using the cochlear filtering [11]. Then, the range of pitch frequency of each speaker is determined and finally, this range used for speech segregation. The overall model is a multistage system, as shown in Fig. 1. For speech segregation, a proper mask is necessary. Therefore, the range of pitch frequency of each speaker should be determined. There are several methods for multipitch tracking. In this paper, we use a new method for calculating range of pitch frequency in modulation domain proposed in [20]. A detailed description of the whole speech separation system is as follows. A. Cochlear filtering and modulation transform To implement the modulation spectrum segmentation, at first, cochlear filtering is used to decompose the input in the frequency domain. A gammatone filter-bank is commonly used for modeling the cochlear filtering. The filter-bank has 128 gammatone filters centered from 50 Hz to 8 KHz, and decomposes the filter responses into consecutive 20-ms windows with 10-ms window shifts [14]. The output of the cochlear filtering is the input of the modulation transform stage. Cochlear filtering
The Discrete Short-Time Modulation Transform (DSTMT) of a signal x ( n ) is defined as:
{ {
}}
X ( l , k ,i ) = DSTFT D DSTFT {x ( n )}
⎧ = ∑ D ⎨∑ x ( n ) h ( mM − n ) e − j 2π nk / K m ⎩n
⎫ − j 2π mi / I ⎬ g ( lL − m )e ⎭
(1)
For i = 0,… , I − 1 and k = 0,… , K − 1 , where h ( n ) and
g ( m ) are the acoustic and modulation frequency analysis windows, M and L are decimated factors and D is the operator of envelop detector, respectively. A short analysis window creates a modulation spectrum that has a high resolution in acoustic frequency, but limited extent in modulation frequency. A wide analysis window creates a modulation spectrum that has low resolution in acoustic frequency, but a large extent in modulation frequency. The modulation transform consists of a filter-bank, followed by sub-band envelope detection and frequency analysis of the subband envelopes [21]. The filter-bank uses the Short-Time Fourier Transform (STFT) and the envelope detection is defined as the magnitude or magnitude squared of the subband. Throughout the paper, we use the shorthand notations: X l (k , i ) ≡ X (l , k ,i )
(2)
to denote the discrete short-time modulation transform at a particular time instance l . The magnitude of the sub-band envelope spectra X l ( k , i )
represents the modulation spectrogram in a diagram in which the vertical axis displays regular acoustic frequency ( K ) , and the horizontal axis is modulation frequency ( i ) . B. Range of multipitch frequency The fundamental frequency of target and interfering speakers are similarly time varying.
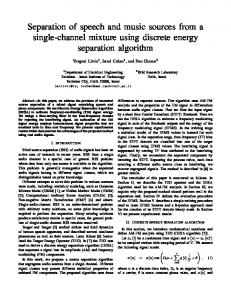
Modulation Transform
Speech separation
Segregated speech
Mixture
Range of multipitch frequency Smoothing Onset/offset Decision detection & making matching
Figure 1. A block diagram of the proposed system.
The fundamental frequency of the interfering talkers occasionally enters the target’s fundamental frequency range, causing false segregation. To prevent such false segregation, we use a more sophisticated speaker identification algorithm, in combination with an algorithm that tracks the target’s fundamental frequency range over time. In the first stage, the modulation frequency is smoothed using a low-pass filter. After smoothing, the intensity fluctuations are reduced. Although the local details of onsets and offsets become blurred but major intensity changes of the onsets and offsets are preserved. Then at a certain scale, peaks and valleys of the modulation frequency derivative of the smoothed intensity are marked and therefore onset and offset candidates are detected. By detecting the onsets and offsets and forming the onset and offset front, the modulation spectrum of speech signal is segmented. The speaker’s pitch ranges have to be [60,350] Hz (for men, women, and children). Therefore, only segments in the range of [60,350] Hz are selected. Then, the energy of selected segments is calculated. Segments whose ranges of pitch frequency are subsets of ranges of pitch frequency of other segments and their energy are above a pre-determined threshold, their energy are added. Finally, the segment with the largest energy is chosen. According to the onset and offset fronts of the desired segment, we find the beginning and ending of the range of pitch frequency.
C. Speech separation Assume a given signal sampled at f s Hz is the sum of a target speaker and an interfering speaker, i.e., x ( n ) = x t ( n ) + x i ( n ) . The target speaker’s pitch frequency
range obtained from previous stage is within the frequency range PFt = [ pf t ,low , pf t ,high ] and that the interfering speaker’s pitch frequency range is within the . Define range PFi = [ pf i ,low , pf i ,high ] Q = {i : i (f s / IM ) ∈ PF } as the set of modulation frequency indices in the pitch frequency range PF For producing a frequency masking, at first, the mean of modulation spectral energy as a function of acoustic frequency index over the target’s pitch frequency range is calculated as follows:
E lt (k ) = ( ∑ X l (i , k ) ) / ( pf t ,high − pf t ,low ) 2
(3)
i ∈Qt
as well as over the interfering speaker’s pitch frequency range
E li (k ) = ( ∑ X l (i , k ) ) / ( pf i ,high − pf i ,low ) 2
(4)
i ∈Q i
The mean of modulation spectral energy of target speaker is compared to that of the interfering speakers. When for each frame l , the modulation spectral energy is greater than the
other, or both of them are almost equal and small, the frequency masking is calculated as follow:
Fl (k , i ) =
E lt (k ) E lt (k ) + E li (k )
(5)
When both of the modulation spectral energies are about the same and high, the speakers have common acoustic frequency. In order to reduce the effect of interference signal while keeping the target speech signal, we set Fl (k , i ) = 0.5 . Since there are many artifacts associated with applying masks in the modulation frequency domain [22][23], we do not use modulation filtering and modulation synthesis to mask out the interfering speaker and reconstruct a time-domain signal. Instead, in each frame, the frequency masking function is transformed to an impulse response by combining it with the linear phase response φ ( k , i ) and taking the inverse DFT,
f l (k , m ) =
1 N
N −1
∑ F (k , i )e l
j φ ( k ,i )
e j 2π mi / I
(6)
i =0
The obtained filter is then used to separate the target speaker from the interfering speaker by convolution as follows:
x (k , m ) = x (k , m ) ∗ f (k , m )
(7)
Finally, the time-varying target speaker signal is obtained by taking the inverse DFT. III.
RESULTS
To evaluate the accuracy of the proposed algorithm in single channel speech separation, the mixed speech signals are taken from Te-Won Lee’s database [24] which are recordings of a target male speaker saying “one two three four five …” and an interference male speaker saying “uno, dos, tres …”. The modulation spectrum X ( k , i ) was calculated from an input signal digitized at a 16 kHz sampling rate. Decimated factors of the proposed algorithm were set at M = 16 and L = 38 , and other parameters of the proposed algorithm were set at K = 512 and I = 512 , and h ( n ) and g ( m ) were a 48point and 78-point Hanning windows. Fig. 2a shows 0.8 s of the target speech (“dos”). Fig. 3b and Fig. 3a show the spectrogram of target and interference speech signals and Fig. 3c and Fig. 4a show the spectrogram and modulation spectrum of the mixed speech signal. Fig.3d and Fig. 4b show the spectrogram and modulation spectrum of separated speech after applying the proposed algorithm to the 0 dB mix of the two speakers signal. The range of pitch frequency of the target and interference speakers, according to the obtained segments, is [100, 137.599] and [88.5, 100], respectively.
The separation performance of the modulation masks was measured with the signal-to-distortion ratio (SDR) commonly used to evaluate blind source separation algorithms. The SDR is defined in [25] as:
(n ) 2 ∑ n ⎡⎣x ( n ) − x ( n )⎤⎦ n
x
SDR of mixture signal SDR of separated signal
0dB
2 dB
5 dB
7 dB
10 dB
12 dB
3.32 dB
5.43 dB
6.87 dB
9.68 dB
12.10 dB
15.31 dB
16.6 dB
(9)
where the difference between the original signal x ( n ) and the
separated signal x ( n ) in the denominator represents the separation distortion. The SDR of the target speech signal in the above example is SDR=5.43dB. Table 1 shows the obtained results for different SNR.
TABLE II.
Spectral subtraction
Wang-Brown model
Hu-Wang model
Proposed model
12dB
12.5 dB
13 dB
16.8 dB
16.6 dB
(a) 1
Amplitude
0
0
1000
2000
3000
4000 Time(s) (b)
5000
6000
7000
8000
0
1000
2000
3000
4000 Time(s)
5000
6000
7000
8000
Amplitude
1
0.5
0
-0.5
Figure 2. Speech signal in time domain. (a) Target speech signal. (b) Target speech signal extracted from mixture signal after applying the proposed speech separation algorithm. (a)
CONCLUSION AND DISCUSSION
Acoustic frequency (Hz)
In this paper, we presented a new approach for single channel speech separation based on modulation frequency analysis and a time-varying filter with an extended pitch range estimation model. The model estimates the range of pitch frequency in each frame of modulation spectrum of speech by analyzing onsets and offsets. The frame-based pitch range estimation follows the target speaker’s pitch in modulation frequency and enables the algorithm to separate a target speaker from interfering speakers with similar pitch ranges. We demonstrated that the true range of pitch frequency is an important feature for speech segregation and also modulation frequency localization of pitch energy is an important feature for determination of range of pitch frequency of speech in modulation spectrogram. The proposed method is simple and capable of estimating range of multiple pitch periods. This increases the robustness of the algorithm by allowing it to deal with other voiced interferences.
0.5
-0.5
Acoustic frequency (Hz)
Hu-Wang method [14] requires the determination of pitch frequency in each moment for speech separation. However, the conventional methods for pitch frequency estimation of overlapped (interfered) speech signals are complex and not very accurate. Nevertheless in the proposed system we do not need to estimate the pitch frequency in every moment, and the determination of pitch range is sufficient for speech separation.
SDR RESULTS FOR SEGREGATED SPEECH AND ORIGINAL MIXTURES.
Original mixture
Also our system was evaluated with Cooke’s test corpus [26]. We compared our system with three famous speech enhancement techniques, including spectral subtraction [27], Wang-Brown model [28] and Hu-Wang model [14]. Table 2 shows the SDR of the original mixture and segregated speech, averaged across 10 utterances. The results show that proposed system yields much better performance than the spectral subtraction and Wang-Brown system. According to these results, one may deduce that for low SNR’s, the proposed system’s accuracy is relatively high. Therefore, the results show the robustness of our method for speech segregation.
IV.
-5dB
(b)
8000
Acoustic frequency (Hz)
∑
RESULTS OF PROPOSED METHOD FOR DIFFERENT SDRS
6000 4000 2000 0
0
0.1
0.2 0.3 Time (s) (c)
0.4
8000
Acoustic frequency (Hz)
SDR = 10 log10
2
TABLE I.
6000 4000 2000 0
0
0.1
0.2 0.3 Time(s)
0.4
8000 6000 4000 2000 0
0
0.1
0.2 0.3 Time(s) (d)
0.4
0
0.1
0.2 0.3 Time(s)
0.4
8000 6000 4000 2000 0
Figure 3. Time-frequency energy plot: (a) for an interference speech signal; (b) for a target speech signal; (c) for a mixture signal; and (d) for a separated speech signal.
REFERENCES [1] [2]
J. Benesty, S. Makino, and J. Chen, Ed., Speech enhancement, New York: Springer, 2005. Y. Ephraim, H. Lev-Ari, and W. J. J. Roberts, “A brief survey of speech enhancement, ” in The Electronic Handbook, CRC Press, 2005.
Acoustic frequency (Hz)
Acoustic frequency (Hz)
(a) 8000 6000 4000 2000 0
0
50
100 150 Modulation frequency (Hz) (b)
200
250
0
50
100 150 Modulation frequency (Hz)
200
250
8000 6000 4000 2000 0
Figure 4. Modulation spectrogram: (a) for a mixture signal and (b) for a separated speech signal.
[3]
[4]
[5]
[6]
[7]
[8] [9]
[10]
[11]
[12]
[13]
[14]
[15]
N. Virag, “Single channel speech enhancement based on masking properties of the human auditory system,” IEEE Trans. Speech and Audio Process., vol. 7, pp. 126-37, 1999. R. Martin, “Noise power spectral density estimation based on optimal smoothing and minimum statistics, ” IEEE Trans. Speech and Audio Process., vol. 9, pp. 504-512, 2001. J. H. L. Hansen and M. A. Clements, “Constrained iterative speech enhancement with application to speech recognition, ” IEEE Trans. Signal Process., vol. 39, pp. 795-805, 1991. J. Jensen and J. H. L. Hansen, “Speech enhancement using a constrained iterative sinusoidal model, ” IEEE Trans. Speech and Audio Process., vol. 9, pp. 731-740, 2001. A. Rezayee and S. Gazor, “An adaptive KLT approach for speech enhancment, ” IEEE Trans. Speech and Audio Process., vol. 9, pp. 8795, 2001. A. P. Varga and R. K. Moore, “Hidden Markov model decomposition of speech and noise, ” Proceedings of ICASSP, pp. 845-848, 1990. H. Sameti, H. Sheikhzadeh, L. Deng, and R. L. Brennan, “HMM-based strategies for enhancement of speech signals embedded in nonstationary noise, ” IEEE Trans. Speech and Audio Process., vol. 6, pp. 445-455, 1998. Y. Shao, Z. Jin, D. Wang, and S. Srinivasan, “An auditory-based feature robust speech recognition,” Proceedings of ICASSP, pp. 4625-4628, Taiwan, April. 2009. D. L. Wang, “Time-frequency masking for speech separation and its potential for hearing aid design,” Trends in Amplification, vol. 12, no. 4, pp. 332-353, December 2008. D. L. Wang, U. Kjems, M. S. Pedersen, and J. B. Boldt, “Speech intelligibility in background noise with ideal binary time-frequency masking,” Journal of the Acoustical Society of America, vol. 125, no. 4, pp. 2336–2347, April 2009. Y. Shao, S. Srinivasan, Z. Jin, and D. L. Wang, “A computational auditory scene analysis system for speech segregation and robust speech recognition,” Computer Speech and Language, vol. 24, pp. 77-93, 2010. G. Hu, and D. Wang, “Monaural speech segregation based on pitch tracking and amplitude modulation,” IEEE Transactions on Neural Networks, vol. 15, no. 5, pp. 1135-1150, 2004. P. S. Chang, Exploration of behavioral, physiological, and computational approaches to auditory scene analysis, M.S. Thesis, The Ohio State University Dept. Comput. Sci. & Eng., 2004 (available at http://www.cse.ohio-state.edu/pnl/theses).
[16] D. S. Brungart, P. S. Chang, B. D. Simpson, and D. L. Wang, “Isolating the energetic component of speech-on-speech masking with an ideal binary mask, ” Submitted for journal publication, 2005. [17] T. Dau, D. Püschel, and A. Kohlrausch, “A quantitative model of the “effective” signal processing in the auditory system: I. Model structure,” Journal of the Acoustical Society of America, vol. 99, pp. 3615–3622, 1997. [18] T. Kinnnunen, “Joint acoustic-modulation frequency for speaker recognition,” Proceedings of ICASSP, pp. 665-668, 2006. [19] H. Hermansky, “The modulation spectrum in the automatic recognition of speech,” Proceedings of IEEE Workshop on Automatic Speech Recognition and Understanding, pp. 140-147, 1997. [20] A. mahmoodzadeh, H. Abutalebi, H. Soltanian-Zadeh and H. Sheikhzadeh, “Determination of single- and multi-pitch range through modulation spectrum based on onset and offset analysis in noisy environment, “ submitted to Journal of the Acoustical Society of America, “unpublished”. [21] Z. Jin, and D. Wang, “A multipich traking algorithm for noisy and reverberant speech,” Proceedings of ICASSP, pp. 4218–4221, 2010. [22] S. M. Schimmel and L. E. Atlas, “Coherent envelope detection for modulation filtering of speech,” Proceedings of ICASSP, pp. 221–224, 2005. [23] S. M. Schimmel, K. R. Fitz, and L. E. Atlas, “Frequency Reassignment for Coherent Modulation Filtering,” Proceedings of ICASSP, pp. 261– 264, 2006. [24] T.-W. Lee, “Blind Source Separation: Audio Examples,” http://www.snl.salk.edu/~tewon/Blind/blind_audio.html, 1998. [25] E. Vincent, R. Gribonval, and C. Fevotte, “Performance measurement in blind audio source separation," IEEE Transactions on Audio, Speech, and Language Processing, vol. 14, no. 4, pp. 1462-1469, Jul. 2006. [26] M. P. Cooke, Modelling auditory processing and organisation, Cambridge, UK: Cambridge University Press, 1993 [27] X. Huang, A. Acero, and H.-W. Hon, Spoken language processing: A guide to theory, algorithms, and system development, Upper Saddle River, NJ: Prentice Hall, 2001 [28] D.L. Wang and G.J. Brown, "Separation of speech from interfering sounds based on oscillatory correlation," IEEE Trans. Neural Net., Vol. 10, pp. 684-697, 1999.