SINGLE-TRIAL CLASSIFICATION OF ERPS USING SECOND-ORDER BLIND IDENTIFICATION (SOBI) YAN WANG1, MATTHEW T. SUTHERLAND2, LORI L. SANFRATELLO2, AKAYSHA C. TANG234 1
2
Department of Electrical and Computer Engineering, University of New Mexico, Albuquerque, NM 87131, USA Department of Psychology, 3Department of Neurosciences, 4Department of Computer Science, University of New Mexico, Albuquerque, NM 87131, USA E-MAIL:
[email protected]
Abstract: Single-trial classification of EEG signals has received increasing attention in both basic research and for the development of EEG based Brain Computer Interfaces (BCI). Typically, such classification has been performed using signals from a set of selected EEG sensors. Because EEG sensor signals are mixtures of signals from multiple intra- and extra-cranial sources, single-trial sensory and motor evoked potentials can be difficult to detect and classify. In this paper, Second-order blind identification (SOBI) was used to preprocess EEG data and extract activity from the left and right primary somatosensory (SI) cortices. Subsequently, classification of event-related potentials (ERPs) evoked by a sequence of randomly mixed left, right, and bilateral median nerve stimulations was performed by back-propagation neural networks, using as inputs the two SOBI-recovered SI components or the two “best sensors”. Results from four subjects showed that classification accuracy was significantly higher when SOBI-recovered left and right SI components were used for classification than when the EEG sensor signals were used directly.
Keywords: Electroencephalography (EEG), single-trial classification, brain computer interface (BCI), event-related potential (ERP), neural networks
1.
Introduction
The ability to perform single-trial classification of EEG data is an area of research that has recently received much attention. For example, single-trial classification techniques have allowed for the development of Brain Computer Interfaces (BCI) which can support communication abilities for physical disabled patients (for reviews see e.g. [1,2]). In basic research the ability to assess the trial-to-trial variability in event-related potentials (ERPs) could provide new insights into brain function. Identical stimuli do not
necessarily evoke identical responses and substantial trial-to-trial variability is often the rule rather than the exception. Averaging EEG signals across multiple identical stimulation trials discards information about such trial-to-trial variations. Furthermore, the ability to assess EEG data at the level of single-trial would allow for the analysis of transient psychological phenomenon that cannot be repeated over a large number of trials. Generally, single-trail classification is difficult due to the unfavorable signal-to-noise ratio (SNR) of any evoked response embedded within ongoing background activity. To distinguish signals of interest from the background activity different feature extraction methods have been applied, including band power calculations [3], adaptive autoregressive models (AAR) [4,5], common spatial filters (CSP) [6] and recently wavelet transforms [7]. Using the extracted features of interest, two main classification methods have been used, linear and nonlinear classification. Linear discrimination analysis (LDA) [8,9] is a commonly used method for classification. Neural networks [10] and support vector machines [8,9] are two main nonlinear classification methods. Regardless of the specific methods employed for feature extraction or classification, substantial between-subject variability in classification accuracy is often observed, e.g. [5,11]. In this paper, we applied second-order blind identification (SOBI) [12-14], a blind source separation (BSS) algorithm to EEG data collected during median nerve stimulation with the goal of performing classification of ERPs elicited under different stimulation conditions. For reviews of various BSS algorithms that have been applied to MEG or EEG data, see [15,16]. Previously, we have shown that when applied to MEG data, SOBI can separate functionally distinct neuronal signals from each other and from other extra-cranial noise sources under conditions of poor SNR [17,18]. SOBI was able to recover components that were physiologically and neuroanatomically
interpretable [17,18]. These advantages motivated us to explore the utility of SOBI for the preprocessing of EEG data for the purpose of single-trial classification. Here, we applied SOBI to EEG data collected during a sequence of mixed left (L), right (R), and bilateral (B) median nerve stimulations which was designed to induce overlapping activation in the primary somatosensory cortices (SI) of the left and right hemispheres. Back-Propagation Neural Networks (BPNN), one of the most widely used neural networks for pattern classification, were then used to classify these three types of stimulation based on the SOBI-recovered left and right SI sources. Classification performance based on the SOBI-recovered sources was compared to that based on the two EEG sensors with the largest amplitudes in their ERPs. To evaluate the feasibility of SOBI processing EEG data in real time, we also examined how quickly SOBI could converge. We show that stable separation of the SOBI-recovered SI sources can be achieved after only a few tens of iterations, thus making real time application a future possibility. In Part 2, we describe the EEG data; Part 3 the SOBI algorithm; Part 4 the BPNN; Part 5 gives performance comparisons; Part 6 demonstrates SOBI rapid convergence; Part 7 discusses the results. 2.
EEG Data
Four right-handed subjects (2 males), aged between 20 and 25 years volunteered to participate in this experiment. All subjects were free of a history of neurological or psychological disorders. The experimental procedures were conducted in accordance with the Human Research Review Committee at the University of New Mexico. Unilateral (L: left; R: right) and bilateral (B) stimuli were delivered intermixed and pseudo-randomly with no more than three consecutive identical stimulations. Bilateral stimulation was used to generate simultaneous neuronal activation in the left and right hemispheres in comparison to activation of only one hemisphere by L or R stimulation alone, thus providing a challenge for the decomposition of separate, individual components for left and right SI activations. The number of stimuli per condition was 400 for two subjects, 200 and 150 for the remaining two. EEG signals were recorded with 128 channels continuously sampled at 1000Hz and bandpass filtered between 0.1-200Hz. In conventional data analysis, the continuous EEG data are typically epoched, baseline corrected, possibly filtered, and averaged. Data length is typically reduced after rejecting epochs containing visually identified artifacts. Here, the SOBI BSS algorithm was applied directly to the continuous EEG data as it had been
collected (sensor data) without epoching, artifact rejection, baseline correction, filtering, removal of bad channels or signal averaging, similar to previous applications of SOBI to MEG data [17,18]. 3.
SOBI Analysis
Let x(t) represent n-dimensional vectors which correspond to the n continuous time series from the n EEG channels. Then xі(t) corresponds to the continuous sensor readings from the ith EEG channel. Because various underlying sources are summed via volume conduction to give rise to the scalp EEG, each of the xі(t) are assumed to be an instantaneous linear mixture of n unknown components or sources sі(t), via the unknown mixing matrix A. x(t) = A s(t)
(1)
SOBI uses the EEG measurement x(t) and nothing else to generate an unmixing matrix W that approximates A-1, and the vector of the estimated component values, ŝ(t), ŝ(t) = W x(t),
(2)
where ŝ(t) is the continuous time series of the components or recovered sources. Sensor space projections, which indicate the effect of a given component, in isolation, on all sensors are given by the estimated mixing matrix, Â = W-1.
(3)
The SOBI algorithm [12-14] proceeds in two stages. First, the sensor signals are zero-meaned and presphered as follows: y(t) = B(x(t)- 〈 x(t )〉 ).
(4)
The angle brackets 〈⋅〉 denote an average over time, so the subtraction guarantees that y will have a mean of zero. The matrix B is chosen so that the correlation matrix of y, 〈 y (t ) y (t ) 〉 , becomes the identity matrix. accomplished by moving to the PCA basis using, T
B = diag(λi-1/2)UT,
This is
(5)
where λi are the eigenvalues of the correlation matrix,
〈 (x(t ) - 〈 x(t )〉 ) (x(t ) - 〈 x(t )〉 )T 〉 ,
(6) and U is the matrix whose columns are the corresponding eigenvectors, that is, the “PCA components” of x.
For the second stage, one constructs a set of matrices that, in the correct separated basis, should be diagonal. We chose a set of time delay values, τs to compute symmetrized correlation matrices between the signal y(t) and a temporally shifted version of itself: Rτ = sym ( 〈 y (t ) y (t + τ )
T
〉 ).
(7)
Where, T
sym(M) = (M + M )/2,
(8)
is a function that takes an asymmetric matrix and returns a closely related symmetric one. This symmetrization discards some information, but the problem is already highly overconstrained, and the symmetrized matrices provide valid, albeit slightly weaker, constraints on the solution. After calculating the Rτ, we look for a rotation V that jointly diagonalizes all of them by minimizing, 2
Στ Σi≠j (VTRτV) ij ,
(9)
the sum of the squares of the off-diagonal entries of the matrix products VTRτV, via an iterative process ([13]; using MATLAB code available on-line at http://sig.enst.fr/~cardoso/). Users can set a threshold parameter for the sin of the angle of rotation V. When the sin of the angle of rotation V is smaller than a chosen threshold, the iterative process ends. The final estimate of the separation matrix is:
current source density maps and the equivalent current dipole (ECD) locations, obtained using BESA 5.0 (Brain Electrical Source Analysis; MEGIS Software, Munich, Germany), must have been in the vicinity of the hand region of SI to be considered SI sources. For more details, see companion paper in this volume by Sutherland et al. 4.
Back-Propagation Neural Networks
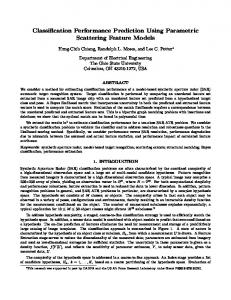
To determine whether SOBI source separation offered any advantage in regards to single-trial classification of SEPs, single epochs (trials) from the SOBI-recovered left and right SI components were used as inputs to BPNN. Alternatively, the two sensors over the regions of interest (above SI) with the largest SEP amplitudes were also used as inputs. Figure 1A displays images of single-trial ERPs for the SOBI-recovered L (C-012) and R SI (C-016) and Figure 1B for the L and R “best sensors”. Each row of colored pixels represents a single epoch and epochs are stacked vertically with earlier trials displayed at the bottom (images were generated using EEGLAB [20]). The labels, L, R, and B, on the left side of each image, indicate left, right, or bilateral stimulation conditions. It is apparent (when viewed in color) that the recovered left (C-012) and right SI(C-016) sources showed selective responses to contralateral (left SI = R stimulation, Right SI = L) and bilateral (B) stimulation. Note, although the trials are shown grouped by (C-016) A
C-012
C-016 16
B
W = VTB,
(10)
which is used to derive the separated components in Eq. 2. A wide range of time delays, τs were chosen to generate multiple covariance matrices for source separation. Similar to previous studies where SOBI was applied to MEG data [17,18], the following τs were used:
0 µV
L
Using the above parameters, SOBI-recovered components corresponding to left and right SI activation were identified. The identity of the corresponding SOBI components was established using both spatial and temporal constraints. Temporally, somatosensory evoked potentials (SEPs) averaged around median nerve stimulation must have shown characteristic SI responses and spatially, the scalp
0 µV
L -16
R
-200
0
200
-16
R
Right Left Bilateral
6µV
B
Right Left Bilateral
6µV
400
-200
0
Time(ms)
200
400
Time(ms)
Left SS Sensor
τ ∈ {1, 2, 3, 4, 5, 6, 7, 8, 9, 10, 12, 14, 16, 18, 20,
25, 30, 35, 40, 45, 50, 55, 60, 65, 70, 75, 80, 85, 90, 95, 100, 120, 140, 160, 180, 200, 220, 240, 260, 280, 300}.
16
B
Right SS Sensor 16
B
16
B 0 µV
0 µV
L
L -16
R
Right Left Bilateral
6µV
-200
0
200
Time(ms)
400
-16
R
Right Left Bilateral
6µV
-200
0
200
400
Time(ms)
Figure 1. Single-trial and averaged SEPs
5.
SOBI Improved Single-Trial ERP Classification
To examine whether SOBI preprocessing offered any advantage in single-trial classification, we compared single-trial response classification accuracy using the SOBI-recovered SI components to classification accuracy using the two “best” EEG sensors. When using the two SOBI-recovered SI sources as inputs, the neural networks trained on 50% of the trials led to a classification accuracy of 83.3% ± 5.6% (N = 4) on the remaining 50% of the trials. In contrast, when using single-trial SEPs from the “best sensors”, similarly trained neural networks only reached a classification accuracy of
64.1% ± 2.3% (N = 4), which was significantly lower than that obtained from the SOBI-recovered left and right SIs (Wilcoxon test, N = 4, p < .05, one tailed, Figure 2). Chance level performance was 33.3% given three classes. Thus, generalization from the training to testing sets was significantly improved by SOBI preprocessing. The range in classification accuracy across subjects (51.7% to 79.7%) was relatively large (~30%) when the “best sensor” data was used. In contrast, when the SOBIrecovered SI components were used, the range in accuracy (79.2% to 88.9%) was decreased substantially (