Hindawi Publishing Corporation Journal of Nanomaterials Volume 2016, Article ID 9245159, 8 pages http://dx.doi.org/10.1155/2016/9245159
Research Article Fabrication of Si/SiO2 Superlattice Microwire Array Solar Cells Using Microsphere Lithography Shigeru Yamada,1 Shinsuke Miyajima,2 and Makoto Konagai1,3 1
Japan Science and Technology Agency (JST), Fukushima Renewable Energy Institute (FREA), Koriyama, Fukushima 963-0215, Japan Department of Physical Electronics, Tokyo Institute of Technology, Meguro, Tokyo 152-8552, Japan 3 Advanced Research Laboratories, Tokyo City University, Setagaya, Tokyo 158-0082, Japan 2
Correspondence should be addressed to Shigeru Yamada;
[email protected] Received 21 July 2016; Accepted 27 September 2016 Academic Editor: Xiaopeng Li Copyright © 2016 Shigeru Yamada et al. This is an open access article distributed under the Creative Commons Attribution License, which permits unrestricted use, distribution, and reproduction in any medium, provided the original work is properly cited. A fabrication process for silicon/silicon dioxide (Si/SiO2 ) superlattice microwire array solar cells was developed. The Si/SiO2 superlattice microwire array was fabricated using a microsphere lithography process with polystyrene particles. The solar cell shows a photovoltaic effect and an open-circuit voltage of 128 mV was obtained. The limiting factors of the solar cell performance were investigated from the careful observations of the solar cell structures. We also investigated the influence of the microwire array structure on light trapping in the solar cells.
1. Introduction The development of crystalline silicon (c-Si) solar cells has a long history and a conversion efficiency of 25.6% has recently been achieved by back-contact silicon heterojunction cells [1]. However, the theoretical conversion efficiency limit of a c-Si single-junction solar cell under 1 sun irradiation is lower than 30% according to the Shockley-Queisser limit [2, 3]. Some novel techniques have been proposed to realize solar cells with higher conversion efficiency than the theoretical limit [4–6]. Examples of solar cells fabricated using the proposed techniques are multiple exciton generation effect solar cells, intermediate-band solar cells, and hot-carrier solar cells. In addition, tandem solar cells or multijunction solar cells are also promising for exceeding the theoretical conversion efficiency limit of single-junction solar cells [7]. Multijunction solar cells can reduce transmission losses and thermal relaxation losses by using two or more absorber materials. In the case of a double-junction solar cell with a c-Si bottom cell, the optimum bandgap for the absorber material in the top cell is approximately 1.7 eV. Si nanomaterials, such as silicon quantum wells, silicon quantum wires, and silicon quantum dots, are attractive materials for realizing widebandgap Si-related materials based on the quantum size effect
[8–11]. A silicon/silicon dioxide superlattice (Si/SiO2 SL), which is one of the Si nanomaterials, has been investigated for applications to wide-bandgap materials by many researchers for many years. In particular, the bandgap shift in Si/SiO2 SLs has been confirmed by optical measurements, such as photoluminescence spectrum and absorption spectrum measurements [12–15]. However, the research on the electrical properties of Si/SiO2 solar cells is at an early stage, and the confirmation of a bandgap shift from electrical measurements has hardly been reported. On the other hand, theoretical calculations of the electrical properties have been carried out using several methods, such as by combining first-principle calculations and a drift-diffusion transport model and by the nonequilibrium Green’s function method [16–18]. The solar cell performance is quite sensitive to the thickness of the SiO2 layers in a Si/SiO2 SL. The carrier localization in the SL, where an electrical field is applied, due to the Wannier-Stark effect can be a problem [19, 20]. Nevertheless, high-efficiency c-Si solar cells with a tunnel oxide passivated contact have been reported recently [21, 22], suggesting that the quantum effect can be applied to solar cells. Solar cells utilizing the quantum tunneling effect through high barrier layers, similarly to those using the quantum size effect, are promising and should be actively investigated.
2
Journal of Nanomaterials Si/SiO2 SL
PS
Si/SiO2 SLNW/SLMW
TiO2
c-Si Sputtering annealing (ii)
ALD (i) Al2 O3
Dip-coating (iii) p-a-Si:H
ALD
CMP
PECVD
(v)
(vi)
(vii)
RIE H-plasma treatment (iv) Al/ITO
Sputtering evaporation (viii)
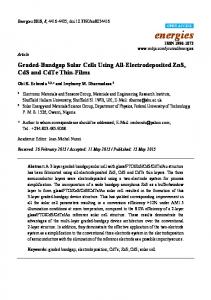
Figure 1: Schematic diagram of fabrication procedure of Si/SiO2 SLNW or SLMW solar cells.
We have proposed silicon superlattice microwire (SLMW) structures. In this structure, the SL introduces the quantum confinement effect into solar cells. A MW array realizes light trapping in solar cells. An advantage of the wire structures is that the thickness of a Si/SiO2 SL absorber layer can be reduced due to the optical confinement effect. The reduction of the SL thickness will contribute to the reduction of series resistance of the SL absorber layer. The optimum length and diameter for a Si/SiO2 wire should be 1 𝜇m to 2 𝜇m and 500 nm to 2 𝜇m, respectively, as previously reported [23]. From the viewpoint of quantum confinement, silicon superlattice nanowire (SLNW) is also a promising structure. However, the optical confinement effect of SLMW is expected to be superior to that of SLNW. In this article, the fabrication of Si/SiO2 SLMW array solar cells using microsphere lithography techniques is reported. Furthermore, the problems of the solar cells were analyzed in detail.
2. Materials and Methods The step-by-step fabrication process of Si/SiO2 SLMW array solar cells is shown in Figure 1. Titanium dioxide (TiO2 ) films were deposited on heavily phosphorus-doped Si substrates (𝜌 = 0.0007–0.0015 Ω⋅cm) by atomic layer deposition (ALD). Si/SiO2 SLs were prepared on the TiO2 -coated Si substrates by magnetron sputtering and subsequent annealing. A Si target (99.999%) was used for the sputtering. Argon (Ar) gas was used for the Si layer deposition and a mixture of Ar and oxygen (O2 ) was used for the deposition of the SiO2 layer. The deposited Si layer was amorphous silicon (a-Si). The periodic structure of the a-Si and SiO2 layers was prepared by flowing Ar and a mixture of Ar and O2 periodically. The thickness of each layer can be tuned by controlling the flowing time of each gas. In this study, SL films with 7.9 nm thick Si layers
and 2.2 nm thick SiO2 layers were prepared. The number of periods of the SL was 108 so that the total SL thickness was approximately 1 𝜇m. The deposition pressure, deposition temperature, and plasma power density were 1.0 Pa, 25∘ C, and 2.36 W/cm2 , respectively. The films were annealed at 1000∘ C for 2 h under a forming gas (N2 : H2 = 97% : 3%) atmosphere to crystallize the a-Si layers in the SLs. The SL after the thermal annealing can be more structurally and thermally stable. The SL film was exposed to ozone in a UV-ozone cleaner to increase the wettability on the surface. Then, the SL film was dipped into 2 𝜇m diameter polystyrene- (PS-) particle-dispersed water, and the SL film was vertically lifted up under dry air. This process resulted in periodically aligned PS particles on the SL film. The SL films on which PS particles were periodically aligned were etched by reactive ion etching (RIE) using tetrafluoromethane (CF4 ) gas, resulting in the SLMW structure. Here, half of the film was covered with a mask to prepare flat-type SL solar cells as reference cells on the same substrate. Then, the SLMW film was exposed to hydrogen plasma at 500∘ C to reduce the defect density in the SL layer. Subsequently, the films were covered with Al2 O3 by ALD to prevent leakage through the front electrodes to the c-Si substrate. To make a contact at the front side, Al2 O3 deposited on the top of the SLMW was selectively removed by chemical mechanical polishing (CMP). After cleaning by hot acetone and a mixture of sulfuric acid and hydrogen peroxide (H2 SO4 : H2 O2 = 1 : 3), p-type boron-doped hydrogenated amorphous silicon (p-a-Si:H) films were deposited by plasma-enhanced chemical vapor deposition (PECVD), indium tin oxide (ITO) films were deposited by magnetron sputtering, and aluminum electrodes were deposited using an evaporator. The solar cells were characterized by darkIV and photo-IV measurements under 1 sun irradiation at 25∘ C with a King Design KD-SACL-K solar simulator
Journal of Nanomaterials TiO2 Si/SiO2 SL 10 Phosphorus concentration (cm−3 )
and an Agilent B1500A semiconductor device analyzer. The wire-array structures and solar cell structures were observed by field-emission scanning electron microscopy (FE-SEM) with a Hitachi SU8230 microscope, transmission electron microscopy (TEM) with a JEOL JEM-ARM200F microscope, and scanning transmission electron microscopy (STEM) with a Hitachi HD-2700 microscope. SL films and SLMW array films were also prepared on quartz substrates to measure the transmittance and reflectance, which were measured by ultraviolet-visible (UV-VIS) spectroscopy with a Shimadzu SolidSpec-3700 spectrometer using an integrating sphere. The dopant diffusion barrier effect of a TiO2 layer between the c-Si substrate and the SL layer was investigated by secondary ion mass spectroscopy (SIMS) with a CAMECA IMS-7f spectrometer.
3
1020 1019 1018 1017 1016 1015 0
200
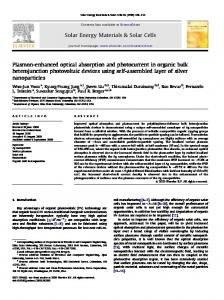
3. Results and Discussion 3.1. Dopant Diffusion Barrier Layer. We selected heavily phosphorus-doped c-Si as the substrate in the solar cell structure since it is thermally stable and conductive and has a short minority-carrier lifetime. The short minoritycarrier lifetime prohibits the contribution of photogenerated carriers in the c-Si substrate to the photocurrent of the solar cell. However, the phosphorus diffusion from the cSi substrate into the SL layer during the annealing is a problem. Some approaches, such as the detachment of a film from the substrate and the etching of the substrate, can be effective for avoiding the problem of impurity diffusion [24, 25]. Another approach is the insertion of a thin TiO2 layer as a barrier layers preventing phosphorus dopant impurity diffusion between the substrate and the SL layer as reported in [26]. Therefore, an ultrathin TiO2 layer was prepared on a c-Si substrate by ALD and its diffusion barrier effect was investigated. Figure 2 shows depth profiles of the phosphorus concentrations in the Si/SiO2 SL/c-Si and Si/SiO2 SL/TiO2 /cSi structures measured by SIMS, where the thickness of the TiO2 layer was approximately 4 nm. For both profiles, the peak appearing at the interface between the Si/SiO2 SL layer and the c-Si substrate originates from the matrix effect. The detection limit of phosphorus in this measurement system is 1 × 1015 cm−3 . The penetration lengths of phosphorus into the SL layer are different for both profiles. For the profile without a TiO2 layer, the phosphorus concentration gradually decays and approaches the detection limit at the depth of approximately 400 nm. On the other hand, for the profile with a 4 nm thick TiO2 layer, the phosphorus concentration drastically decays and the diffusion length is 70 to 80 nm. From these results, TiO2 prepared by ALD can be used as a blocking layer against phosphorus diffusion during the 1000∘ C-annealing process. 3.2. Fabrication of SLMW Array. A surface SEM image of a PS-coated SL before RIE is shown in Figure 3(a). Uniform single-layer PS-particle arrays were successfully prepared on the SL films in an area as wide as 1 cm2 . Close packing alignments, point defects with vacancies or impurities, and line defects can be seen, similar to the case of a polycrystalline structure. The influence of these defects on the electrical
c-Si
21
400 600 Depth (nm)
800
1000
w/o TiO2 w/ TiO2
Figure 2: Depth profiles of phosphorus concentrations in the structures with and without a TiO2 layer evaluated by SIMS measurements.
properties and optical properties is considered to be negligible. A surface SEM image of a SLMW array is shown in Figure 3(b). The circles correspond to the top surfaces of SLMWs. The alignment and the diameters of the SLMWs are reflected by those of the PS particles. A cross-sectional SEM image of a SLMW is shown in Figure 3(c). The SLMW has a tapered shape, whose top diameter and bottom diameter can be estimated to be approximately 1.2 𝜇m and 1.8 𝜇m, respectively. The difference between the diameters of the top area and bottom area is due to the reduction of the diameter of the PS particles during the RIE process. On the assumption that PS particles are etched from only the top surface, the shape function of a SLMW can be represented as 𝑇 (𝑟; 𝑡) 1 1 { 𝑅 (𝑡 − √𝐷2 − 4𝑟2 ) , 𝑡 > √𝐷2 − 4𝑟2 { { 𝑓 𝑅𝑠 𝑅𝑠 ={ { 1 {0, 𝑡 ≤ √𝐷2 − 4𝑟2 , 𝑅𝑠 {
(1)
where 𝐷, 𝑅𝑠 , and 𝑅𝑓 denote the diameter of a PS particle, the etching rate of a PS particle, and the etching rate of a Si/SiO2 SL, respectively. Also, 𝑟 and 𝑡 mean the distance from the center of a SLMW and the etching time, respectively. The dashed line depicted in Figure 3(c) represents the fitting curve of a SLMW shape based on (1). The etching selectivity, namely, 𝑅𝑓 /𝑅𝑠 , estimated from the curve is 0.59. This means that if the thickness of a Si/SiO2 SL is more than 0.59 times as large as the diameter of a PS particle, the PS particle disappears before the SL film is completely etched. The 2 𝜇m diameter PS particles are sufficiently large to obtain a SLMW array with a depth and diameter of approximately 1 𝜇m.
4
Journal of Nanomaterials
20𝜇m
20𝜇m
(a)
(b)
800 nm (c)
Figure 3: (a) Surface SEM image of a PS-particle-array-coated Si/SiO2 SL. (b) Surface SEM image of a Si/SiO2 SLMW array after RIE. (c) Cross-sectional SEM image of a Si/SiO2 SLMW. The yellow dashed line represents the fitting line based on the wire shape function given by (1).
The transmittance (𝑇), reflectance (𝑅), and absorbance (𝐴) spectra of a flat SL and a SLMW array are shown in Figure 4. Here, the absorbance is calculated by 𝐴 = 100 − 𝑅 − 𝑇.
(2)
The transmittance spectrum for a SLMW is lower than that for the flat SL in the wavelength region longer than 550 nm. The fluctuation of the spectrum due to optical interference also decreases. This is probably due to the optical confinement in the MW structure. On the other hand, the reflectance spectrum for the SLMW in the wavelength region between 400 nm and 700 nm is lower than that for the flat SL. This is due to the antireflection effect of the MW structure. As a result, the absorption spectrum for the SLMW array is higher than that for the flat SL in a wide wavelength region. The enhancement of the absorption spectrum can contribute to increasing the effective optical length. Here, it should be noted that the absorption for both cases in the long wavelength region larger than the bandgap energy of a SL should be zero. The fluctuations in the spectra are artificially produced peaks due to fluctuations of the angle and/or the gap distance between the sample and the integrating sphere, which is especially sensitive for textured samples. 3.3. SLMW Array Solar Cells. Figure 5(a) shows the darkIV and photo-IV characteristics for a flat SL solar cell and Figure 5(b) shows the dark-IV and photo-IV characteristics for a SLMW array solar cell fabricated using the fabrication process shown in Figure 1. The open-circuit voltage (𝑉oc )
and short-circuit current density (𝐽sc ) for the flat SL solar cell were 107 mV and 7.1 × 10⁻⁵ mA/cm2 , respectively. On the other hand, 𝑉oc and 𝐽sc for the SLMW solar cell were 128 mV and 1.4 × 10⁻⁴ mA/cm2 , respectively. The photovoltaic effect was obtained for both the flat SL and the SLMW. The difference between the leakage currents of the solar cells is not so large, which means that the spaces between the SLMWs were insulated with Al2 O3 prepared by ALD and the leakage paths were not formed. These results indicate that our fabrication process is basically applicable to solar cell fabrication. However, the solar cell performance is still low. The diode parameters, the series resistance (𝑅𝑠 ), the shunt resistance (𝑅sh ), the reverse saturation current density (𝐽0 ), and the ideal diode factor (𝑛) for a flat SL cell and a SLMW cell were estimated by fitting the dark-IV curves with ideal one diode model. 𝐽0 , 𝑅𝑠 , 𝑅sh , and 𝑛 were 8.9 × 10⁻⁷ mA/cm2 , 1.3 × 10⁴ Ωcm2 , 4.0 × 10⁶ Ωcm2 , and 2.7 for the SLNW cell and 2.5 × 10⁻⁷ mA/cm2 , 4.0 × 10⁴ Ωcm2 , 3.2 × 10⁶ Ωcm2 , and 2.8 for the SL cell, respectively. Here, 𝑅𝑠 and 𝑛 should be noted. The diode factor 𝑛 is greater than 2.0, which suggests that high barriers against carriers are existing in the solar cell and the barriers lead to small 𝑉oc [27, 28]. Besides, such high series resistances significantly affect 𝐽sc . The poor 𝐽sc is probably due to the very high series resistance, and the poor 𝑉oc is associated with the poor ohmic contact at the p-layer/SL layer. To examine the solar cells in more detail, the crosssectional structure of the solar cells was investigated. Figure 6 shows cross-sectional TEM images of an SLMW array solar cell. Figure 6(a) shows the whole region of the SLMW
Journal of Nanomaterials
5
80
T (%)
60 40 20 0 300
600
900 Wavelength (nm)
1200
1500
600
900 Wavelength (nm)
1200
1500
600
900 Wavelength (nm)
1200
1500
80
R (%)
60 40 20 0 300
80
A (%)
60 40 20 0 300
Flat SL SLM W
Figure 4: Transmittance, reflectance, and absorbance of a flat SL film and a SLMW array film deposited on quartz substrates. The red and blue lines correspond to the flat SL and the SLMW array, respectively. 0.001
Current density (mA/cm2 )
Current density (mA/cm2 )
0.001
0
−0.001 −0.2
0
0.2
0.4
0.6
0
−0.001 −0.2
0
Voltage (V) Dark-IV Photo-IV
0.2
0.4
Voltage (V) Dark-IV Photo-IV
(a)
(b)
Figure 5: Dark-IV and photo-IV characteristics for (a) flat SL solar cell and (b) SLMW array solar cell.
0.6
6
Journal of Nanomaterials
ITO
(b)
(c)
p-a-Si:H
(d) 800 nm (a)
Si/SiO2 SL
80 nm
(b)
ITO p-a-Si:H
Si/SiO2 SL Al2 O3 Si/SiO2 SL 80 nm
(c)
TiO2 c-Si
10 nm
(d)
Figure 6: Cross-sectional STEM images of (a) whole area of a SLMW, (b) magnified image of top region of the SLMW, and (c) magnified image of side region of the SLMW. (d) Cross-sectional magnified TEM image of bottom region of the SLMW.
structure observed by STEM. The thick white layer deposited on the top of the solar cell structure is the supporting layer used for the preparation of a TEM sample. The dark layer is the ITO layer. A layered structure can be seen in the SL layer. Figures 6(b), 6(c), and 6(d) show magnified images of the top area of the SLMW, the side area of the SLMW, and the bottom area of the SLMW, respectively. As shown in Figure 6(c), an Al2 O3 layer covers the side of the SLMW, and the SLMW is isolated from the p-type a-Si:H layer and ITO layer. On the other hand, in the top area of the SLMW, the Al2 O3 layer has been removed and a p-type a-Si:H layer has been deposited on the SLMW as shown in Figure 6(b). Furthermore, the surface is quite flat after the CMP process. Therefore, the contact with the p-layer is considered to have only formed on the top area of the SLMW array. However, an ultrathin white layer can be seen between the p-type layer and the SL layer, implying that a thin oxide layer still remains. The samples were cleaned by a mixture of sulfuric acid and hydrogen peroxide, resulting in the formation of the thin oxide layer. In the bottom area of the SLMW, a TiO2 layer can be seen on the c-Si substrate as shown in Figure 6(d). An oxide layer also exists between the TiO2 layer and the c-Si substrate, which is due to the surface oxidation in the early phase of the ALD deposition process. Also, a thick oxide layer, whose thickness is around 25 nm to 30 nm, exists on the TiO2 layer, and several nc-Si layers in the SL are broken. This is attributed to the instability of the oxygen
partial pressure in the atmosphere in the early phase of SL deposition. Such oxidized layers can contribute to the high series resistance. Other possible reasons for the high series resistance are the resistance in the ITO layer deposited on the wire structure. The ITO is thinner on the side of the SLMWs if the trenches of the SLMWs are not completely embedded. Since the resistances for poly-Si solar cells prepared with a poly-Si layer in place of a SL were as high as those for SL solar cells, one can conclude that such high resistances mainly originate from the unintentional formation of the oxidized layer during the fabrication process. These problems can be resolved by careful cleaning and improving the settings of each layer deposition process. The reflectance of the SLMW solar cell structure was also investigated to clarify the advantage of a wire structure. Figure 7 shows the reflectance spectra of a flat SL solar cell and a SLMW cell structure with and without an ITO layer. For the flat SL solar cell, the reflectance with ITO is lower than that without ITO since the ITO layer acts as an antireflection layer. Similarly, for the SLMW solar cell, the reflectance with ITO is lower than that without ITO. The reflectance for the SLMW solar cell is lower than that of the flat SL solar cell. In addition, optical interference is suppressed for the SLMW solar cell, implying that light trapping occurred in the SLMW solar cell. While the ITO layer has an antireflection effect, it is enhanced by the wire structures, and the enhancement of the photocurrent can be expected.
Journal of Nanomaterials
7
100
Reflectance (%)
80 60 40 20 0 300
600
900 Wavelength (nm)
Flat SL w/o ITO Flat SL w/ ITO
1200
1500
SLMW w/o ITO SLMW w/ ITO
Figure 7: Reflectance spectra of a flat SL solar cell and a SLMW solar cell structure with and without an ITO layer.
4. Conclusions We prepared Si/SiO2 SLMW array films and solar cells. The photovoltaic effect was confirmed from the SLMW solar cell as well as from the flat SL solar cell. Careful observations of the solar cell structure revealed that unintentional oxidized layers at the front and rear interface of the SL layer lead to the very high series resistance of our devices. If the high series resistance resulting from the oxidized layers is removed, the enhancement of 𝐽sc by the optical confinement effect can be expected.
Competing Interests The authors declare that there is no conflict of interests regarding the publication of this paper.
Acknowledgments The authors would like to express sincere thanks to the Ministry of Education, Culture, Sports, Science and Technology (MEXT), Japan, FUTURE-PV Innovation for their support. Also, the authors would like to thank Shintaro Kubo for the preparation of samples.
References [1] K. Masuko, M. Shigematsu, T. Hashiguchi et al., “Achievement of more than 25% conversion efficiency with crystalline silicon heterojunction solar cell,” IEEE Journal of Photovoltaics, vol. 4, no. 6, pp. 1433–1435, 2014. [2] W. Shockley and H. J. Queisser, “Detailed balance limit of efficiency of p-n junction solar cells,” Journal of Applied Physics, vol. 32, no. 3, pp. 510–519, 1961. [3] T. Tiedje, E. Yablonovitch, G. D. Cody, and B. G. Brooks, “Limiting efficiency of silicon solar cells,” IEEE Transactions on Electron Devices, vol. ED-31, no. 5, pp. 711–716, 1984.
[4] A. J. Nozik, M. C. Beard, J. M. Luther, M. Law, R. J. Ellingson, and J. C. Johnson, “Semiconductor quantum dots and quantum dot arrays and applications of multiple exciton generation to third-generation photovoltaic solar cells,” Chemical Reviews, vol. 110, no. 11, pp. 6873–6890, 2010. [5] Y. Okada, N. J. Ekins-Daukes, T. Kita et al., “Intermediate band solar cells: recent progress and future directions,” Applied Physics Reviews, vol. 2, no. 2, Article ID 021302, 2015. [6] D. Knig, K. Casalenuovo, Y. Takeda et al., “Hot carrier solar cells: principles, materials and design,” Physica E, vol. 42, no. 10, pp. 2862–2866, 2010. [7] A. D. Vos, “Detailed balance limit of the efficiency of tandem solar cells,” Journal of Physics D: Applied Physics, vol. 13, no. 5, pp. 839–846, 1980. [8] Y. Takahashi, T. Furuta, Y. Ono, T. Ishiyama, and M. Tabe, “Photoluminescence from a silicon quantum well formed on separation by implanted oxygen substrate,” Japanese Journal of Applied Physics, vol. 34, no. 2, pp. 950–954, 1995. [9] X. Zhao, C. M. Wei, L. Yang, and M. Y. Chou, “Quantum confinement and electronic properties of silicon nanowires,” Physical Review Letters, vol. 92, no. 23, pp. 236805–1, 2004. [10] Y. Kurokawa, S. Tomita, S. Miyajima, A. Yamada, and M. Konagai, “Photoluminescence from silicon quantum dots in Si quantum dots/amorphous SiC superlattice,” Japanese Journal of Applied Physics, vol. 46, no. 33–35, pp. L833–L835, 2007. [11] G. Conibeer, M. Green, E.-C. Cho et al., “Silicon quantum dot nanostructures for tandem photovoltaic cells,” Thin Solid Films, vol. 516, no. 20, pp. 6748–6756, 2008. [12] D. J. Lockwood, Z. H. Lu, and J. Baribeau, “Quantum Confined luminescence in Si/SiO2 superlattices,” Physical Review Letters, vol. 76, no. 3, pp. 539–541, 1996. [13] M. Zacharias, J. Heitmann, R. Scholz, U. Kahler, M. Schmidt, and J. Bl¨asing, “Size-controlled highly luminescent silicon nanocrystals: a SiO/SiO2 superlattice approach,” Applied Physics Letters, vol. 80, no. 4, pp. 661–663, 2002. [14] J. Lopez-Vidrier, S. Hernandez, A. M. Hartel et al., “Structural and optical characterization of size controlled silicon nanocrystals in SiO2 /SiO𝑥 N𝑦 multilayers,” Energy Procedia, vol. 10, pp. 43–48, 2011. [15] S. Yamada, M. Konagai, and S. Miyajima, “Investigation of the optical absorption in Si/SiO2 superlattice for the application to solar cells,” Japanese Journal of Applied Physics, vol. 55, Article ID 04ES06, 2016. [16] T. Kirchartz, K. Seino, J.-M. Wagner, U. Rau, and F. Bechstedt, “Efficiency limits of Si/SiO2 quantum well solar cells from firstprinciples calculations,” Journal of Applied Physics, vol. 105, no. 10, Article ID 104511, 2009. [17] U. Aeberhard, “Theory and simulation of photogeneration and transport in Si-SiO𝑥 superlattice absorbers,” Nanoscale Research Letters, vol. 6, article 242, 2011. [18] U. Aeberhard, “Effective microscopic theory of quantum dot superlattice solar cells,” Optical and Quantum Electronics, vol. 44, no. 3–5, pp. 133–140, 2012. [19] R. Tsu and G. D¨ohler, “Hopping conduction in a ‘superlattice’,” Physical Review B, vol. 12, no. 2, pp. 680–686, 1975. [20] A. Wacker, “Semiconductor superlattices: a model system for nonlinear transport,” Physics Reports, vol. 357, no. 1, pp. 1–11, 2002. [21] F. Feldmann, M. Bivour, C. Reichel, H. Steinkemper, M. Hermle, and S. W. Glunz, “Tunnel oxide passivated contacts as an alternative to partial rear contacts,” Solar Energy Materials and Solar Cells, vol. 131, pp. 46–50, 2014.
8 [22] F. Feldmann, M. Simon, M. Bivour, C. Reichel, M. Hermle, and S. W. Glunz, “Efficient carrier-selective p- and n-contacts for Si solar cells,” Solar Energy Materials and Solar Cells, vol. 131, pp. 100–104, 2014. [23] T. Higa, R. Ishikawa, S. Miyajima, and M. Konagai, “Properties of Si/SiO2 superlattice nanodisc array prepared by nanosphere lithography,” in Next Generation Technologies for Solar Energy Conversion V, vol. 91780 of Proceedings of SPIE, San Diego, Calif, USA, August 2014. [24] H. S. Radhakrishnan, R. Martini, V. Depauw et al., “Kerfless layer-transfer of thin epitaxial silicon foils using novel multiple layer porous silicon stacks with near 100% detachment yield and large minority carrier diffusion lengths,” Solar Energy Materials and Solar Cells, vol. 135, pp. 113–123, 2015. [25] P. L¨oper, D. St¨uwe, M. K¨unle et al., “A membrane device for substrate-free photovoltaic characterization of quantum dot based p-i-n solar cells,” Advanced Materials, vol. 24, no. 23, pp. 3124–3129, 2012. [26] S. Yamada, Y. Kurokawa, S. Miyajima, and M. Konagai, “Improvement of electrical properties of silicon quantum dot superlattice solar cells with diffusion barrier layers,” Japanese Journal of Applied Physics, vol. 52, no. 4, Article ID 04CR02, 2013. [27] A. N. Corpus-Mendoza, M. M. De Souza, and F. U. Hamelmann, “Design of schottky contacts for optimum performance of thinfilm silicon solar cells,” IEEE Journal of Photovoltaics, vol. 5, no. 1, pp. 22–27, 2015. [28] R. V. K. Chavali, J. R. Wilcox, B. Ray, J. L. Gray, and M. A. Alam, “Correlated nonideal effects of dark and light I–V characteristics in a-Si/c-Si heterojunction solar cells,” IEEE Journal of Photovoltaics, vol. 4, no. 3, pp. 763–771, 2014.
Journal of Nanomaterials
Journal of
Nanotechnology Hindawi Publishing Corporation http://www.hindawi.com
Volume 2014
International Journal of
International Journal of
Corrosion Hindawi Publishing Corporation http://www.hindawi.com
Polymer Science Volume 2014
Hindawi Publishing Corporation http://www.hindawi.com
Volume 2014
Smart Materials Research Hindawi Publishing Corporation http://www.hindawi.com
Journal of
Composites Volume 2014
Hindawi Publishing Corporation http://www.hindawi.com
Volume 2014
Journal of
Metallurgy
BioMed Research International Hindawi Publishing Corporation http://www.hindawi.com
Volume 2014
Nanomaterials
Hindawi Publishing Corporation http://www.hindawi.com
Volume 2014
Submit your manuscripts at http://www.hindawi.com Journal of
Materials Hindawi Publishing Corporation http://www.hindawi.com
Volume 2014
Journal of
Nanoparticles Hindawi Publishing Corporation http://www.hindawi.com
Volume 2014
Nanomaterials Journal of
Advances in
Materials Science and Engineering Hindawi Publishing Corporation http://www.hindawi.com
Volume 2014
Journal of
Hindawi Publishing Corporation http://www.hindawi.com
Volume 2014
Journal of
Nanoscience Hindawi Publishing Corporation http://www.hindawi.com
Scientifica
Hindawi Publishing Corporation http://www.hindawi.com
Volume 2014
Journal of
Coatings Volume 2014
Hindawi Publishing Corporation http://www.hindawi.com
Crystallography Volume 2014
Hindawi Publishing Corporation http://www.hindawi.com
Volume 2014
The Scientific World Journal Hindawi Publishing Corporation http://www.hindawi.com
Volume 2014
Hindawi Publishing Corporation http://www.hindawi.com
Volume 2014
Journal of
Journal of
Textiles
Ceramics Hindawi Publishing Corporation http://www.hindawi.com
International Journal of
Biomaterials
Volume 2014
Hindawi Publishing Corporation http://www.hindawi.com
Volume 2014