E3S Web of Conferences 73, 1300 8 (2018) ICENIS 2018
https://doi.org/10.1051/e3sconf/20187313008
Soft Computation Vector Autoregressive Neural Network (VAR-NN) GUI-Based Hasbi Yasin1,*, Budi Warsito2, Rukun Santoso3 and Suparti4 1,2,3,4 Department
of Statistics, Faculty of Science and Mathematics, Diponegoro University, Semarang – Indonesia
Abstract. Vector autoregressive model proposed for multivariate time series data. Neural Network, including Feed Forward Neural Network (FFNN), is the powerful tool for the nonlinear model. In autoregressive model, the input layer is the past values of the same series up to certain lag and the output layers is the current value. So, VAR-NN is proposed to predict the multivariate time series data using nonlinear approach. The optimal lag time in VAR are used as aid of selecting the input in VAR-NN. In this study we develop the soft computation tools of VAR-NN based on Graphical User Interface. In each number of neurons in hidden layer, the looping process is performed several times in order to get the best result. The best one is chosen by the least of Mean Absolute Percentage Error (MAPE) criteria. In this study, the model is applied in the two series of stock price data from Indonesia Stock Exchange. Evaluation of VAR-NN performance was based on trainvalidation and test-validation sample approach. Based on the empirical stock price data it can be concluded that VAR-NN yields perfect performance both in in-sample and in outsample for non-linear function approximation. This is indicated by the MAPE value that is less than 1% .
Keywords: VAR; FFNN; VARNN; Stock Price.
1 Introduction There is a growing interest in implementing neural networks to many regions, especially in the problem of time series forecasting. Neural networks are flexible methods for estimating functional relationships. Contrary to the classical method, neural networks do not require assumptions of the underlying data. It is appropriate to solve problems where pre-assumptions or past knowledge are difficult to formulate. In this case, neural networks represent non-linear and non-parametric methods [1, 2]. Over time the time series method is not only used for univariate cases, but also for multivariate cases, one of which is the Vector Autoregressive (VAR) model. VAR model is widely used to see the relationship between economic variables in accordance with the existing economic theory [3]. Several previous studies on VAR methods obtained that VAR can be used on stationary or non-stationary data [4]. In analysing the relationship between economic variables in VAR, it is not necessary to distinguish between endogenous and exogenous variables which means that all variables used in VAR are used as endogenous variables [5]. As such, we offer a more flexible approach, namely the neural network model for estimating and predicting non-linear models for multivariate time series cases. The *
proposed model is Vector Autoregressive Neural Network (VAR-NN) which is generated from the Vector Autoregressive (VAR) model. This model includes a very powerful neural network class called the Feed Forward Neural Network (FFNN) [6, 7]. Many studies on the performance of time series forecasting show that neural networks have a non-linear model and provide high accuracy estimates in univariate and multivariate time series. The examples are rainfall prediction in Malang, Indonesia using VAR-NN [8] and airline passenger [9], forecasting on financial data, such as stock market prediction in Indonesia [10], then forecasting the oil production using VAR-NN and GSTAR-NN [11]. The problems that arise in the NN modelling for multivariate time series data is how to determine the selected lag to be the input model and determine the optimal weight for each model input. Therefore, a standard procedure for selecting the optimal input is needed to obtain an optimal model architecture. The main goal of this paper is to develop the soft computational tools of VARNN model based on Graphical User Interface (GUI). The performance is relied on mean absolute percentage error (MAPE) and mean squared error (MSE). To obtain the goal, we
Corresponding author:
[email protected]
© The Authors, published by EDP Sciences. This is an open access article distributed under the terms of the Creative Commons Attribution License 4.0 (http://creativecommons.org/licenses/by/4.0/).
E3S Web of Conferences 73, 1300 8 (2018) ICENIS 2018
https://doi.org/10.1051/e3sconf/20187313008
applied the model in several stock price data from Indonesia Stock Exchange. 2.3 VAR-NN Model
2 Methods
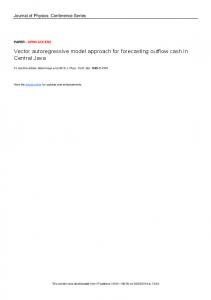
Feed Forward Neural Network is the most commonly model that used in time series prediction. Typical FFNN with one hidden layer for univariate cases resulting from the Autoregressive model called Autoregressive Neural Network (AR-NN). We generalize the model for multivariate cases. The proposed model is Vector Autoregressive Neural Network (VAR-NN) derived from the Vector Autoregressive (VAR) model. The VAR-NN architecture is built similar to the AR-NN, with more than one variable (multivariate) in the output layers [7]. In this case, the input layer contains variables from the previous lag observations of each output variable. Nonlinear estimates are processed in the hidden layer by the activation function. VAR-NN architecture in general cases is very complex; hence, we provide an architecture with one hidden layer for bivariate cases (see Fig. 2)
2.1. Vector Autoregressive (VAR) Model The autoregressive vector model is a multivariate time series method that can explain endogenous variables from past data of the variable. Vector Autoregressive (VAR) is an econometric method that is useful for testing the relationships between variables in a model that has a dynamic impact [12]. If there is a simultaneity between a set of variables, then it should be treated in a fair condition (Equal Footing), ie there is no priority difference between endogenous and exogenous variables. With this purpose Sims produces a VAR model where in this model all variables are considered as endogenous variables. Assumptions in the VAR model assume that all variables are interdependent with each other [5]. VAR (p) model or Vector Autoregressive model with the order p meaning that the independent variable of the model is p the value of the independent lag variable [13].
=
(1)
2.2 Feed Forward Neural Network (FFNN) In this paper multilayer networks are used with the Feed Forward Neural Networks (FFNN) model. On FFNN, neurons are arranged in layers (layers) and the signals flow from input to the first layer, then to the second layer and so on.
Yt = ψ 0 vbo + ∑ vnoψ n wbn + ∑ winYt − j n =1 j =1
Fig. 2. Architecture of VAR-NN(2,2,q) with one hidden layer, 4 input neurons from 2 lag dependen variable, q neurons in hidden layer, and 2 neurons in output layer from 2 dependen variable
p
H
(2)
( wbn , win , vno , vbo ) are the weighting parameters in FFNN and (ψ 0 ,ψ n ) are the training function [14].
Let
where
consists of m variables influenced by the past p lags values. The input vector can be writen as
y = ( y1,t −1 , L , y1,t − p , L , ym ,t −1 , L , ym ,t − p ) .
Warsito states that before training on artificial neural networks, it is often necessary to scale inputs and targets so that data enters a certain range. This is intended to make the data processed according to the activation function used. This process is called Pre-Processing. Then after the training process is complete, the data is returned to its original form (Post-Processing) [15].
there are
X2
w1,t −1,1 M w1,t − p ,1 w= M wm,t −1,1 M w m,t − p ,1
X3 Z3
1
neurons in the input layers. If the
hidden layer has dimension
Y
Z2
( p × m)
Thus,
scalar h denotes the number of neurons in hidden layers then weight matrix (the network weights) for the
Z1
X1
y t = ( y1,t , L , ym,t ) ' be the time series process
1
Fig. 1. Architecture of FFNN with one hidden layer, 3 input neurons, 3 neurons in hidden layer, and one neurons in output layer
2
( p × m ) × h , where
w1,t −1,2 M
K O
w1,t − p ,2 M wm,t −1,2 M wm ,t − p ,2
K O K O K
w1,t −1, h M w1,t − p , h M wm,t −1,h M wm,t − p ,h
E3S Web of Conferences 73, 1300 8 (2018) ICENIS 2018
https://doi.org/10.1051/e3sconf/20187313008
A constant input is involved in a network architecture that is connected to each neuron in the hidden layer and also in the output layer. This yields bias vectors
α = (α1 , α 2 , K, α h ) '
in
the
hidden
layer
and
β = ( β1 , β 2 ,K, β m ) ' in the output layers. If there are m variables in the output layer, the weight matrix for output layer is
λ1,1 λ1,2 λ λ2,2 2,1 λ= M M λm,1 λm,2
K λ1, h K λ2,h O M K λm ,h
then the output of the VAR-NN(p,m,h) can be written as
y t = λF ( yw ) '+ α + β + εt where
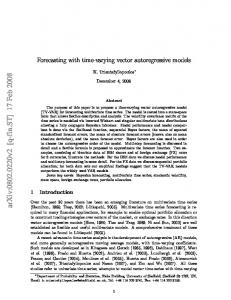
Fig. 3. Display of GUI VAR-NN Model
(3)
ε t = ( ε1,t , ε 2,t , L , ε m,t ) ' is error vector and F is
4 Results In this paper, we use the daily stock price data of UNVR and ASII form Indonesia Stock Exchange. Data is divided into two parts, 90% for in-sample data and 10% for model validation as out-sample data. By using a trial and error technique, it is found that the best VAR-NN model is the VAR-NN model with 1 lag dependent variable and 5 neurons in hidden layer. So the model can be written as VAR-NN(1,2,5). The MAPE from this model is 0.9707% and 0.7353% respectively for insample and out-sample data (see Fig. 4). Then it can also be seen that the predicted value is very close to the actual value, as shown in Fig. 5 and Fig. 6.
a transfer function operated to vector element of
( yw ) '+ α , which commonly used function is logistic sigmoid function [7].
3 Empirical Study in Stock Price Data In this paper, we use the daily stock price data of UNVR and ASII form Indonesia Stock Exchange. The steps of estimation VAR-NN model in stock price data in this research are as follows: 1. Devide data in to in-sample and out-sample data 2. Define the number of lag dependent variable 3. Define the number of neurons in hidden layers 4. Initialize all weights in hidden layer and output layer 5. Calculate the outputs gained from the neurons in the hidden layer with logistic sigmoid activation function 6. Calculate the outputs gained from the neurons in the logistic sigmoid output layer 7. Calculate the error gradient for the neurons in the output layer 8. Calculate the weight correction for the output layer 9. Update all weights in the output layer 10. Calculate the error gradient for the neurons in the hidden layer 11. Calculate the weight correction for the hidden layer 12. Update all weights in the hidden layer 13. Calculate the VARNN prediction accuracy using MAPE and MSE to obtain the best model 14. Predict with the best model
Fig. 4. Output of VAR-NN(1,2,5) Model of UNVR and ASII
stock prices
To compute the VARNN model, we developed a GUI application (see Fig.3). Only by entering the percentage of in sample data, time lag ( and the number of neurons in the hidden layer, MAPE values will be obtained for in sample and out sample data.
3
E3S Web of Conferences 73, 1300 8 (2018) ICENIS 2018
https://doi.org/10.1051/e3sconf/20187313008
4.
Actual vs Predicted Value of 1-th Variable 9000 Actual Predicted
8500
5.
8000
6.
7500
7000 6500
7. 6000
8.
5500
5000 0
50
100
150
200 250 Time
300
350
400
9.
450
Fig. 5. Time Series Plot of Actual vs Predicted Value of UNVR’s Stock Price 4
10.
Actual vs Predicted Value of 2-th Variable
x 10
11.
3.5 Actual Predicted
12. 3
13. 14.
2.5
15. 2 0
50
100
150
200 250 Time
300
350
400
450
Fig. 6. Time Series Plot of Actual vs Predicted Value of ASII’s Stock Price
4 Conclusion It has been shown that VAR-NN (1,2,5) is very precise in predicting stock prices of UNVR and ASII simultaneously. Empirical results show that the accuracy of the model is very high with MAPE values of 0.9 and 0.7 for in-sample and out-sample data. We recommend VAR-NN with input lag 1, and 5 neruron in the hidden layer as the best model to predict the price of the two stocks. Further research is needed to develop input selection procedures that are significantly included in the model to obtain a more accurate performance of the multivariate time series model. We would like to thanks to Faculty of Science and Mathematics, Diponegoro University for their support. This research was funded by “Riset Madya” Research Grant 2018.
References 1. 2. 3.
B.D. Ripley, Statistical Aspects of Neural Networks (1993) H. White, N.R. Swanson, Review of Economic and Statistics, 79, 540–550 (1997) M. Nezky, Buletin Ekonomi Moneter dan Perbankan (2013)
4
D.U. Wutsqa, Suhartono, Jurnal Ilmu Dasar, 11, 1, pp. 101-109 (2010) D.N. Gujarati, Basic Ekonometrics, Fourth Edition (2004) D.U. Wutsqa, Subanar, S. Guritno, Z. Sujuti, Proceeding of the 2nd IMT-GT Regional Conference on Mathematics, Statistics and Applications, Universiti Sains Malaysia, (2006) D.U. Wutsqa, Jurnal Mat Stat, 8, 1, pp. 35-43 (2008) K.A.N. Diani, Setiawan, Suhartono, Jurnal Sains dan Seni POMITS 2, 1 (2013) Suhartono, Subanar, S. Rejeki, IRCMSA Proceedings, Sumatra Utara Indonesia (2005) H. Yasin, Suparti, Media Statistika 7,2, 53-61 (2014) Suhartono, D.D. Prastyo, H. Kuswanto, M.H. Lee, MATEMATIKA 34, 1, 103-111 (2018) O. Ozcelebi, International Jurnal of Economics and Finance 3, 130-139 (2011). R.S. Tsay, Analysis of Financial Time Series, (John Wiley & Sons, Inc., University of Chicago, 2014) S. Kusumadewi, Membangun Jaringan Syaraf Tiruan Mengunakan Matlab dan Excel Link, (Graha Ilmu, Yogyakarta, 2004) B. Warsito, Kapita Selekta Statistika Neural Network, (BP Undip Semarang, 2009)