Software Effort Prediction: A Hyper-Heuristic Decision-Tree based Approach Márcio P. Basgalupp Instituto de Ciencia e Tecnologia - ICT Universidade Federal de Sao Paulo - UNIFESP Sao Jose dos Campos - SP, Brazil
[email protected]
Rodrigo C. Barros, Tiago S. da Silva, André C.P.L.F. de Carvalho ICMC-USP, Sao Carlos - SP, Brazil
{rcbarros,tiago.silva,andre}@icmc.usp.br
ABSTRACT
1.
Software effort prediction is an important task within software engineering. In particular, machine learning algorithms have been widely-employed to this task, bearing in mind their capability of providing accurate predictive models for the analysis of project stakeholders. Nevertheless, none of these algorithms has become the de facto standard for metrics prediction given the particularities of different software projects. Among these intelligent strategies, decision trees and evolutionary algorithms have been continuously employed for software metrics prediction, though mostly independent from each other. A recent work has proposed evolving decision trees through an evolutionary algorithm, and applying the resulting tree in the context of software maintenance effort prediction. In this paper, we raise the search-space level of an evolutionary algorithm by proposing the evolution of a decision-tree algorithm instead of the decision tree itself — an approach known as hyper-heuristic. Our findings show that the decision-tree algorithm automatically generated by a hyper-heuristic is capable of statistically outperforming state-of-the-art top-down and evolution-based decision-tree algorithms, as well as traditional logistic regression. The ability of generating a highly-accurate comprehensible predictive model is crucial in software projects, considering that it allows the stakeholder to properly manage the team’s resources with an improved confidence in the model predictions.
The importance of properly estimating software metrics within software development and maintenance projects is indisputable. Software effort is probably the most important metric to be predicted, given its direct relation to the overall cost figures of the project. Correctly predicting software effort leads to a balanced allocation of resources and more realistic cost estimates. However, if effort is underestimated, the assigned team will suffer intense pressure to rapidly finalize the product, eventually leading to a product that is not fully functional or sufficiently tested. Conversely, if effort is overestimated, a large amount of resources will be committed to the project, resulting in unnecessary (and perhaps prohibitive) costs. The need for accurate software estimates has motivated the investigation of many different strategies for providing efficient and effective predictive models. Many researchers addressed the problem by looking for strategies that could be eventually generalized for similar software projects. Specifically regarding software effort, the strategy employed in most of the cases involves the application of regression models for predicting continuous numeric values [7, 13, 27, 34,41], though it is not unusual to see the transformation of the effort figures into a discrete variable [9]. Regardless of the type of prediction, an important aspect in software effort estimation is concerned with model comprehensibility. A comprehensible or white-box model is a predictive graphical structure that allows the stakeholder to understand the reasons that lead to a particular prediction. Examples of comprehensible models are decision rules and decision trees. Conversely, black-box models are those that process historical data and produce the prediction without specifying or giving insight on the reasons that have led to a particular prediction. Classical examples of black-box models are artificial neural networks and SVMs. In this work, we propose the application of a comprehensible model for predicting software maintenance effort of a large software operation developed within a worldwide IT Company. The model at hand is a decision tree generated by an induction algorithm. What differs this study from other decision-tree applications in software engineering is the fact that the model is generated by an algorithm that was not manually-designed. Instead, we propose employing a decision-tree induction algorithm that has been automatically designed and tailored to the prediction of maintenance effort. The automatic generation of machine learning algorithms is a hot topic in the area of evolutionary computation
Categories and Subject Descriptors H.4 [Information Systems Applications]: Miscellaneous; D.2.8 [Software Engineering]: Metrics
Keywords software effort estimation, decision trees, evolutionary algorithms, hyper-heuristics, HEAD-DT.
Author’s copy. Please do not distribute.
INTRODUCTION
[4, 5, 35, 36], in which a hyper-heuristic evolutionary algorithm is responsible for evolving building blocks of known algorithms until it generates a new algorithm tailored to a particular domain. We expect this automatically-designed decision-tree induction algorithm to be capable of generating a highly-accurate comprehensible decision tree with significant performance gains over other well-known comprehensible approaches. We hope the results presented here can serve as basis and guidance for building predictive models through algorithms designed by hyper-heuristics, contributing with the state of the art in the subject. We also hope the issues we have faced will be addressed in similar future projects. This paper is organized as follows. In Section 2, we present a background with respect to evolutionary algorithms, and we review related work that employ evolutionary algorithms for improving software estimation models. Section 3 presents HEAD-DT, a hyper-heuristic evolutionary algorithm that automatically designs decision-tree induction algorithms [5]. Section 4 details the experimentation plan we have adopted for guiding our experiments, and Section 5 discusses the results of the experimental analysis, in which we compare our approach to logistic regression, and also to traditional and evolution-based decision-tree induction algorithms. We conclude the paper with some remarks on what we have achieved and also suggestions for future work.
2. BACKGROUND Evolutionary Algorithms (EAs) are a collection of optimization techniques whose design is based on metaphors of biological processes. Freitas [22] defines EAs as “stochastic search algorithms inspired by the process of neo-Darwinian evolution”. An EA maintains a population of individuals (chromosomes – set of genes), each of them a candidate solution to a given problem. Each individual is evaluated by a fitness function, which measures the quality of its corresponding candidate solution. Individuals evolve towards better and better individuals via a selection procedure based on natural selection, i.e., survival and reproduction of the fittest, and operators based on genetics, e.g., crossover and mutation. Hence, the better the quality of an individual, the higher the probability that its “genetic material” will be passed on to future individuals [21]. There are several kinds of EAs, such as Genetic Algorithms (GAs) and Genetic Programming (GP). GA emphasizes crossover as the main exploratory search operator and consider mutation as a minor operator, typically applied with a very low probability. According to Burgess [13], “GP is an extension of GA, which removes the restriction that the chromosome representing the individual has to be a fixed-length binary string”. Evolutionary algorithms often perform well approximating solutions to all types of problems because they ideally do not make any assumption about the underlying fitness landscape; this generality is shown by successes in fields as diverse as engineering, art, biology, economics, marketing, genetics, operations research, robotics, social sciences, physics, politics and chemistry.
2.1 Evolutionary Algorithms and Software Metrics We have searched for papers that employ either GA or GP for improving software estimation, and verified which kinds
of models are induced, as well as the predictive performance of these models and whether they are comprehensible to the potential stakeholders. Among the relevant papers which employ GP to estimate effort (or cost), [13] and [27] propose approaches that produce linear regression models as outputs, whist the strategy presented in [41] employs GGGP (Grammar-Guided Genetic Programming) for deriving these expressions. Linear equations are fairly comprehensible models [13, 27], especially when they are of reduced size. Notwithstanding, the models generated for predicting effort in [13, 27] are not short of problems, since the improvement detected by the authors was heavily dependent on the metric used for evaluating the results. The GGGP-based expressions [41], on the other hand, presented significant improvement over the traditional linear and logistic regression, but at the expense of comprehensibility, since the strategy produced highly-complex models, which were hard to be understood by stakeholders. Among the papers that employ GA in the context of software metrics, [24] and [34] make use of GA as a strategy for selecting and weighting attributes for software effort prediction. The first uses Grey Relational Analysis (GRA) as the method to be optimized by GA, and the second makes use of Ridge Regression (RR). Even though both papers report gains with their respective approaches, the authors did not seem to be concerned with the comprehensibility of the induced models. The work of Sheta [42] presents an approach that employs a GA to estimate the COCOMO parameters, and proposes two new extensions of the original COCOMO, whose parameters are also optimized by a GA. The author states that his work presents a significant improvement over the original COCOMO strategy. The work of Mantere and Alander [28] focuses on the use of evolutionary algorithms in software testing. It is a review of the application of evolutionary computation to software engineering, and the authors make a detailed discussion regarding the use of GA in software testing. The work of Aguilar et al. [1] employs a GA to evolve a set of decision rules for software effort prediction. The authors compare their findings with the well-known decision-tree system C4.5 [40], reporting an improvement in accuracy. In Basgalupp et al. [9], the authors propose evolving decision trees instead of decision rules for software maintenance prediction. The latter two studies, whereas highly related to our proposed approach, present a fundamental difference: they evolve individuals in a search within the solution space (decision trees or decision rules). In this work, we propose working in a different search space: instead of searching among candidates in the solution space (the space of all possible decision trees), we search for candidates in the heuristic space (the space of all possible decision-tree induction algorithms). To the best of our knowledge, this is the first work to employ a hyper-heuristic evolutionary algorithm for evolving decision-tree induction algorithms tailored to software metrics prediction. It innovates in searching for the most suitable algorithm for generating a highly-accurate comprehensible decision tree for this particular problem. As an additional contribution, we show that our approach improves not only the accuracy but also the comprehensibility of the models produced, when compared to traditional decision-tree induction algorithms and also
to an evolution-based strategy for evolving decision trees. Moreover, we show that our results are statistically significant based on a well-known statistical test. Next, we present HEAD-DT, which is the hyper-heuristic evolutionary algorithm capable of automatically designing top-down decision-tree induction algorithms.
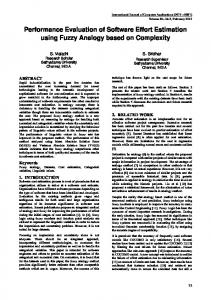
3. HEAD-DT HEAD-DT is the short for Hyper-heuristic Evolutionary Algorithm for automatically Designing Decision-Tree induction algorithms [5]. As the name says, it is a hyper-heuristic algorithm that designs decision-tree algorithms. Hyper-heuristics are search methods that automatically select and combine simpler heuristics, creating a generic heuristic that is used to solve any instance of a given target type of optimization problem. Hence, hyper-heuristics search in the space of heuristics, instead of searching in the problem solution space [33], raising the level of generality of the produced solutions. In HEAD-DT, individuals are collections of building blocks, i.e., components of decision-tree algorithms. Each individual is encoded as an integer vector, and each gene has a different range of supported values. We divided the genes in four categories that represent the major building blocks of a decision-tree algorithm: (i) split genes; (ii) stopping criteria genes; (iii) missing values genes; and (iv) pruning genes. Figure 1 presents this rationale. Each gene is better explained in the next sub-sections.
3.1 Split Genes These genes are concerned with the task of selecting the attribute to split the data in the current node of the decision tree. A decision rule based on the selected attribute is thus generated, and the input data is filtered according to the outcomes of this rule, and the process continues recursively. We have used two genes to model the split component of a DT algorithm. The first gene, criterion, is an integer that indexes one of the 15 splitting criteria we have implemented: information gain [37], Gini index [12], global mutual information [23], G statistics [30], Mantaras criterion [19], hypergeometric distribution [29], Chandra-Varghese criterion [16], DCSM [15], χ2 [31], mean posterior improvement [43], normalized gain [26], orthogonal criterion [20], twoing [12], CAIR [17] and gain ratio [40]. The second gene used to model the split component of a DT algorithm is binary split, which is a binary gene that indicates whether the splits of a DT are going to be necessarily binary or perhaps multi-way. In a binary tree, every split has only two outcomes, which means that nominal attributes with many categories will be divided in two subsets, each representing an aggregation over several categories. In a multi-way tree, nominal attributes are divided according to their number of categories, i.e., one edge (outcome) for each category. In both cases, numeric attributes always partition the tree in two subsets, (≤ threshold and > threshold).
3.2 Stopping Criteria Genes The second category of genes is related to the stopping criteria component of DT algorithms. The top-down induction of a DT is recursive and it continues until a stopping criterion (also known as pre-pruning) is satisfied. We have implemented the following stopping criteria:
Figure 1: Linear-genome for evolving decision-tree algorithms. • Reaching class homogeneity: when all instances that reach a given node belong to the same class, there is no reason to split this node any further. This strategy can be combined with any of the following strategies; • Reaching the maximum tree depth: a parameter tree depth can be specified to avoid deep trees. We have fixed its range in the interval [2, 10] levels; • Reaching the minimum number of instances for a non-terminal node: a parameter minimum number of instances for a non-terminal node can be specified to avoid (or at least alleviate) the data fragmentation problem in DTs. Range: [1, 20] instances; • Reaching the minimum percentage of instances for a non-terminal node: same as above, but instead of the actual number of instances, we set the minimum percentage of instances. The parameter is thus relative to the total number of instances in a data set. Range: [1%, 10%] the total number of instances ; • Reaching an accuracy threshold within a node: a parameter accuracy reached can be specified for halting the growth of the tree when the accuracy within a node (majority of instances) has reached a given threshold. Range: {70%, 75%, 80%, 85%, 90%, 95%, 99%}. The first gene, criterion, selects among the five different strategies for stopping the tree growth. The second gene, parameter, dynamically adjusts a value in the range [0, 100] to the corresponding strategy.
3.3
Missing Values Genes
Handling missing values is an important task in decision tree induction. Missing values can be an issue during tree induction and also during classification. During tree induction, there are two moments in which we need to deal with missing values: splitting criterion evaluation (split gene) and instances distribution (distribution gene). During the split criterion evaluation in node t based on attribute ai , we implemented the strategies: (i) ignore all instances whose value of ai is missing [12]; (ii) imputation of missing values with either the mode (nominal attributes) or the mean/median (numeric attributes) of all instances in t [18]; (iii) weight the splitting criterion value (calculated in node t with regard to ai ) by the proportion of missing values [39]; and (iv) imputation of missing values with either the mode (nominal attributes) or the mean/median (numeric
individuals algorithm
compute fitness
the evolutionary approach followed by HEAD-DT. 5 Figure 0 4 2: 90An 2 example 7 1 3of10 - code line 1 - code line 2 - ...
algorithm
compute fitness
...
...
...
line 1 attributes) of all14 instances is the-- code 20 1 2 in 10t whose 4 5 class 3 1attribute code line 2 percentage of training data to be used in the pruning set - ... same of the instance whose ai value is being imputed. (varying within the interval [10%, 50%]). For PEP, the For deciding which child node training instance xj should parameter is the number of standard errors (SEs) to adjust algorithm go to, considering a split in node t over ai , we adopted the- code line 1 the apparent error, in the set {0.5, 1, 1.5, 2}. For MEP, the - code line 2 8 0 1 4 1 1 2 2 5 options: (i) ignore instance xj [37]; (ii) treat instance xj- ... parameter m may range within [0, 100]. For CCP, there as if it has the most common value of ai (mode or mean), are two parameters: the number of SEs (in the same range meta-training Evolution regardless of the class [39]; (iii) treat instance xj as if it has than PEP) and the pruning set size (in the same range than - selection the most common value of ai (mode or mean) considering the REP). Finally, for EBP, the parameter CF may vary within - crossover algorithm - mutation instances that belong to the same class than xj ; (iv) assign [1%, 50%]. 1. Recursively split nodes with the G statistics criterion; Create one edge for each category in a nominal split; instance xj to all partitions; (v) assign instance xj to 2.the 3. Perform step 1 until class-homogeneity or the maximum 3.5 Process partition with largest number of instances [39]; (vi) weight tree depth of 7 levels ((77 modEvolutionary 9) + 2) is reached; 4. Perform MEP pruning with m = 91; besttoindividual instance xj according the partition probability [40]; and HEAD-DT is a regular generational EA. The initial 5. When dealing with missing values: 5.1. Impute missing values with mode/mean during split (vii) assign instance population is created by randomly choosing values within 4 1xj 2to77the3 most 91 2probable 5 1 partition, calculation; considering the class of xj . 5.2. Distribute missing-valued instances the partitiongene. the range ofto each For guiding the search for the with the largest number of instances; Finally, for classifying (classification gene) an unseen near-optimal solution, we have defined the fitness function 5.3. For classifying an instance, explore all branches and meta-test test instance xj , considering a split in node t over ai , combine we the results; of HEAD-DT to be the accuracy of the decision tree used the strategies: (i) explore all branches of t combining generated by the evolved algorithms. In order to avoid the results [38]; (ii) take the route to the most probable overfitting issues, we have divided the training data set in partition (largest subset); (iii) halt the classification process two subsets: sub-training (75%) and validation (25%) sets. and assign instance xj to the majority class of node t [39]. The sub-training set is used so the evolved algorithm can generate a decision-tree at each generation of the EA. The validation set is used to assess the relative performance of 3.4 Pruning Genes the algorithm in the training data, and hence the accuracy Pruning is usually performed in decision trees for obtained in the validation set is used as fitness function for enhancing tree comprehensibility by reducing its size while guiding the evolutionary search. At the end of each run, the maintaining (or even improving) accuracy. It was originally best individual (algorithm) is selected for inducing a decision conceived as a strategy for tolerating noisy data, though tree from the test data set. Figure 2 depicts this rationale. it was found to improve decision tree accuracy in many noisy data sets [12, 37, 38]. We have implemented the 4. EXPERIMENTAL PLAN following well-known pruning strategies: i) reduced-error pruning (REP) [38]; ii) pessimistic error pruning (PEP) [38]; The experimental analysis was conducted within the iii) minimum error pruning (MEP) [14]; iv) cost-complexity largest software maintenance project of Hewlett-Packard pruning (CCP) [12]; and v) error-based pruning (EBP) [40]. Enterprise Application Services (HP-EAS) Brazil, a CMMI We designed two genes in HEAD-DT for pruning. The level 3 certified operation. The company keeps a central first gene, method, indexes one of the five approaches for data repository for all its projects, as recommended in pruning a DT (and also the option of not pruning at all). [25]. This repository is meant to support the high-level The second gene, parameter, is in the range [0, 100] and managers, assisting their decision-making process, and it is its value is dynamically mapped by a function, according further detailed in [11]. For reasons of confidentiality, the to the pruning method selected (similar to the stopping project’s name and all classified information were changed criteria parameter gene). For REP, the parameter is the or suppressed in the following description. compute fitness
Project P1 is a continuous maintenance project that inserts, modifies and removes functionalities in a software product previously developed by the company. The software product is divided into versions, where each version corresponds to a single iteration in the maintenance lifecycle. An iteration must deliver a number of labor-hours/month to the client and may have one or more product releases. Each Service Order (SO) aggregates a set of change requirements for the product. Project P1’s teams are composed by a design team, a client developers team, a server developers team and a testers team. It has three types of requirement documents: (1) Design Requirements, (2) Server Requirements, and (3) Interface/Client Requirements. We observed that project P1 uses a classic waterfall lifecycle. Some tools are used to support the team’s activities during the lifecycle. MS-Project Server is used to schedule the activities planned in the project. IBM-ClearQuest is used to defects control and IBM-RequisitePro manages all the requirements presented in an SO. The effort spent by each team associated to address a task is recorded using a locally-developed software tool. Finally, the estimation strategy of the Company for this particular project is based on the expert judgment only.
4.1 Data Pre-Processing The granularity level of data in the organizational repository does not allow its use to estimate work effort for each requirement, since such data are summarized by phase and version, in an approach that disposes of important project details. Hence, we had to access directly the data sources of the tools adopted by the project. We accessed the data repository from ClearQuest, RequisitePro, and the locally-developed software tool, so as to retrieve the following SO information: (i) adjusted function-points for each SO; (ii) size of a SO in thousands of lines of code; (iii) number of requirement documents for each SO; (iv) whether there were previously performed test-cases; (v) baseline schedule; and (vi) actual effort of each SO in hours; Considering the information above, we have created a SO data set consisting of 1522 instances, each instance representing a unique SO of project P1, and 18 attributes. We encountered a couple of problems with this data set. First, we have identified quality problems with data prior to 2006. That is because until 2006, the metrics collection process was not automated, generating data distortions and many attributes with missing values. Thus, we have deleted all instances that dated of years that preceded 2006. In addition, we have also identified instances with missing values of work effort. These instances, for no apparent reason, did not contain the values of effort for a given SO, even though such a SO was already terminated. Therefore, we have deleted these instances, because they can no longer aggregate significance in the building of a prediction model. After this data cleaning process, we have ended up with 561 instances. Since our target attribute (work effort) is measured in hours, we need to transform its values from numeric to nominal in order to create a classification problem (instead of a regression problem). For that, we divided the data so the class values were equally distributed among the classes. The classes created were: low effort (less than 18 hours), medium effort (between 18 and 67 hours) and high effort (more than 67 hours). The class distribution
is 188 instances classified as low, 187 classified as medium and 186 instances classified as high effort.
4.2
Parameter Settings
HEAD-DT is configured with the following parameters: • 100 individuals composing the population; • a maximum number of 100 generation; • tournament selection with size t = 2; • elitism with 10 individuals; • one-point crossover with 90% probability; and • random uniform gene mutation with 10% probability. These parameters were empirically tested in non-exhaustive previous experiments. Parameter optimization is a topic left for future research. We have run HEAD-DT over the SO data set in order to obtain a decision-tree induction algorithm tailored to software maintenance effort data. We compared the results provided by the algorithm generated by HEAD-DT to a logistic regression method, as well as to traditional decision-tree induction algorithms, namely J48 and SimpleCART (versions of C4.5 [40] and CART [12] available at the open-source machine learning tool Weka [44]), to BFTree, also available at Weka, and finally to LEGAL-Tree [8, 10], an evolutionary decision-tree induction algorithm. LEGAL-Tree was shown to be an excellent choice for predicting software maintenance effort, as detailed in [9]. We have used the default parameter settings for all baseline algorithms. For validating the results, we follow a 10-fold cross-validation procedure using the exact same data subsets (training, validation and test sets) for all algorithms, allowing a far comparison among the methods. We collected the following evaluation measures: classification accuracy, F-Measure, recall, precision, and tree size. Due to the fact that both LEGAL-Tree and HEAD-DT are non-deterministic techniques, we executed them 30 times for each of the 10 training/test set folds generated by the 10-fold cross-validation procedure. Then, we calculated the average and standard deviation of the 30 executions for each fold, and then the average of the ten folds. Considering the other methods, we calculated the averages and standard deviations for the ten folds, since these algorithms are deterministic. For assessing the validity and non-randomness of the experimental results, we employed the corrected paired t-test [32] with a significance level of α = 0.10 and 9 degrees of freedom (k − 1 folds). The null hypothesis is that the algorithms achieve the same performance.
5.
RESULTS AND DISCUSSION
Table 1 presents the results for logistic regression and the decision-tree induction algorithms employed in the experiment (J48, CART, BFTree, LEGAL-Tree), as well as the results generated by the algorithm that was automatically-designed by HEAD-DT. Since logistic regression does not generate a tree, we do not present its corresponding tree size values.
Table 1: Accuracy, F-Measure, Precision, Recall, and Tree Size of the baseline algorithms and HEAD-DT. Average and standard deviations are shown. Accuracy F-Measure Precision Recall Tree Size
Logistic Regression
J48
CART
BFTree
LEGAL-Tree
HEAD-DT
0.61 ± 0.01 0.61 ± 0.01 0.63 ± 0.01 0.61 ± 0.01 —————
0.62 ± 0.00 0.61 ± 0.00 0.63 ± 0.00 0.62 ± 0.00 39.10 ± 160.32
0.58 ± 0.00 0.58 ± 0.00 0.61 ± 0.01 0.58 ± 0.00 55.40 ± 1133.16
0.59 ± 0.00 0.59 ± 0.00 0.61 ± 0.00 0.59 ± 0.00 84.80 ± 788.84
0.64 ± 0.07 0.63 ± 0.08 0.65 ± 0.08 0.64 ± 0.07 12.91 ± 0.94
0.69 ± 0.08 0.68 ± 0.08 0.69 ± 0.08 0.69 ± 0.08 19.5 ± 11.21
Regarding the absolute values, we can observe that the algorithm designed by the hyper-heuristic (HEAD-DT) outperformed all other methods considering every collected measure — except for tree size, whose smallest value was obtained by LEGAL-Tree. Therefore, HEAD-DT does seem to be the most accurate model among the set of algorithms. In order to confirm this assumption with statistical significance, we executed the corrected paired t-test [32], which is suggested for scenarios in which there is a single data set to be analyzed. Table 2 presents the corrected paired t-test results.
Algorithm 1: Algorithm designed by HEAD-DT and tailored to the available maintenance effort data. 1 2 3 4
1 2 3
Recursively split nodes with the Orthogonal criterion; Divide nominal splits according to number of attribute categories; Perform step 1 until class-homogeneity or the minimum number of 17 instances is reached; Perform REP pruning with 2 folds When dealing with missing values: Ignore missing values during the split Distribute the instances by ignoring those with missing values For classifying an instance with missing values, explore all branches and combine the results.
Table 2: T-test pairwise comparison results.
LEGAL-Tree
HEAD-DT
Accuracy F-Measure Precision Recall Tree Size Accuracy F-Measure Precision Recall Tree Size
J48 — — — — ▲ ▲ ▲ — ▲ ▲
Cart ▲ ▲ — ▲ ▲ ▲ ▲ ▲ ▲ ▲
BFTree ▲ ▲ — ▲ ▲ ▲ ▲ ▲ ▲ ▲
Logistic — — — — ▲ ▲ ▲ ▲
▲ → the algorithm in the row outperforms the algorithm in the column with statistical significance at a 90% confidence level. — → there is no significant difference between the algorithm in the row and the algorithm in the column.
The corrected paired t-test did not found any statistically significant difference between HEAD-DT and LEGAL-Tree for any evaluation measure. Therefore, we present both HEAD-DT and LEGAL-Tree in the rows of Table 2, allowing for a pairwise comparison between them and the remaining algorithms. By analyzing Table 2, observe that both HEAD-DT and LEGAL-Tree outperform BFTree and SimpleCart with statistical significance in terms of accuracy, F-Measure and recall, though only HEAD-DT outperforms these methods in terms of precision. In addition, HEAD-DT significantly outperforms logistic regression in every single evaluation measure (recall that tree size values are not available to logistic regression, since it does not generate a decision tree). We believe these results are sufficient to show that an algorithm automatically designed by the hyper-heuristic HEAD-DT is capable of generating highly-accurate comprehensible models, more so than logistic regression and any state-of-the-art decision-tree induction algorithm. The importance of comprehensible predictive models in software effort prediction has been stated extensively in the literature. By analyzing a comprehensible (and accurate) decision tree, the stakeholder can make informed decisions on proper resource allocation for the development of new maintenance SOs, ultimately avoiding unrealistic cost estimates.
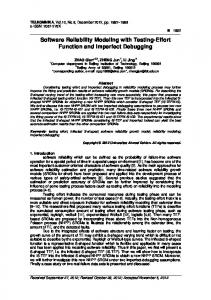
The fact that LEGAL-Tree generates smaller trees than the algorithm designed by HEAD-DT should not be a concern, since smaller trees are only preferable in scenarios where the predictive performance of the algorithms is similar. The analysis previously presented clearly indicates that HEAD-DT generates algorithms whose trees outperform LEGAL-Tree regarding predictive performance (accuracy, F-Measure, prediction, and recall). The Occam’s razor assumption that among competitive hypotheses, the simpler is preferred, does not apply in this case. The algorithm designed by HEAD-DT tailored to the maintenance effort data is presented in Algorithm 1. It combines unorthodox components such as the Orthogonal criterion [20] and REP pruning. The main advantage of HEAD-DT is that it automatically searches for the suitable components (with their own biases) according to the data set being investigated. It is hard to believe that a researcher would combine such a distinct set of components as those presented in Algorithm 1 to achieve an algorithm tailored to this data set. The automatically-designed algorithm is a single option among around 170 million algorithms which can be evolved by the hyper-heuristic HEAD-DT. Figure 3 shows the decision tree induced by Algorithm 1. Note that decision trees are quite easy to understand, even for those stakeholders that are not familiar with machine learning and data mining. The decision tree presented in Figure 3 is quite intuitive and provides interesting insight to project managers. For instance, it states that SOs with more than 5 requirement documents will necessarily take a long time to be developed (high effort). On the other hand, SOs with less than 5 requirement documents need to be further analyzed with respect to the number of adjusted function points calculated for them. A precise threshold of 1.77 adjusted function points indicate whether a SO will be classified as low effort or medium effort. This rule is also intuitive, and increases the confidence of the project manager in the classification of new SOs whose effort to be developed is unknown.
#DOC 5.5 HIGH
AFP 1.77 MEDIUM
Figure 3: Decision tree generated by Algorithm 1, which was automatically designed by HEAD-DT. Attributes selected by the tree are #DOC (number of requirement documents) and AFP (adjusted function points).
We conclude by reinforcing the importance of a comprehensible predictive model for stakeholders regarding their decision-making process. A comprehensible model allows the stakeholder to create new hypotheses regarding the available data — for instance, the project manager can assume that the requirement documents are crucial in determining the total effort to develop a SO, and thus he/she may work towards increasing the level of detail of these documents within the software operation. Moreover, by visually inspecting whether the predictive model produces logical rules — e.g., more documents and adjusted function points necessarily mean more effort —, the project manager can detect possible errors in the model that are a result of a poor data collection process. Therefore, he/she can act towards improving the data collection process, suggesting new guidelines or even software tools for performing the collection and data pre-processing tasks.
6. CONCLUSIONS In this paper, we proposed the application of a hyper-heuristic evolutionary algorithm called HEAD-DT for designing a decision-tree algorithm tailored to maintenance effort data provided by a worldwide IT Company. To the best of our knowledge, this was the first work to employ a hyper-heuristic evolutionary algorithm for evolving decision-tree induction algorithms tailored to software metrics prediction. This work innovates by employing an algorithm that searches for the most suitable decision-tree algorithm for generating a highly-accurate comprehensible decision tree. In an experiment that involved more than 5 years of collected data from an IT Company maintenance project, we showed that the automatically-designed algorithm is capable of generating a predictive model that outperforms those generated by traditional and evolution-based decision-tree algorithms. In addition, the generated model also outperformed the well-known logistic regression strategy, which is widely-used in software metrics prediction. The performance gain was often statistically significant according to a largely-employed statistical test. We believe our findings indicate the applicability of hyper-heuristics in the context of software effort prediction. Moreover, considering the increasing growth in the
7.
ACKNOWLEDGMENTS
The authors would like to thank Funda o de Amparo Pesquisa do Estado de S o Paulo (FAPESP), and Conselho Nacional de Desenvolvimento Cient fico e Tecnol gico (CNPq) for funding this research. In addition, the authors would like to acknowledge Dr. Duncan A. Ruiz and HP-EAS Porto Alegre, for providing all data employed in this paper.
8.
REFERENCES
[1] J. S. Aguilar-Ruiz, I. Ramos, J. C. Riquelme, and M. Toro. An evolutionary approach to estimating software development projects. Information and Software Technology, 43(14):875 – 882, 2001. [2] R. Barros, M. Basgalupp, D. Ruiz, A. Carvalho, and A. Freitas. Evolutionary model tree induction. In 2010 ACM SAC, pages 1131–1137, 2010. [3] R. C. Barros, M. Basgalupp, A. de Carvalho, and A. Freitas. A survey of evolutionary algorithms for decision-tree induction. Systems, Man, and Cybernetics, Part C: Applications and Reviews, IEEE Transactions on, 42(3):291 –312, may 2012. [4] R. C. Barros, M. P. Basgalupp, A. C. de Carvalho, and A. A. Freitas. Towards the automatic design of decision tree induction algorithms. In Proceedings of the 13th annual conference companion on Genetic and evolutionary computation, GECCO ’11, pages 567–574, New York, NY, USA, 2011. ACM. [5] R. C. Barros, M. P. Basgalupp, A. C. de Carvalho, and A. A. Freitas. A hyper-heuristic evolutionary algorithm for automatically designing decision-tree algorithms. In Proceedings of the 14th International Conference on Genetic and Evolutionary Computation Conference, GECCO ’12, pages 1237–1244, New York, NY, USA, 2012. ACM. [6] R. C. Barros, D. D. Ruiz, and M. P. Basgalupp. Evolutionary model trees for handling continuous classes in machine learning. Information Sciences, 181:954–971, 2011. [7] R. C. Barros, D. D. Ruiz, N. N. Tenorio Jr., M. P. Basgalupp, and K. Becker. Issues on estimating software metrics in a large software operation. In Proceedings of the 32nd Annual IEEE Software Engineering Workshop, SEW ’08, pages 152–160, Washington, DC, USA, 2008. IEEE Computer Society. [8] M. Basgalupp, R. C. Barros, A. de Carvalho, A. Freitas, and D. Ruiz. Legal-tree: a lexicographic multi-objective genetic algorithm for decision tree induction. In 2009 ACM SAC, pages 1085–1090, 2009. [9] M. P. Basgalupp, R. C. Barros, and D. D. Ruiz. Predicting software maintenance effort through evolutionary-based decision trees. In Proceedings of the
[10]
[11]
[12]
[13]
[14]
[15]
[16]
[17]
[18] [19]
[20]
[21]
[22]
[23]
[24]
[25] [26]
27th Annual ACM Symposium on Applied Computing, pages 1209–1214, New York, NY, USA, 2012. ACM. M. P. Basgalupp, A. C. P. L. F. de Carvalho, R. C. Barros, D. D. Ruiz, and A. A. Freitas. Lexicographic multi-objective evolutionary induction of decision trees. International Journal of Bioinspired Computation, 1(1/2):105–117, 2009. K. Becker, D. D. Ruiz, V. S. Cunha, T. C. Novello, and F. Vieira e Souza. Spdw: A software development process performance data warehousing environment. In Proceedings of the 30th Annual IEEE/NASA Software Engineering Workshop, pages 107–118, Washington, DC, USA, 2006. IEEE Computer Society. L. Breiman, J. H. Friedman, R. A. Olshen, and C. J. Stone. Classification and Regression Trees. Wadsworth, 1984. C. J. Burgess and M. Lefley. Can genetic programming improve software effort estimation? a comparative evaluation. Information and Software Technology, 43(14):863 – 873, 2001. B. Cestnik and I. Bratko. On estimating probabilities in tree pruning. In EWSL’91, pages 138–150. Springer, 1991. B. Chandra, R. Kothari, and P. Paul. A new node splitting measure for decision tree construction. Pattern Recognition, 43(8):2725–2731, 2010. B. Chandra and P. P. Varghese. Moving towards efficient decision tree construction. Information Sciences, 179(8):1059–1069, 2009. J. Ching, A. Wong, and K. Chan. Class-dependent discretization for inductive learning from continuous and mixed-mode data. IEEE Transactions on Pattern Analysis and Machine Intelligence, 17(7):641–651, 1995. P. Clark and T. Niblett. The CN2 induction algorithm. Machine Learning, 3(4):261–283, 1989. R. L. De M´ antaras. A Distance-Based Attribute Selection Measure for Decision Tree Induction. Machine Learning, 6(1):81–92, 1991. U. Fayyad and K. Irani. The attribute selection problem in decision tree generation. In National Conference on Artificial Intelligence, pages 104–110, 1992. A. A. Freitas. Data Mining and Knowledge Discovery with Evolutionary Algorithms. Springer-Verlag New York, Inc., Secaucus, NJ, USA, 2002. A. A. Freitas. A review of evolutionary algorithms for data mining. In O. Maimon and L. Rokach, editors, Soft Computing for Knowledge Discovery and Data Mining, pages 79–111. Springer US, 2008. M. Gleser and M. Collen. Towards automated medical decisions. Computers and Biomedical Research, 5(2):180–189, 1972. S.-J. Huang, N.-H. Chiu, and L.-W. Chen. Integration of the grey relational analysis with genetic algorithm for software effort estimation. European Journal of Operational Research, 188(3):898–909, August 2008. S. E. Institute. Cmmi for development, version 1.3. Technical report, Carnegie Mellon, November 2010. B. Jun, C. Kim, Y.-Y. Song, and J. Kim. A New Criterion in Selection and Discretization of Attributes
[27]
[28]
[29]
[30]
[31]
[32]
[33]
[34]
[35]
[36]
[37] [38] [39]
[40] [41]
[42]
[43]
[44]
for the Generation of Decision Trees. IEEE Transactions on Pattern Analysis and Machine Intelligence, 19(2):1371–1375, 1997. M. Lefley and M. J. Shepperd. Using genetic programming to improve software effort estimation based on general data sets. Genetic and Evolutionary Computation GECCO2003, 2724(1):2477–2487, 2003. T. Mantere and J. T. Alander. Evolutionary software engineering, a review. Appl. Soft Comput., 5:315–331, March 2005. J. Martin. An exact probability metric for decision tree splitting and stopping. Machine Learning, 28(2):257–291, 1997. J. Mingers. Expert systems - rule induction with statistical data. Journal of the Operational Research Society, 38:39–47, 1987. J. Mingers. An empirical comparison of selection measures for decision-tree induction. Machine Learning, 3(4):319–342, 1989. C. Nadeau and Y. Bengio. Inference for the generalization error. Mach. Learn., 52(3):239–281, 2003. E. Nurke, M. Hyde, G. Kendall, and J. Woodward. A genetic programming hyper-heuristic approach for evolving 2-d strip packing heuristic. Evolutionary Computation, IEEE Transactions on, 14(6):942–958, dec. 2010. E. Papatheocharous, H. Papadopoulos, and A. S. Andreou. Software effort estimation with ridge regression and evolutionary attribute selection. CoRR, abs/1012.5754, 2010. G. L. Pappa and A. Freitas. Automating the Design of Data Mining Algorithms: An Evolutionary Computation Approach. Springer Publishing Company, Incorporated, 2009. G. L. Pappa and A. A. Freitas. Evolving rule induction algorithms with multi-objective grammar-based genetic programming. Knowledge and Information Systems, 19:283–309, 2009. J. R. Quinlan. Induction of decision trees. Machine Learning, 1(1):81–106, 1986. J. R. Quinlan. Simplifying decision trees. International Journal of Man-Machine Studies, 27:221–234, 1987. J. R. Quinlan. Unknown attribute values in induction. In 6th International Workshop on Machine Learning, pages 164–168, 1989. J. R. Quinlan. C4.5: programs for machine learning. Morgan Kaufmann, San Francisco, CA, USA, 1993. Y. Shan, R. I. Mckay, C. J. Lokan, and D. Essam. Software project effort estimation using genetic programming. In Proceedings of International Conference on Communications Circuits and Systems, pages 1108–1112. Press, 2002. A. F. Sheta. Estimation of the cocomo model parameters using genetic algorithms for nasa software projects. Journal of Computer Science, USA, pages 118–123, 2006. P. C. Taylor and B. W. Silverman. Block diagrams and splitting criteria for classification trees. Statistics and Computing, 3:147–161, 1993. I. H. Witten and E. Frank. Data Mining: Practical
Machine Learning Tools and Techniques with Java Implementations. Morgan Kaufmann, October 1999.