SOFTWARE WebGro: A Web-Based Soybean Management Decision Support System Joel O. Paz,* William D. Batchelor, and Palle Pedersen
Reproduced from Agronomy Journal. Published by American Society of Agronomy. All copyrights reserved.
ABSTRACT
than variety selection. For example, numerous studies have been published from the upper midwestern United States on the effect of crop rotation, row spacing, and plant population on soybean yield (Pedersen and Lauer, 2002, 2003a, 2003b). In the midwestern United States, water stress is often viewed as the biggest yield-limiting factor. However, other factors such as diseases, insects, and hail damage can also cause significant yield loss. Although herbicide injury has been shown to not significantly affect yield, it can contribute to yield loss if other stresses are present (Browde et al., 1994). Producers can use management to alter the effect of interactive stresses. Variety selection can be used to reduce the impacts of diseases while irrigation can reduce the effects of water stress. However, it is often difficult to understand these complex interactions and to determine how much each factor may affect soybean yield because of the magnitude of compensatory growth and alterations in plant development (Pedersen and Lauer, 2004). Crop models such as CROPGRO (Hoogenboom et al., 1994) have been used as a research tool to study different interactions and to estimate the effects of different factors on soybean yield (Batchelor et al., 1993; Paz et al., 2001; Pinnschmidt et al., 1995). CROPGRO is a process-oriented soybean model that simulates growth and development on a daily basis using C, N, and water balance principles. The model computes daily photosynthesis based on temperature, water stress, and light interception. Daily C is then partitioned to leaf, stem, root, pod, and seed pools based on the crop growth stage and C supply–demand principles. Development rate is simulated each day based on temperature and daylength. Soil water content is computed in different soil layers each day using a water balance approach, and water stress is computed based on the limitation of potential root water uptake and evaporative demand. Batchelor et al. (1993) added modules to incorporate the effect of many different types of pest damages on different state and rate variables in the model. Researchers have used crop models for many years but have had limited success in packaging these complex models in a framework that makes them easy for producers to use. Intensive input requirements and the problem of data entry and selection have prompted researchers to develop decision support systems (DSS) and smarter, more intuitive user interfaces to different crop growth models. Decision support systems provide
WebGro is a web-based soybean [Glycine max (L.) Merr.] decision support system built on the CROPGRO-Soybean model. The purpose of WebGro is to help soybean producers in the midwestern United States understand how different stresses interact to limit soybean yield in their fields. Stresses include water, soybean cyst nematode (Heterodera glycines), herbicide injury, Rhizoctonia root rot disease (Rhizoctonia solani), and hail damage. The user can set up a field scenario by selecting cultivar, planting date, plant population, soil type, and the nearest weather station using a web form. Different stress levels can then be entered, and the model can be run interactively by simulating the effects of one or more stresses at a time. A summary table of model simulations is generated and presented onscreen allowing users to examine individual and combined effects of plant stresses. The results are stored on the server, thus allowing the users to view these results in another session. WebGro also offers interactive graphical output that lets users view daily changes in soybean biomass weight for a specific field or scenario. WebGro is available at http:// webgro.ae.iastate.edu.
S
oybean yield is the result of complex interactions among genetics, environment, and management decisions and is correlated with the number of seeds and seed size (Salado-Navarro et al., 1986). Sinclair (2004) theorized that the maximum soybean grain yield was probably no greater than 7.3 to 8.0 Mg ha⫺1. This genetic yield potential is obtained only when environmental conditions are perfect, but such conditions rarely exist. In a field situation, soil and climate provide the major portion of the environmental influence on soybean development and yield (Pedersen and Lauer, 2003b). The combined environmental constraints such as temperature, solar radiation, and available water define rigorous limits to crop biomass accumulation and consequently grain yield. A specific variety may vary in grain yield from year to year, even within the same field, indicating that some varieties are better adapted to a specific environment than others. It is not unusual for one variety to outyield another variety by 1 to 1.5 Mg ha⫺1 or more in the same field. Producers will therefore select varieties that are yield stable within a region across locations and years to get more accurate information on specific variety performance and stability. Producers can also help to optimize yield by proven managerial decisions other J.O. Paz and W.D. Batchelor, Dep. of Agric. and Biosyst. Eng., Davidson Hall, and P. Pedersen, Dep. of Agron., Agronomy Hall, Iowa State Univ., Ames, IA 50010. Received 25 Mar. 2004. *Corresponding author (
[email protected]).
Abbreviations: API, application programming interface; ASP, active server pages; DSS, decision support system(s); GUI, graphical user interface; ODBC, open database connectivity; SCN, soybean cyst nematode; VBscript, Visual Basic script.
Published in Agron. J. 96:1771–1779 (2004). © American Society of Agronomy 677 S. Segoe Rd., Madison, WI 53711 USA
1771
1772
AGRONOMY JOURNAL, VOL. 96, NOVEMBER–DECEMBER 2004
Reproduced from Agronomy Journal. Published by American Society of Agronomy. All copyrights reserved.
Table 1. Components of the web-based soybean yield simulation model. Crop model
CROPGRO-Soybean model
Database server Database manager ODBC† driver Application server Web server OS‡ platform
MySQL 4.0 MySQL-Front 2.5 MyODBC 3.51 active server pages Internet Information Services (IIS) 5.0 Windows 2000 Server Edition
† ODBC, open database connectivity. ‡ OS, operating system.
a framework to package models and other information into user-friendly tools that producers can use. A DSS is a computer-based system that supports choice by assisting the decision-maker in organizing information and simulation outcomes. A DSS helps with formulating alternatives, accessing data, running models, and displaying and interpreting their results (Sauter, 1997). PCYield (Welch et al., 2002) is an example of a PCbased graphical user interface (GUI) designed to facilitate data input and use of the CROPGRO model. The system uses the CROPGRO-Soybean model as its core
simulation engine; has a simple, targeted GUI allowing users to enter field-specific management information; and provides production risk indicators based on the impacts of different environmental stresses on soybean yield. PCYield requires Internet access for downloading weather data used in model simulations. Web-based applications provide an efficient and powerful avenue for delivering interactive tools to users. Pan et al. (2000) developed a web-based object-oriented plant growth simulator called OWSimu. The program can simulate plant growth for more than a dozen crops and weeds under Illinois weather and three typical soil conditions. It is designed as a research and educational tool to use in the general study of plant growth. The dynamic information delivery capabilities of the Internet have spawned the development of web applications including web-based DSS targeted at providing information and empowering users. Examples of these systems include mapping capabilities for forage species selection (Miller et al., 2002) and delineation of watersheds for hydrologic and water quality assessment (Choi et al., 2002).
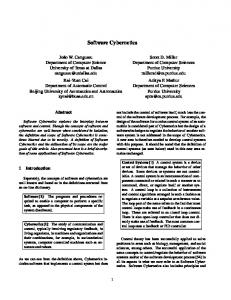
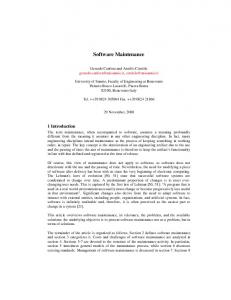
Fig. 1. Using an Internet browser to access the WebGro site (http://webgro.ae.iastate.edu).
PAZ ET AL.: WEBGRO—A WEB-BASED SOYBEAN MANAGEMENT DECISION SUPPORT SYSTEM
1773
Reproduced from Agronomy Journal. Published by American Society of Agronomy. All copyrights reserved.
This paper describes the components and implementation of a web-based soybean DSS built on the CROPGRO soybean growth model. The purpose of WebGro is to help soybean producers in the midwestern United States understand how different stresses interact to limit soybean yield in their fields.
SYSTEM DESIGN A web-based soybean DSS called WebGro was developed to allow users to examine the effects of different factors on soybean growth and development and to assist producers in improving their management decisions. The components of the system are listed in Table 1. Using web data forms, specific soybean field information is collected and used in the crop model to simulate the effects of individual or multiple stresses on soybean yield on a producer’s field. The system provides dynamic web pages allowing interaction between the user, the crop growth model, and the database. The system does not require any special skills or capabilities on the part of the user beyond the knowledge of using Internet browser software such as Internet Explorer and Netscape. Users who have access to the Internet can run WebGro by pointing their web browsers to http://webgro.ae.iastate.edu (verified 20 Aug. 2004) (Fig. 1).
Crop Model WebGro was built on a crop model, CROPGROSoybean, that simulates soybean growth, development, and yield on homogeneous soil types. The model requires inputs including management practices (variety, row spacing, plant population, fertilizer and irrigation application dates and amounts) and environmental conditions (soil type, daily maximum and minimum temperature, rainfall, and solar radiation). From this information, daily growth of vegetative, reproductive, and root components are computed as a function of daily photosynthesis, growth stage, and water and N stress. Soil moisture and N balance models are used to compute water and nitrate levels in the soil as a function of rainfall- and soil moisture–holding properties. The crop model’s modular structure is one of its strengths in that it allows for new routines or modules to be coupled to the model. For example, Batchelor et al. (1993) extended the use of CROPGRO model to study pest damage by using a generic set of pest coupling points, which allow for the simulation of different types of pests. Fallick et al. (2002) developed methods to simulate soybean cyst nematode (SCN) damage on soybean and coupled these to the CROPGRO-Soybean model. WebGro provides users with a tool to examine the effect of different plant stresses on soybean yield. These include water stress, SCN, herbicide injury, hail damage, and Rhizoctonia root rot. Water stress is the dominant factor affecting soybean yield (Paz et al., 1998). Soybean cyst nematode is the single most damaging pest of soybean in the United States and is responsible for significant economic losses in soybean production (Wrather et al., 1997). Hailstorms are common occurrences in the Midwest and account for substantial yield loss. Rhizoc-
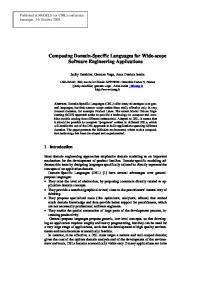
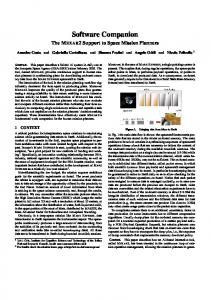
Fig. 2. Typical soybean yield response curves as affected by different levels of soybean cyst nematode (SCN; left chart) and Rhizoctonia root rot (right chart) levels. Data from Tables 3 (SCN) and 4 (Rhizoctonia root rot) were used to create these charts.
tonia root rot and herbicide injury are the other plant stresses that can reduce soybean yield and are included in WebGro. Figure 2 provides an example of the yield curves generated using simulated yields in WebGro and the effect of different levels of SCN and Rhizoctonia root level.
Web Application Development and Database The WebGro system uses the Internet Information Services (IIS) version 5 (Microsoft, 2000a) as web-server platform, which is built in Windows 2000 (Microsoft, 2000b) and utilizes active server pages (ASP) to provide interactive and dynamic web pages. Active server pages are server-side scripting environments developed by Microsoft that enable users to combine HTML, server-side scripting, and database connectivity to create interactive and dynamic web applications (Anderson et al., 2000). They also provide a collection of objects and components, which facilitate interaction between the web server and the browser. Data collected from the user are stored in a database server called MySQL (MySQL AB, 2003). In addition,
1774
AGRONOMY JOURNAL, VOL. 96, NOVEMBER–DECEMBER 2004
Reproduced from Agronomy Journal. Published by American Society of Agronomy. All copyrights reserved.
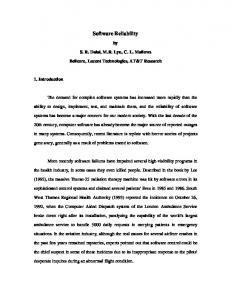
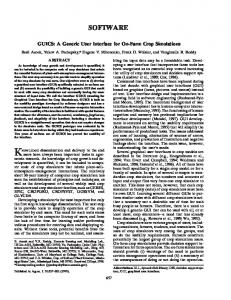
using the ODBC database API. MySQL-Front database manager is used to administer and manage data tables and user-level access of the database server. Figure 3 shows the architecture of the WebGro system, which includes ASP as application server, MySQL database server, and JavaScript and Visual Basic scripts (VBscript) used for preprocessing and postprocessing of data.
IMPLEMENTATION
Fig. 3. Architecture of the web-based soybean decision support system.
genetic coefficients for different soybean maturity groups, soil types, and weather data from weather stations in Iowa and Illinois are stored in the database server. To access information from the database server, an open database connectivity (ODBC) driver called MySQL ODBC (MySQL AB, 2003) was used. Open database connectivity is a core component of Microsoft Windows open services architecture and is an interface for accessing data from different relational and nonrelational database management systems (Microsoft, 2001). It is an application programming interface (API) that allows developers and programmers to abstract a program from a database and provides an open, vendor-neutral way of accessing data stored in a variety of databases. MySQL ODBC allows connection to a MySQL database server
The WebGro DSS employs a simple GUI that allows users to easily navigate between sections. User registration is required to access WebGro, and the website has a registration form for new users to fill out. Registration accomplishes four things: First, users can be notified of WebGro updates or changes; second, the system provides the user a specific working directory on the server for model runs; third, the system provides an index to identify a user and his/her field information and model runs; and lastly, the system allows the user to examine model output across different sessions. The latter is one of the strengths of this system in that it lets users save, edit, or delete model runs and allows them to compare multiple management scenarios. In addition, users can log off and end a session, come back and log on to the system at a later date, and view previous model runs and detailed information used for a specific model run. The system allows users to save up to 80 model runs and does not impose a limit on how long model runs have been saved. Users can access their WebGro account and data as long as the website is online.
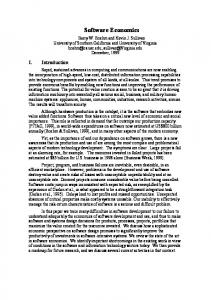
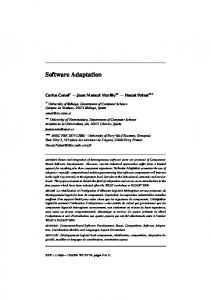
Fig. 4. WebGro data page allows users to enter specific soybean field and management information, level of plant stresses, and options for model runs.
PAZ ET AL.: WEBGRO—A WEB-BASED SOYBEAN MANAGEMENT DECISION SUPPORT SYSTEM
Reproduced from Agronomy Journal. Published by American Society of Agronomy. All copyrights reserved.
Data Page The main data page (Fig. 4) shows the different sections where the user must provide information and select the different model simulation options. There are four subgroups in the main data page: (i) field characteristics, (ii) management practices, (iii) plant stresses, and (iv) simulation options. Under the “field characteristics” subgroup, users can specify the field number and name for a particular soybean field. The system assigns an index number for the specified field name to distinguish it from the other fields that the user may want to examine. Also available under this subgroup is a list of available soil types from which the user can select the most appropriate one in his/her field. Using a series of options from specific list boxes in the “management practices” section, the user can select information such as soybean variety, level of plant resistance to SCN, planting date, plant population, row spacing, weather station, and year. Different levels of stresses can be specified for a particular scenario before running the model. Under the “plant stresses” subgroup, users can specify the level of SCN egg count based on soil analysis, the level and date of herbicide injury and/or hail damage, and the severity of Rhizoctonia root rot. Switches in the “simulation options” section allow the user to select different combinations of stresses for different simulations, including (i) simulate yield with all stresses turned on, (ii) estimate
1775
yield potential, or (iii) simulate soybean yield with or without the following stresses turned on: hail damage, herbicide injury, Rhizoctonia root rot, SCN, and water stress. After the required information has been entered and a specific simulation option has been selected, the user can then run the model by pressing the “run model” button at the bottom of the data page.
Program Flow As depicted in Fig. 3, the browser is the medium with which information is received and where the model output is presented to the user. Once the user clicks the “run model” button in the WebGro data page, the browser sends a request to the web server. The scripts embedded in the ASP are parsed by the application server, and the system proceeds to handle the processing of user-selected options and file-handling routines. The model input file (IBSNAT3x.INP) is created using VBScript, and it includes field and management information, soil identification, weather station, and maturity group codes retrieved from the database. Additionally, soil and weather data files are generated automatically to conform to the DSSAT file format (Tsuji et al., 1994). After the input files have been created, the script activates a batch file that runs the model, processes the model output for storage in the database, and updates the output table that the user can view onscreen. It is important to note that each entry in the output table
Fig. 5. WebGro page showing the active soybean field used in a particular &ret;simulation and summary table of model runs.
1776
AGRONOMY JOURNAL, VOL. 96, NOVEMBER–DECEMBER 2004
Table 2. Sample summary table of soybean yield response as affected by different levels of plant stresses in Nashua, IA.†
Reproduced from Agronomy Journal. Published by American Society of Agronomy. All copyrights reserved.
Weather station Nashua Nashua Nashua Nashua Nashua Nashua
Planting date 1 1 1 1 1 1
May May May May May May
2003 2003 2003 2003 2003 2003
Plant population
SCN‡ egg count
Herbicide injury level
Hail damage
Rhizoctonia root rot severity
Water stress
Grain yield
plants, no. 180 000 180 000 180 000 180 000 180 000 180 000
eggs, no. 0 0 5000 5000 5000 5000
0 0 0 0 50 50
defoliation, % 0 0 0 50 50 50
0 0 0 0 0 50
N Y Y Y Y Y
kg ha⫺1 4286 3668 2665 2625 2274 1938
† For these simulations, date hail damage occurred ⫽ 21 June 2003 and date of herbicide injury ⫽ 21 July 2003. ‡ SCN, soybean cyst nematode.
represents one model run. Each time the user modifies an existing field and runs the model, the output table is updated, thus allowing the user to compare multiple scenarios.
Gro can also view detailed field information for a particular model run. As with any DSS, users are cautioned not to rely solely on WebGro yield estimates as the basis for any management strategy that they want to implement in their field. WebGro offers interactive graphical output of model results that lets users examine daily soybean biomass weight for a specific field or scenario. The system also allows users to view the differences in daily leaf, stem, or grain weight between two stress scenarios (Fig. 6) in a particular growing season. Figure 7 shows the daily change in leaf and grain weight of soybean as affected by hail damage and different dates when hail injury occurred in the field.
Model Features and Yield Gap Analysis One of the strengths of the WebGro system is that it provides tabular and graphical output of different modeling scenarios. Through this feature, yield gap analysis can be made allowing users to examine the effects of varying levels of plant stresses on yield. Users can determine the maximum yield potential by selecting the “no stress” option. Figure 5 shows an example of the WebGro output table of two scenarios for a field in Nashua, IA. Estimated yield loss due to varying levels of stress can be examined by comparing yields from model runs with selected stresses turned on (Table 2). Results of model runs for a field in Nashua, IA, in 2003 show the potential yield when stresses were not considered as well as variations in soybean yield response due to the effect of different combinations of stresses. After the initial model run, individual stresses were turned on in a stepwise fashion. In this example, soybean yield was reduced by 15% due to water stress, and roughly 55% of all stresses were present. It is important to point out that the different levels of plant stresses were arbitrarily set for illustration purposes only. In WebGro, users can set their own preferences and see how soybean yields are affected by different stresses. The summary tables (Tables 3 and 4) present some basic management information used in the field, including plant population and planting date. Users of Web-
Sensitivity Analysis Tables 3 and 4 present the soybean yield response as affected by different levels of SCN egg counts and Rhizoctonia root rot, respectively, in a field in Kanawha, IA. Note that results shown in Tables 3 and 4 are graphed in Fig. 2. Increasing SCN egg count from 0 to 14 000 eggs 100 cm⫺3 of soil resulted in loss of roughly 1550 kg ha⫺1 (26.37 bu ac⫺1) of soybean (Table 3). It should be noted that water stress was not considered for this particular scenario in Kanawha, IA, for the 2002 growing season. Batchelor (2002) developed a function that quantifies yield response of soybean due to the presence of Rhizoctonia root rot. The version of the CROPGRO-Soybean model used in WebGro includes this relationship. The effect of increasing level of Rhizoctonia root rot severity was evident by the decrease in soybean yield (Table 4). Yield decreased approximately 17% as root rot sever-
Table 3. Sample summary table of soybean yield response as affected by different levels of soybean cyst nematode (SCN) in a field in Kanawha, IA. Weather station Kanawha Kanawha Kanawha Kanawha Kanawha Kanawha Kanawha Kanawha Kanawha Kanawha Kanawha Kanawha Kanawha
Planting date 2 2 2 2 2 2 2 2 2 2 2 2 2
May May May May May May May May May May May May May
2002 2002 2002 2002 2002 2002 2002 2002 2002 2002 2002 2002 2002
Plant population
SCN egg count
plants, no. 180 000 180 000 180 000 180 000 180 000 180 000 180 000 180 000 180 000 180 000 180 000 180 000 180 000
eggs, no. 0 1 000 2 000 3 000 4 000 5 000 6 000 7 000 8 000 9 000 10 000 12 000 14 000
Herbicide injury level
Hail damage
Rhizoctonia root rot severity
Water stress
Grain yield
0 0 0 0 0 0 0 0 0 0 0 0 0
defoliation, % 0 0 0 0 0 0 0 0 0 0 0 0 0
0 0 0 0 0 0 0 0 0 0 0 0 0
N N N N N N N N N N N N N
kg ha⫺1 4059 3661 3365 3144 2978 2854 2760 2690 2638 2602 2574 2537 2517
1777
PAZ ET AL.: WEBGRO—A WEB-BASED SOYBEAN MANAGEMENT DECISION SUPPORT SYSTEM
Table 4. Sample summary table of soybean yield response as affected by different levels of Rhizoctonia root rot in a field in Kanawha, IA.
Reproduced from Agronomy Journal. Published by American Society of Agronomy. All copyrights reserved.
Weather station Kanawha Kanawha Kanawha Kanawha Kanawha Kanawha Kanawha Kanawha Kanawha
Planting date 2 2 2 2 2 2 2 2 2
May May May May May May May May May
2002 2002 2002 2002 2002 2002 2002 2002 2002
Plant population
SCN† egg count
Herbicide injury level
Hail damage
Rhizoctonia root rot severity
Water stress
Grain yield
plants, no. 180 000 180 000 180 000 180 000 180 000 180 000 180 000 180 000 180 000
eggs, no. 0 0 0 0 0 0 0 0 0
0 0 0 0 0 0 0 0 0
defoliation, % 0 0 0 0 0 0 0 0 0
10 20 30 40 50 60 70 80 90
Y Y Y Y Y Y Y Y Y
kg ha⫺1 4111 4103 4088 4059 3990 3788 3420 2856 1957
† SCN, soybean cyst nematode.
ity increased from 10 to 70%. Through these examples, WebGro users may conduct sensitivity analysis of different yield-limiting factors and examine the degree of potential yield loss due to these factors in terms of percentage reduction in yield.
DISCUSSION Using the dynamic information delivery capabilities of the Internet, a web-based soybean DSS called WebGro was developed to allow users to examine the effects of different factors on soybean growth and development and assist producers in soybean management decisions. The system, which was built on CROPGRO-Soybean model, provides dynamic web pages allowing interaction among the user, the crop model, and the database. Using web data forms, specific soybean field information is collected and used in the crop model to simulate the
effects of individual or multiple stresses on soybean yield on a producer’s field. Genetic coefficients for different soybean maturity groups, soil types, and weather data from weather stations in Iowa and Illinois are stored in MySQL database server. Field information supplied by the user and results of model simulations are stored in the database. WebGro can be used either as a planning tool to determine how to best reduce the adverse impacts of different plant stresses during the upcoming year or as a diagnosis tool to estimate the cost of interactions during the past year. WebGro is designed to help producers increase soybean yield by providing estimates of yield loss due to interacting biotic and abiotic factors. One of the strengths of the system is that it provides tabular and graphical output of different modeling scenarios, thereby allowing users to examine individual and combined effects of plant stresses. Although the system is targeted to soy-
Fig. 6. WebGro chart showing daily biomass weight for a particular scenario.
Reproduced from Agronomy Journal. Published by American Society of Agronomy. All copyrights reserved.
1778
AGRONOMY JOURNAL, VOL. 96, NOVEMBER–DECEMBER 2004
Fig. 7. Graph showing differences in daily leaf and grain weight for two stress scenarios involving different dates when hail injury occurred.
bean producers, other users such as students and crop consultants can create their own user profiles and create, examine, and analyze different management scenarios affecting soybean growth and development. Future development will include integration of GIS capabilities into the system, linking to regional weather databases, addition of new pest modules, expansion of databases by adding soil types and genetic coefficients of soybean cultivars, improved visualization through field mapping options, and ability to run multiple years of data. REFERENCES Anderson, R., D. Denault, M. Gregorini, B. Francis, M. Gibbs, A. Homer, C. McQueen, S. Robinson, J. Schenken, and K. Williams. 2000. ASP 3.0: Programmer’s reference. Wrox Press, Birmingham, UK. Batchelor, W.D. 2002. Managing interactive stresses to increase soybean yields. Final project report. Soybean Res. and Dev. Counc., Des Moines, IA. Batchelor, W.D., J.W. Jones, K.J. Boote, and H.O. Pinnschmidt. 1993. Extending the use of crop models to study pest damage. Trans. ASAE 36(2):551–558. Browde, J.A., L.P. Pedigo, M.D.K. Owen, G.L. Tylka, and B.C. Levene. 1994. Growth of soybean stressed by nematodes, herbicides, and simulated insect defoliation. Agron. J. 86:968–974. Choi, J.Y., B.A. Engel, and J. Harbor. 2002. Integrated DSS of WebGIS and online watershed delineation for hydrologic impact evaluation. ASAE Meeting Paper 02–3038. ASAE, St. Joseph, MI. Fallick, J.B., W.D. Batchelor, G.L. Tylka, T. Niblack, and J.O. Paz. 2002. Coupling soybean cyst nematode damage to CROPGROSoybean. Trans. ASAE 45(2):433–441. Hoogenboom, G.J., J.W. Jones, P.W. Wilkens, W.D. Batchelor, W.T. Bowen, L.A. Hunt, N. Pickering, U. Singh, D.C. Godwin, B. Baer, K.J. Boote, J.T. Ritchie, and J.W. White. 1994. Crop models. In
G.Y. Tsuji, G. Uehara, and S. Balas (ed.) DSSAT v3. Vol. 2–2. Univ. of Hawaii, Honolulu. Microsoft. 2000a. Internet Information Services 5.0 features [Online]. Available at www.microsoft.com/windows2000/server/evaluation/ features/web.asp (verified 19 Aug. 2004). Microsoft, Redmond, WA. Microsoft. 2000b. Windows 2000 Operating System [Online]. Available at www.microsoft.com/windows2000/default.asp (verified 19 Aug. 2004). Microsoft, Redmond, WA. Microsoft. 2001. ODBC–Open Database Connectivity overview [Online]. Microsoft Knowledge Base Article 110093. Available at http:// support.microsoft.com/default.aspx?scid⫽kb;en-us;110093 (verified 20 Aug. 2004). Microsoft, Redmond, WA. Miller, D.A., M.H. Hall, J.Voortman, and P.J. Kolb. 2002. A webbased decision support tool for forage species selection [Online]. Available at www.plantmanagementnetwork.org/cm/. Crop Manage. doi:10.1094/CM-2002–1014–01-MA. MySQL AB. 2003. MySQL: Open source database [Online]. Available at http://www.mysql.com (verified 20 Aug. 2004). MySQL AB, Uppsala, Sweden. Pan, X., J.D. Hesketh, and M.G. Huck. 2000. OWSimu: An objectoriented and Web-based simulator for plant growth. Agric. Syst. 63:33–47. Paz, J.O., W.D. Batchelor, T.S. Colvin, S.D. Logsdon, T.C. Kaspar, and D.L. Karlen. 1998. Analysis of water stress effects causing spatial yield variability in soybeans. Trans. ASAE 41(5):1527–1534. Paz, J.O., W.D. Batchelor, G.L. Tylka, and R.G. Hartzler. 2001. A modeling approach to quantify the effects of spatial soybean yield limiting factors. Trans. ASAE 44(5):1329–1334. Pedersen, P., and J.G. Lauer. 2002. Influence of rotation sequence and tillage system on the optimum plant population for corn and soybean. Agron. J. 94:968–974. Pedersen, P., and J.G. Lauer. 2003a. Corn and soybean rotation effect on row spacing and tillage system. Agron. J. 95:965–971. Pedersen, P., and J.G. Lauer. 2003b. Soybean agronomic response to management systems in the upper Midwest. Agron. J. 95:1146– 1151. Pedersen, P., and J.G. Lauer. 2004. Soybean growth and development
Reproduced from Agronomy Journal. Published by American Society of Agronomy. All copyrights reserved.
PAZ ET AL.: WEBGRO—A WEB-BASED SOYBEAN MANAGEMENT DECISION SUPPORT SYSTEM
in various management systems and planting dates. Crop Sci. 44: 508–515. Pinnschmidt, H.O., W.D. Batchelor, and P.S. Teng. 1995. Simulation of multiple species pest damage in rice using CERES-Rice. Agric. Syst. 48:193–222. Salado-Navarro, L.R., T.R. Sinclair, and K. Hinson. 1986. Yield and reproductive growth of simulated and field-grown soybean: II. Dry matter allocation and seed growth rates. Crop Sci. 26:971–975. Sauter, V.L. 1997. Decision support systems: An applied managerial approach. John Wiley & Sons, New York. Sinclair, T.R. 2004. Improved carbon and nitrogen assimilation for
1779
increased yield. p. 537–568. In H.R. Boerma and J.E. Specht (ed.) Soybeans: Improvement, production, and uses. 3rd ed. Agron Monogr. 16. ASA, CSSA, and SSSA, Madison, WI. Tsuji, G.T., J.W. Jones, and S. Balas (ed.) 1994. DSSAT v3. University of Hawaii, Honolulu. Welch, S.M., J.W. Jones, M.W. Brennan, G. Reeder, and B.M. Jacobson. 2002. PCYield: Model-based decision support for soybean production. Agric. Syst. 74(1):79–98. Wrather, J.A., T.R. Anderson, D.M. Arsyad, J. Gai, L.D. Ploper, H.H. Ram, and J.T. Yorinori. 1997. Soybean disease loss estimates for the top 10 soybean producing countries in 1994. Plant Dis. 81: 107–110.