Full citation: MacDonell, S.G. (2003) Software source code sizing using fuzzy logic modeling, Information and Software Technology 45(7), pp.389-404. doi:10.1016/S0950-5849(03)00011-9
Software Source Code Sizing Using Fuzzy Logic Modeling Stephen G. MacDonell SERL, Auckland University of Technology Private Bag 92006, Auckland 1142, New Zealand
[email protected]
Abstract Knowing the likely size of a software product before it has been constructed is potentially beneficial in project management: for instance, size can be an important factor in determining an appropriate development/integration schedule, and it can be a significant input in terms of the allocation of personnel and other resources. In this study we consider the applicability of fuzzy logic modeling methods to the task of software source code sizing, using a previously published data set. Our results suggest that, particularly with refinement using data and knowledge, fuzzy predictive models can outperform their traditional regression-based counterparts.
Keywords: software size, SLOC, prediction, fuzzy logic
1. INTRODUCTION Modeling relationships within project management continues to present challenges to the software engineering community. Although there is ample empirical evidence to indicate that, to some degree, software size is related to construction effort, and construction effort is related to project duration, there are many other factors that can and do have a significant impact on the specific nature of these relationships. The influence of the type of software to be constructed and its intended operational domain have been considered for some time, as evident in the work of Boehm (1981) and DeMarco (1984) and more recently in that reported by Murali and Sankar (1997), whereby different models are used or weightings applied for different classes of systems. In a very general sense, such considerations are needed because complex software, such as real-time embedded life-critical systems, requires proportionally more effort to build than simpler similarly sized counterparts. The impact of the specific personnel involved in a product’s construction has been found to be significant in terms of a project’s schedule, with some evidence suggesting that the impact can be as much as twenty to one (Boehm and Papaccio 1988; Lee 1993; Blackburn et al. 1996). The sophistication of the tools
and methods employed in development can also have an impact on effort and duration, as illustrated by Banker et al. (1992) and Chan et al. (1996). Having said all of this, the fact remains that the consistently dominant factor in such relationships is product size (measured in some way) (Verner and Tate 1992; Cockcroft 1996; Hakuta et al. 1997). Whilst these other factors undoubtedly have an influence, we can potentially make significant inroads into the problem of effort prediction and schedule estimation if we have reliable measures of size. We also face ongoing challenges in the area of data analysis and interpretation, given the characteristics commonly found in software engineering data sets. Missing data can occur due to problems in collection, be they systematic or related to errors made by project personnel (Lind and Sulek 1998; Chulani et al. 1999). Although various methods exist to cope with missing data (Myrtveit et al. 2001) the influence on the predictive models generated can be significant. Some data sets also exhibit significant skewing and heteroskedasticity, rendering certain analysis techniques inapplicable (Rosenberg 1998; Pickard et al. 1999; Pickard et al. 2001). This is frequently evident in data sets dealing with software defects and the like, where there is a fixed lower limit of zero. Data sets need to be sufficiently large relative to the number of parameters in order to use certain methods of analysis (Rosenberg 1998; Basili et al. 1999). In building predictive models we need to be aware of the effect of outlier observations and multicollinearity among the predictor variables, both of which can have a significant impact on the structure and stability of models (Miyazaki et al. 1994; MacDonell et al. 1997). Other issues that need to be considered include the unbalanced nature of many software engineering data sets (Kitchenham 1998), in which the values that influential factors take tend to cover only a portion of the range of possible values, and the fact that software data are nonstationary since software development and evolution processes are stochastic (Pillai and Nair 1997). As a result, practitioners and researchers have continued to explore alternative or complementary modeling and analysis approaches. The application of computational intelligence methods to problems in software engineering has therefore risen to prominence in recent years. (Note
that whilst it appears that the term computational intelligence is becoming the most widely used descriptor for work in this area, similar research has also been undertaken under the banners of machine learning and soft computing.) The potential of such methods has been demonstrated in domains other than software engineering for some time, and in the last decade such methods have been increasingly adopted by software engineering researchers. For example, the capabilities of neural networks in analyzing software engineering data sets have been assessed among others by Khoshgoftaar and Lanning (1995), Lee et al. (1998) and Mair et al. (2000), case-based reasoning and analogy methods have been investigated by Shepperd and Schofield (1997), Myrtveit and Stensrud (1999) and Walkerden and Jeffery (1999), and fuzzy logic has been investigated by Kumar et al. (1994), Ebert (1997), Yau and Tsoi (1998) and Piattini et al. (2001). More recently, genetic algorithms have also been considered as potentially useful in analyzing software engineering data (Shukla 2000). These studies have met with mixed success, although in general it does appear that techniques of this nature are able to produce models for classification and prediction that are of at least similar accuracy to their statistically based equivalents. Moreover, there are other advantages in using these approaches in terms of their capacity to adapt and learn from the data on which they are built. Ultimately, however, it is improvements in predictive accuracy that will see such methods accepted more readily by other researchers and software engineering practitioners, so it is in this respect that we would need to see improvements made. The remainder of this paper is structured as follows. The notion of software sizing is discussed in the next section, focusing particularly on the estimation of software source code size. Modeling methods used in producing these estimates are then discussed in section 3. We then describe the data set used in our analysis, the results of which are detailed in section 5. We conclude our study in section 6, with recommendations for further research and implications for project management practice.
2. SOFTWARE SIZING Early and accurate prediction of software size has long been a goal of software engineers. Since the 1970s it has been the focus of extensive research initiatives, firstly as an objective in its own right, and then as part of the model-building process that aims to predict development effort and/or duration, with size as the principal input and other factors acting as refining agents. Given that in the early history of software development programming was the dominant activity it was the size of the source code that was of interest. Thus the work of Halstead (1977), Chrysler (1978) and Boehm (1981) employed both theoretical and empirical analyses to construct initial models of software source code size. An area of related research that emerged out of this work is that concerning the notion of software evolution, popularised by Lehman (1991, 1998). Implicit in this work is an assertion that software follows patterns of growth over time, and that an attribute such as size can be modelled accordingly.
Further discussion of software release size estimation (in terms of source code) is provided by Turski (1996). As the desire to build early predictive models grew so research increased into measuring the size of other precoding phase products. As a result a variety of specification- and design-based measures were proposed. Although they are of some relevance here the majority of these studies did not directly address software sizing in terms of source code, and so we provide only a brief summary of the more prominent efforts in Table 1. The interested reader is referred to Tate and Verner (1990) for a comprehensive review of the earlier models listed, and to MacDonell (1994) for an alternative criteria-based evaluation of several of these approaches. Ferens (1999) also provides an excellent (largely qualitative) review of software sizing methods. In spite of the availability of a wide range of software product size measures, source lines of code (SLOC) remains in favour in many models, particularly those intended for effort estimation based on a COCOMO-type approach. One of the criticisms levelled at such methods is that SLOC size must itself be estimated before an estimate of effort can be produced. Some of the studies mentioned in Table 1 and in the following discussion were undertaken to determine whether other size measures, which could be objectively calculated at an early stage in the development process, were in fact related to eventual SLOC and could therefore be considered instead of the estimated SLOC figures (e.g. Mukhopadhyay and Kekre 1992; Dolado 1997; MacDonell et al. 1997). Our particular focus in this study, however, is on the estimation of source code size, in this case code that is written using a fourth-generation development environment, and the remainder of this section deals with research to date on this topic. The most comprehensive set of studies undertaken in this area are those of Verner and Tate (1987, 1988, 1992; Tate and Verner 1990). After first proposing a model of software sizing applicable throughout the development life cycle (1987) Verner and Tate then turned their attention specifically to 4GL source code estimation. In their second study (1988) they employed a combination of function point analysis and COCOMO to produce size, effort and schedule estimates for two increments of the same information system. Notable observations of this study included the lack of prior investigations using COCOMO in a 4GL environment and the need for novel measures of code size given the form-filling nature of their particular development toolset. Given these constraints Verner and Tate were able to generate what they felt to be reasonably accurate indicators of size and effort. In a subsequent study Verner and Tate (1992) developed what they referred to as a “…more general and flexible FPA-like approach” (p. 265) for transactioncentered business systems. This method adopted a different set of elementary software components as contributors to code size – menus, screens, reports, relations and updates. Each was assessed using one or more measures (number of choices, number of data elements, nesting level and so on) with some adjustment for algorithmic complexity. After using regression analysis to build a set of predictive models with data from
one version of a system they then tested these models on later increments of the same system. In general they found that they were able to estimate source code size very accurately using this method. Further evaluation of
their approach on two other systems produced similarly accurate estimates once models were tailored to the environments in question.
Table 1. A selection of early-phase estimation methods. Method
Source
Aim
Scope
Comments
Function point analysis (and variants)
Albrecht 1979; Albrecht and Gaffney 1983
Abstract size based on user needs, adjusted for complexity to enable effort estimation.
Business systems initially. Many variants to widen its applicability to other system types.
Wide uptake, international standards, rigid, driven by set of fixed parameters with fixed weight ranges.
Bang/Function weight
DeMarco 1984, 1989
Abstract size based on functional primitives, adjusted for input/output volume and process complexity.
All system types, either data-strong (typically business) or function-strong (typically realtime/scientific).
Intuitively appealing but not widely adopted.
Mini-Model
Kulkarni et al. 1988
Used process deliverables at each stage to build size and effort estimates for the next.
Built for military command/control systems.
Methodology dependent, but said to be adaptable to other environments.
Mk II FPA
Symons 1988, 1991
Contemporary datacentered approach, using past data to calibrate weights.
Business systems.
Said to overcome FPA shortcomings; extensive adoption in Europe.
OO system size
Laranjeira 1990
Size and effort estimation.
OO systems
Innovative, used confidence intervals.
CK metrics suite
Chidamber and Kemerer 1991, 1994
Design metrics, used subsequently for effort prediction.
OO systems
Generally accepted in OO community.
Application features
Mukhopadhyay and Kekre 1992
Size and effort estimation.
Process control systems.
Promoted need for environment-specific models.
Object points
Banker et al. 1992
Adapted, automated version of FPA for CASE environments.
Largely centered on business systems.
Popular while CASE was a prominent technology.
Specification measures
Tate and Verner 1991;
Automated size measurement, effort prediction.
Data-centered business systems.
Proposed at the height of CASE and 4GL popularity.
MacDonell 1997
Parallel to the work of Tate and Verner was that undertaken and reported by Wrigley and Dexter (1991). Their empirical analysis of twenty-six 4GL systems indicated that source code size could be modeled with a high degree of accuracy at both program and system levels, using regression-based equations that took into account a variety of independent variables – files accessed, projections and joins, screen images, input and output data elements, and (at the system level) screens, reports and files. Their experiment was sound and rigorously conducted, although the authors themselves noted that theirs was an assessment of goodness-of-fit modeling rather than of prediction. Bourque and Côté (1991) describe an experiment in which they built predictive models of program size using linear regression methods. Employing simple measures extracted from real-world system specifications and
designs they were able to generate models that were of comparable accuracy to those produced using far more complex and time-consuming data collection and analysis methods. A similar experiment, this time using a CASE environment rather than a 4GL, was reported by Cockcroft (1996). She found that it was possible to predict code product size with low error based on measures collected from the product specification’s data and data flow models (defined in the earlier studies of Verner and Tate). Size in her study, however, was measured as a count of CASE generated report lines, rather than programmer-developed code. Since code generation requires minimal personnel resources, having a priori knowledge of code size in such a situation may not be of substantial assistance in allocating labor resources or scheduling project activities.
Dolado (1997) investigated the relationship between function point measures and 4GL source code size. His study of 22 student projects found that whilst there was indeed a statistically significant relationship between function point counts and source lines of code the actual amount of variation in size explained by the FPA counts was 48% (for Albrecht FPA) and 58% (for Symons Mk II FPA). Dolado speculated on some of the reasons for this, but it remained unclear as to whether the underlying cause related to problems with function points, with the 4GL code, or with aspects of the development process. Moreover Dolado’s study was focused on assessing goodness-of-fit and so did not assess predictive accuracy per se. Hakuta et al. (1997) aimed instead to produce a “universal [size] estimation model independent of the program type or characteristics.” (p.253). Their approach utilised the abstract notion of a ‘processing unit’, a program module that performs a specified function (either visible or invisible to the user). The size of the processing units is then estimated based on reference modules, with adjustment for language level, before further refinement is undertaken based on processing complexity and environmental factors. Notable in the work of Hakuta et al. (1997) is the use of three predicted values of size for each observation, being the average and a lower and upper limit. Although rather coarse, this does represent an attempt to incorporate uncertainty into the estimation process. Hakuta et al. (1997) also emphasized the need for stepwise estimation – that is, the refinement of size estimates over time as further work is done and as further information becomes available. In one of our own earlier studies of database-centered systems (MacDonell et al. 1997) we used very simple specification-based measures in regression models to predict 4GL system size. A set of seventy small transaction-processing systems was available for analysis, split into a build set of fifty observations and a validation set of twenty project points. In estimating the total number of source statements is each system (SIZE) we found that the number of non-menu processes depicted in the specification’s functional decomposition chart (NONMENU) and the number of attributes in the system’s data model (ATTRIB) together explained 65% of the variation in size. The two predictors were related, however, so a single variable model using the most influential variable – NONMENU – was adopted as the most effective in this case. In order to provide an opportunity for model comparison we use the same data set here in the development and validation of fuzzy logic estimation models for the current study.
3. MODELING ASPECTS OF SOFTWARE PROJECT MANAGEMENT As is evident in the previous section, most of the attempts to estimate software product size (and effort) have employed parametric models built using algorithmic or regression-based methods. Complementary approaches employing computational intelligence techniques have not been widely used in this regard. That said, these methods have been utilised in addressing other software engineering research issues. In general this has been
motivated by a desire to work with the uncertainty inherent in software projects rather than trying to avoid it. Padberg (1999) reports the development of a probabilistic model for software projects, whereby development time is estimated according to probability distributions and riskbased adjustments. He illustrates his approach by considering schedule projections in a multi-team system enhancement process. Several examples are given to demonstrate how project progress varies with differences in the input parameters, enabling a form of ‘what-if’ analysis to be undertaken in order to determine the likelihood that a given schedule will be met. In acknowledging the factors that limit the effectiveness of multiple regression in software cost modeling, Chulani et al. (1999) propose the use of Bayesian analysis in order to overcome such limitations (related in particular to their earlier work on COCOMO II). Their empirical investigation of 161 project observations found that the Bayesian approach, which enables both historical data and expert judgment to be incorporated into predictive models, outperformed multiple regression modeling across fifteen separate samples of the data set. The fact that models could be refined on an ongoing basis as new data and information came to hand was promoted as a particularly important attribute of the Bayesian analysis method. Fenton and Neil (1999) comment that our current models of software development are too simplistic to fully capture cause and effect relationships. As a result, predictions constructed using such models are likely to be flawed and/or spurious. Consequently, the authors contend that we need models that are more able to cope with diverse sources of evidence (empirical data, probability distributions, managers’ insights), genuine cause and effect relationships (and the magnitude of each effect), missing information, and uncertainty. To this end they have adopted Bayesian belief nets (BBNs), network representations that incorporate model variables and their interrelationships. Although not reported extensively in their paper, the authors describe several case studies in which they have applied their BBN approach to good effect. In an assessment of three machine learning prediction methods – neural networks, case-based reasoning and rule induction – Mair et al. (2000) found that in terms of model accuracy the neural network proved to be the most effective in estimating development effort. That said, the authors also stated that the desire for accuracy needs to be tempered by considerations of model configurability and explanatory value. These and other desirable attributes of predictive models are also discussed in Gray and MacDonell (1997a). When these issues are taken into account Mair et al. (2000) contend that methods that are able to both generate and incorporate knowledge (e.g. rule-based methods) may be more widely preferred over those that are generally less able to do so (e.g. standard neural networks). Alonso et al. (1997) propose the use of rough sets (Pawlak 1991) in estimating the maintainability of software modules based on a set of object-oriented design metrics, illustrating their approach with a small-scale
empirical example. They contend that the visibility of the rule set and the incorporation of uncertainty afforded by the use of rough (rather than crisp) sets mean that such an approach would be attractive in software project management (although they did not empirically validate their method against a set of unseen observations). Studies investigating the application of fuzzy logic methods to software engineering problems are still relatively few in number, but it does appear that interest is growing in this area. One of the earliest reported efforts in this domain is that of Putnam (1987), citing the use of fuzzy logic in determining early estimates of software size. As this approach was incorporated in their commercial SIZE PLANNER product, it was and is unclear as to how the method operates in practice. Bastani et al. (1993) employed fuzzy logic in the domain of software reliability modeling. Using an experimental research method they found that a fuzzy logic approach was more effective at classifying mutated programs (as correct or incorrect) than a purely probabilistic approach. Kumar et al. (1994) provide a well-reasoned justification for the use of fuzzy logic in software project management, building an illustrative fuzzy system to replicate Putnam’s personnel scheduling model. An alternative approach utilizing expert-system support for effort estimation (based on function point analysis) is described by Griech and Pomerol (1994). Although the focus of their work was on the environment rather than on accuracy, their initial experiments “…produced a posteriori estimations not too far from the actually observed effort” (Griech and Pomerol 1994, p. 183). Ebert (1997) examined the effectiveness of five classification methods in categorizing software modules as fault-prone or non-fault-prone. His analysis indicated that the fuzzy logic approach was superior to the other four techniques considered, these being neural networks, discriminant analysis, classification trees and simple Pareto classification. Moreover, such an approach received support on an intuitive basis given that “…subjective and qualitative judgement plays an important role in [software project and quality management].” (Ebert 1997, p. 289). An attempt to apply the principles of fuzzy logic to function point analysis, in order to more successfully account for subjectivity and uncertainty in software measurement, was described by Yau and Tsoi (1998). A case study was provided to illustrate their approach although no empirical analysis was reported. More recently, Idri and his colleagues (Idri and Abran 2000; Idri et al. 2000; Idri and Abran 2001; Idri et al. 2002) have focused their work to date on two areas: the use of fuzzy logic in identifying similar observations to a target project, which can then be used as the basis of predictions for that project; and in fuzzy logic modeling of the COCOMO prediction method, particularly the specification of fuzzy membership functions for each of the cost drivers. Although their published empirical analyses are not extensive (given the early stage of the research), their work does highlight the significant potential in fuzzy logic modeling when applied to aspects of software project management. Our own work (Gray and MacDonell 1997b; MacDonell et al. 1999) has
similarly indicated the applicability of fuzzy logic methods to this domain – one of the aims of the work described here is to provide empirical evidence in support of this. As stated above, these studies reflect acceptance of the fact that, since we do not have an underlying theory of software construction, we cannot model it without uncertainty. Lind and Sulek (1998) report that, in software engineering, we have tended to ignore this uncertainty, particularly when estimators are provided with other often erroneous or misleading information concerning their predictions. Abdel-Hamid et al. (1993) and Jørgensen and Sjøberg (2001) have provided empirical evidence for this phenomenon. In investigating the issue of project undersizing, Lind and Sulek (1998) found that although the impact of size on effort was generally moderated by the opinions of project managers in an attempt to incorporate uncertainty and to take the influence of external factors (schedule pressure, personnel turnover) into account, there was a clear tendency to underestimate the real impact. They conclude by stating (p. 267): “Quantitative, predictive techniques that incorporate both the systems complexity and the behavioural dynamics of team development should help to remove the subjectivity and politics from IS project estimation.” Whilst we doubt that this goal is feasible in practice, we do support the need to bring together both data and knowledge in prediction methods. Several options exist for such an approach, including the probabilistic and Bayesian methods discussed previously. Our preferred means of doing so is through the use of fuzzy logic modeling, as described in the following sections.
4. CONTEXT FOR ANALYSIS Seventy small transaction processing systems, built using the same process and same 4GL tool set, were developed by groups of senior information science students at the University of Otago over a period of five years. Specifications for each system had been developed under the same prototyping methodology, resulting in the provision of a useful set of data in terms of investigating potential relationships between specification and design characteristics and software source code size. Whilst questions are often raised (and rightly so) in relation to the generalisability of analyses performed on student-built systems, most can be refuted in this particular case, since the systems were built to solve actual business problems for real clients operating in a commercial setting; moreover, the results per se are less important than the potential effectiveness of the more general analysis process. That is, it is not the aim of this work to recommend the specific sizing models for use in other organisations; rather, it is the model-building process and the tools and methods underlying it that may be of benefit. The specification and design methods used by the development teams employed two central system representations – an entity-relationship diagram (ERD), illustrating the data objects of interest in the system and the relationships that existed among them, and a
functional decomposition chart (FDC), depicting the highlevel menu, screen and report processing hierarchy of the system. We aimed to take measures from each of the two representations that would potentially provide coarse but early indications of system size from the data and processing perspectives respectively. Thus among the measures collected were counts of the numbers of entities, relationships and attributes (from the ERD), and counts of the numbers of data entry/edit screens and system reports (from the FDC). Whilst these counts were taken manually, a verification process was applied (by an independent counter) to ensure that the values were accurate. The dependent variable, SIZE, was the total number of source statements in each system. These values were collected automatically via a code-parsing program. Again, manual verification of the correctness of the values was undertaken on a random selection of ten systems to ensure that the parsing program was operating as intended. The sample of seventy observations was split randomly into a model-building sample of fifty data points (BUILD) and a model-testing sample of the remaining twenty points (TEST). We used the BUILD sample to develop complementary predictive models, using standard linear regression and fuzzy logic modeling (via our toolset FUZZYMANAGER (MacDonell et al. 1999)). As described at the end of section two, previous regressionbased analysis of the data set had indicated that two variables were able to explain the greatest amount of variation in product size – NONMENU, the number of non-menu processes depicted in the specification’s functional decomposition chart, and ATTRIB, the number of attributes in the system’s data model. Our models in this study were therefore constructed using the same two variables.
We also repeated the analyses using a second sample, in light of the fact that sampling can have a significant impact on the models constructed and their resultant accuracy against test observations. By repeating the analysis using a second sample we hoped to reduce the sampling bias, thus enabling us to have greater confidence in the results (as per Shepperd and Kadoda (2001) (two samples) and Mair et al. 2000 (three samples)).
5. RESULTS AND DISCUSSION We deal with the outcomes of the regression analysis first followed by an assessment of the fuzzy logic models. A comparison of the models’ predictive performance is then reported.
5.1 Regression Least-squares linear regression modeling resulted in the following models being produced:
BUILD1: 4.5(ATTRIB)
SIZE = -278.7 + 58.6(NONMENU) + (Adj R2 0.69)
BUILD2: 5.6(ATTRIB)
SIZE = -230.6 + 50.1(NONMENU) + (Adj R2 0.73)
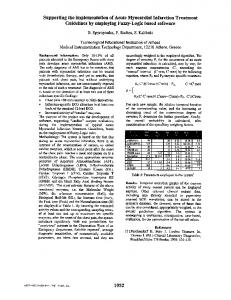
The fit for each model is shown in Figure 1. Such a representation enables us to see that whilst the regression lines are similar, they are also quite distinct. This further emphasizes the effect of sampling on the resultant model.
3000
2000
1000
PRED2 SIZE PRED1 0
SIZE 0
1000
2000
Figure 1. Regression models fitted using BUILD samples 1 and 2.
3000
These models provided a baseline for performance against which we could assess the effectiveness of the proposed fuzzy models. 5.2 Fuzzy modeling The body of knowledge concerned with fuzzy logic modeling is now quite extensive, and the techniques employed are being constantly refined. Where relevant data is available as in this case, a variety of clustering algorithms can be used to inform the creation of membership functions (MFs) for each concept (or variable) of interest. In attempting to obtain greater levels of accuracy in classification and modeling, some of these algorithms are necessarily complex. We need to consider, however, the trade-off between the accuracy and complexity of the method and its understandability. This is an important issue in terms of gaining the trust of project managers. Evidence suggests that managers are more likely to use a method that they trust, and that trust comes from understanding the process by which the estimates are derived (Myrtveit and Stensrud 1999; Sauter 1999). We therefore adopted a very simple approach to the development of our fuzzy models, on the basis that such an approach would be more acceptable to managers. Thus: •
we considered just two values for the number of membership functions for each concept – either five or seven MFs. Scales of this size are used frequently in surveys and the like, as it is generally accepted that we are comfortable in classifying items or answering questions according to five or seven options. Five sets might equate to {strongly disagree, disagree, neutral, agree, strongly agree} or {very low, low, medium, high, very high}.
•
we utilised fuzzy c-means clustering (Bezdek 1981; Billaudel et al. 1999), a relatively simple iterative clustering algorithm, to determine first-cut membership functions and rule sets from the BUILD data samples (see Appendix A for a pseudocode description of the algorithms). Note that this approach produces the most influential rules based on a combination of all the predictor variables when joined by the logical connector AND. As such the rules as generated tend to be very simple in structure.
•
we evaluated only two sizes of rule set – either fifteen or twenty rules. Whilst these numbers may be considered to be large, they are by no means as high as the number that could be needed, given the number of membership functions in the model. Potentially, every combination of functions could require a distinct rule. We then begin to encounter the ‘rule explosion’ problem, due to the exponential relationship between the number of variables, MFs and rules (Kosko 1997). In our case, we will have a system comprising two input variables (NONMENU and ATTRIB). If we adopt five MFs for each, then we would potentially need 52 = 25 rules. If we instead use seven MFs to represent each variable then the number of possible rules rises to 72 = 49.
Alternatively, we could simply have a rule for each and every observation in the sample. Whilst both strategies would be likely to result in very high BUILD model accuracy there remain three unresolved issues: one, high model accuracy when used on the TEST samples is still not assured; two, the BUILD models may be over fitted to their underlying data sets, leading to a loss of generalisability; and three, as the rule set size increases, the less understandable it becomes. We were also of the view that if a simple approach proved to be comparable to linear regression in terms of predictive performance then a more complex fuzzy approach would almost certainly result in even better outcomes. The clustering and rule extraction activities were undertaken using the CLUESOME (CLUster Extraction for SOftware MEtrics) component of our FUZZYMANAGER toolset (MacDonell et al. 1999). After experimenting with various membership function shapes we restricted ourselves to trapezoidal and triangular as being appropriate for the discrete data being modeled (Kumar et al. 1994). For the first of the two BUILD samples the best model (in terms of goodness-offit (see the next part of this section for further discussion)) was one that employed seven membership functions and fifteen rules. The clusters generated using this model are shown in Figure 2, in this case for the relationship between NONMENU and SIZE. For the second BUILD sample the best model again used seven membership functions for each variable, but in this case the triangular shape proved to be the more effective. Twenty rules resulted in greater model accuracy than fifteen for this sample. In both cases the ATTRIB and NONMENU variables used the classification {VeryLow, Low, LowMedium, Medium, MediumHigh, High, VeryHigh} and the SIZE variable {VerySmall, Small, SmallMedium, Medium, MediumLarge, Large, VeryLarge}. The two rule sets are shown in Figure 3. It can be observed that there are just two specific rules in common between the two sets, again reflecting the impact that sampling can have on model construction, although there are eight rules in total that have a common set of antecedent pairs (i.e. the same class combination for NONMENU and ATTRIB). In general, the rules adhere to the general principle that higher numbers of attributes and non-menu functions in a specification map to a larger system in terms of source code size. In this respect they could be viewed as being intuitively plausible and understandable to a project manager (although this was not tested directly in this study).
5.3 Comparison of model performance In order to compare the predictive accuracy of the two modeling methods we needed to select one or more appropriate measures of accuracy. This issue in itself has been the subject of quite extensive research in recent years (Lo and Gao 1997; Shepperd et al. 2000; Shepperd and Kadoda 2001; Kitchenham et al. 2001), and there is no consensus on what constitutes the ‘best’ accuracy indicator. This is due in no small part to the fact that organisations have different objectives when building
predictive models. For instance, some manage projects in a portfolio approach, meaning that variations for individual projects can be tolerated if over the portfolio predictive accuracy is achieved. This may be contrasted to organisations that deal with projects on a case-by-case basis, where accuracy for every project is an important
goal. As a result of these differing objectives there is a need for different accuracy measures. As we had no a priori objective in this regard, we employed a selection of measures so that performance could be considered from a variety of perspectives. The measures we chose are shown in Table 2.
Figure 2. Clusters with rule centers for the BUILD1 sample.
The No pred indicator enables us to assess the general applicability of a model. Once constructed, a regression model can be used to produce a prediction for any set of input values. Although regression models are constructed using a range of sample observations, it is not uncommon for models to be used to extrapolate likely values outside that range, in spite of the fact that such extrapolation may not be appropriate. As a result, the proportion of cases where a prediction is not made using regression analyses is generally zero. In contrast, because fuzzy logic model rules are only fired when input values map to membership functions, there may be some combinations of input values that result in no rules fired. The No pred indicator therefore shows the proportion of such observations in the TEST sample. We therefore also include the pred(n)sub measures, enabling us to assess the relative accuracy of the models for predicted cases only. We used our TEST samples to assess the predictive accuracy of the models, first by applying our regression
models and then using the FUzzy Logic for SOftware MEtrics (FULSOME) module of FUZZYMANAGER to produce first-cut estimates of SIZE. Table 3 illustrates the summarized performance of the modeling methods as applied to the two holdout samples. Where one model performs better in terms of the goal for each accuracy indicator this is illustrated in bold typeface. In considering the accuracy of the two methods the results in Table 3 suggest that the first-cut fuzzy logic models are equally or more accurate than regression modeling in terms of the MMRE, MedMRE, Sum Abs Diff and Med Abs Diff measures, but are worse according to the pred(20) and pred(30) indicators. These results are misleading, however, due to the fact that there were a number of observations in both samples for which no fuzzy rules were fired (six and two observations, respectively); hence the results as presented in Table 3 should not be compared directly. Instead, we needed to consider options for refining our first-cut fuzzy systems.
IF [ATTRIB] IS AND [NONMENU] IS THEN [Size] IS IF [ATTRIB] IS AND [NONMENU] IS THEN [Size] IS IF [ATTRIB] IS AND [NONMENU] IS THEN [Size] IS
IF [ATTRIB] IS AND [NONMENU] IS THEN [Size] IS IF [ATTRIB] IS AND [NONMENU] IS THEN [Size] IS
IF [ATTRIB] IS AND [NONMENU] IS THEN [Size] IS IF [ATTRIB] IS AND [NONMENU] IS THEN [Size] IS IF [ATTRIB] IS AND [NONMENU] IS THEN [Size] IS IF [ATTRIB] IS AND [NONMENU] IS THEN [Size] IS IF [ATTRIB] IS AND [NONMENU] IS THEN [Size] IS IF [ATTRIB] IS AND [NONMENU] IS THEN [Size] IS
IF [ATTRIB] IS AND [NONMENU] IS THEN [Size] IS
IF [ATTRIB] IS AND [NONMENU] IS THEN [Size] IS
IF [ATTRIB] IS AND [NONMENU] IS THEN [Size] IS
IF [ATTRIB] IS AND [NONMENU] IS THEN [Size] IS
IF [ATTRIB] IS AND [NONMENU] IS THEN [Size] IS IF [ATTRIB] IS AND [NONMENU] IS THEN [Size] IS IF [ATTRIB] IS AND [NONMENU] IS THEN [Size] IS IF [ATTRIB] IS AND [NONMENU] IS THEN [Size] IS IF [ATTRIB] IS AND [NONMENU] IS THEN [Size] IS IF [ATTRIB] IS AND [NONMENU] IS THEN [Size] IS IF [ATTRIB] IS AND [NONMENU] IS THEN [Size] IS IF [ATTRIB] IS AND [NONMENU] IS THEN [Size] IS
IF [ATTRIB] IS AND [NONMENU] IS THEN [Size] IS IF [ATTRIB] IS AND [NONMENU] IS THEN [Size] IS IF [ATTRIB] IS AND [NONMENU] IS THEN [Size] IS IF [ATTRIB] IS AND [NONMENU] IS THEN [Size] IS IF [ATTRIB] IS AND [NONMENU] IS THEN [Size] IS IF [ATTRIB] IS AND [NONMENU] IS THEN [Size] IS IF [ATTRIB] IS AND [NONMENU] IS THEN [Size] IS IF [ATTRIB] IS AND [NONMENU] IS THEN [Size] IS IF [ATTRIB] IS AND [NONMENU] IS THEN [Size] IS IF [ATTRIB] IS AND [NONMENU] IS THEN [Size] IS IF [ATTRIB] IS AND [NONMENU] IS THEN [Size] IS IF [ATTRIB] IS AND [NONMENU] IS THEN [Size] IS
Figure 3. Rule sets generated from BUILD samples 1 (left) and 2 (right).
The first step in our refinement process saw us consider the effect of weighted rule sets on predictive accuracy. In our first-cut analysis we used CLUESOME to produce rules of the same weight, irrespective of the fact that some rules were fired more strongly than others. Differences in the extent to which rules are fired can be interpreted as an indication of the varying degree of confidence we should
have in the rules. We therefore re-ran our rule extraction process, this time generating weighted rule sets. When these revised models were applied to the TEST samples, there was no improvement in the accuracy of the TEST1 model, but an improved level of performance was observed for the TEST2 sample. These results are presented in Table 4.
Table 2. Accuracy measures used in this study. Abbreviation
Name
Definition
Goal
MMRE
Mean magnitude of relative error
Mean of ((Actual-Predicted)/Actual) for all predictions
Minimize
MedMRE
Median magnitude of relative error
Median of ((Actual-Predicted)/Actual) for all predictions
Minimize
pred(20)
Predictive accuracy at 20% over sample
Proportion of predictions within 20% of actual value for all observations
Maximize
pred(30)
Predictive accuracy at 30% over sample
Proportion of predictions within 30% of actual value for all observations
Maximize
No pred
No prediction proportion
Proportion of cases where no predictions are made
Minimize
pred(20)sub
Predictive accuracy at 20% for predicted cases
Proportion of predictions within 20% of actual value for all predictions
Maximize
pred(30)sub
Predictive accuracy at 30% for predicted cases
Proportion of predictions within 30% of actual value for all predictions
Maximize
Sum Abs Diff
Sum of the absolute error
Sum of (Absolute Value (Actual-Predicted)) for all predictions
Minimize
Med Abs Diff
Median of the absolute error
Median of (Absolute Value (Actual-Predicted)) for all predictions
Minimize
Table 3. Performance of regression and first-cut fuzzy models on TEST samples. TEST1 Regression model
TEST2 Fuzzy model
Regression model
Fuzzy model
MMRE
0.22
0.17
0.31
0.31
MedMRE
0.16
0.10
0.17
0.17
pred(20)
55%
50%
55%
45%
pred(30)
65%
55%
65%
55%
No pred
0%
30%
0%
10%
pred(20)sub
55%
71%
55%
50%
pred(30)sub
65%
79%
65%
61%
Sum Abs Diff
4463
2367
5557
4992
Med Abs Diff
175
97
198
146
We next considered how we might be able to address the fact that the sample-based model construction process had resulted in failure to produce predictions for a total of eight of the forty observations. This required us to examine the TEST observations for which no rules had been fired and to consider whether amendments and additions to the fuzzy systems would in fact enable us to provide useful predictions. (This reflects the real-world situation encountered by a manager when they are faced
with a project that has no directly analogous counterparts.) In this respect we could amend the membership functions and/or the rule sets. In examining the six observations in the first TEST sample we found that three had low ATTRIB values and one had a high value for the same parameter, and that these were all values that fell just outside the existing membership function limits. Minor adjustments to the lower bound parameters for the ATTRIB sets {Low} and {High},
along with one label change to the SIZE parameter in one of the fifteen rules (from {SmallMedium} to {Small}), led to substantial improvement in the effectiveness of the model. Six further observations now had predictions associated with them, and although the estimates for two other observations had become worse as a result, two others had been improved, and ten had remained the same. In looking at similar possibilities for the second sample, the addition of a new rule to cope with large systems along with slight changes to the {Low} and {Medium} ATTRIB fuzzy sets resulted in all twenty observations having an associated estimate, with two new predictions, four that were slightly worse, two that were better, and twelve that were the same. Over both samples,
however, overall performance of the fuzzy logic models was considerably improved (see Table 5). The fit of each of the models on their respective data set is also shown graphically in Figures 4 and 5. The impact of an unusual (yet valid) observation on the regression model (LSR) in Figure 4 is clearly evident – this is one of the two remaining observations in the sample for which no rules were fired in the corresponding fuzzy logic model. Such an outcome reinforces previous comments regarding the impact of unusual observations on the effectiveness of regression modeling.
Table 4. Performance of regression and refined (weighted) fuzzy models on TEST samples. TEST1 Regression model
TEST2 Fuzzy model
Regression model
Fuzzy model
MMRE
0.22
0.17
0.31
0.29
MedMRE
0.16
0.10
0.17
0.13
pred(20)
55%
50%
55%
50%
pred(30)
65%
55%
65%
60%
No pred
0%
30%
0%
10%
pred(20)sub
55%
71%
55%
56%
pred(30)sub
65%
79%
65%
67%
Sum Abs Diff
4463
2367
5557
4005
Med Abs Diff
175
97
198
123
Table 5. Performance of regression and refined (amended) fuzzy models on TEST samples. TEST1 Regression model
TEST2 Fuzzy model
Regression model
Fuzzy model
MMRE
0.22
0.18
0.31
0.28
MedMRE
0.16
0.10
0.17
0.12
pred(20)
55%
60%
55%
60%
pred(30)
65%
75%
65%
70%
No pred
0%
10%
0%
0%
pred(20)sub
55%
67%
55%
60%
pred(30)sub
65%
83%
65%
70%
Sum Abs Diff
4463
2831
5557
4206
Med Abs Diff
175
90
198
110
This step in our analysis could be justly criticized in that in effect it returns the process to a model-fitting exercise with all data visible (BUILD + TEST) rather than an assessment of unbiased prediction. We therefore also investigated whether a similar strategy would result in improvements in the regression-based predictions. Instead of creating two separate regression equations from our two BUILD samples we generated a single best-fit equation from the entire sample of seventy observations.
We then applied this equation to the two TEST samples and assessed its performance according to our accuracy criteria. The results are presented alongside those obtained from the existing amended fuzzy logic models in Table 6, and graphically in Figures 6 and 7. It can be seen that whilst some improvements in accuracy were indeed made, particularly in terms of the pred indicators, performance against other criteria actually deteriorated, and the fuzzy logic models still performed better overall.
3000
2000
1000
PRED1FUZ SIZE1 Rsq = 0.8815 PRED1LSR SIZE1 Rsq = 0.7000
0 0
1000
2000
3000
Figure 4. Model fit for the TEST1 sample. 3000
2000
1000
PRED2FUZ SIZE2 Rsq = 0.6486 PRED2LSR SIZE2 Rsq = 0.5674
0 0
1000
2000
3000
Figure 5. Model fit for the TEST2 sample.
It should be noted that, apart from the development of the model based on the complete data set, we made no attempt to revise the regression models in light of their performance on the TEST data samples. However, when compared to the very transparent nature of the fuzzy models, regression equations do not lend themselves to such refinement. As a result we consider that the
outcomes of the work are valid for this study. It is therefore the conclusion of this analysis that in terms of accuracy, fuzzy logic modeling can outperform regression-based estimation in software source code sizing.
Table 6. Performance of full regression model versus refined (amended) fuzzy models. TEST1 Regression model
TEST2 Fuzzy model
Regression model
Fuzzy model
MMRE
0.23
0.18
0.31
0.28
MedMRE
0.20
0.10
0.18
0.12
pred(20)
50%
60%
60%
60%
pred(30)
75%
75%
70%
70%
No pred
0%
10%
0%
0%
pred(20)sub
50%
67%
60%
60%
pred(30)sub
75%
83%
70%
70%
Sum Abs Diff
4368
2831
5252
4206
Med Abs Diff
205
90
166
110
3000
2000
1000
PRED1FUZ SIZE1 Rsq = 0.8815 PREDLSR SIZE1 Rsq = 0.7015
0 0
1000
2000
3000
Figure 6. Model fit for the TEST1 sample (against full regression model).
6. CONCLUSIONS This study set out to investigate whether fuzzy logic modeling could be used both in its own right and as a viable alternative to least squares regression in the estimation of source code size. Specifically we used very simple clustering and rule extraction methods to generate first-cut fuzzy models for two samples from a set of 4GL project records and compared the accuracy of these models to that achieved via regression-based prediction. We found that using a variety of criteria, fuzzy logic modeling appeared to perform as well as or better than least squares regression. Given that the accuracy of the first-cut fuzzy models was similar to that of their regression-based counterparts it
may be said that fuzzy logic modeling adds little to existing (regression-based) modeling capability. In our view, however, fuzzy logic modeling also has several other characteristics that make it an appealing option – it is amenable to data, knowledge, or both; it incorporates aspects of uncertainty in modeling; there is no fixed structure to models; it is easily understood; and the reasoning employed via the rule sets is relatively transparent. Moreover, refinement of the fuzzy models in this study led to improved predictive accuracy and good coverage in terms of the test observations. These results suggest that in terms of estimation accuracy fuzzy logic modeling could provide effective assistance to software project managers. On the basis of this we would recommend that managers adopt fuzzy logic modeling as a technique to be used alongside other complementary
classification and prediction methods. A number of avenues for further research have arisen out of this work. As stated previously, we intentionally employed very simple methods in the construction of our fuzzy models. We now intend to investigate whether the use of more complex methods and algorithms leads to further improvements in predictive accuracy, keeping in mind the trade-off with model understandability. We are
also presently assessing the impact of sampling, the number and shape of membership functions, rule structure (in terms of other connectives) and rule set size on the accuracy of estimates. Finally, we are evaluating the accuracy of fuzzy logic modeling when applied to other software engineering problems, in order to determine the breadth of applicability of the approach in this domain.
3000
2000
1000
PRED2FUZ SIZE2 Rsq = 0.6486 PREDLSR SIZE2 Rsq = 0.5677
0 0
1000
2000
3000
Figure 7. Model fit for the TEST2 sample (against full regression model).
APPENDIX A The fuzzy c-means clustering algorithm is as follows: 1. select an appropriate mathematically defined function for the membership functions of the variable of interest i, say fi(x) 2. select the number of membership functions that are desired for that particular variable, mi 3. call each of the mi functions fij([x]) where j = 1…mi and [x] is an array of parameters defining that particular function (normally a center and width parameter are defined)
chosen f(x) where this cannot be achieved exactly (for example for triangular membership functions each function can be defined using three points a, b and c where a is the center of the next smaller function and c is the center of the next larger function).
The rule extraction algorithm is as follows: 1. start with known membership functions fij([x]) for all variables, both input and output, where j represents the number of functions for variable i and [x] is the set of parameters for the particular family of function curves
4. using onedimensional fuzzy cmeans clustering on the available data set find the mi cluster centers, cij
2. select the number of clusters k (which represents the number of rules involving the k-1 independent variables to estimate the single output variable)
5. sort the cluster centers cij into monotonic (generally ascending) order for the given i
3. perform fuzzy c-means clustering to find the centers (i dimensional) for each cluster
6. set the membership function center for fij, generally represented as one of the parameters in the array [x], to the cluster center cij 7. set the membership function widths for fij in [x] such that ∑ min=1 fin([cin,…]) = 1, or as close as possible for the
4. for each cluster k with center ck (a.) determine the kth rule to have the antecedents and consequent fij for each variable i where fij(ck) is maximized over all j
(b.) weight the rule, possibly as ∏ fij(ck)
i n=1
fij(ck) or ∑ in=1
5. combine rules with the same antecedents and consequents, either summing, multiplying, or bounded summing rule weights together 6. (optionally) ratio scale all weights so that the mean weight is equal to 1.0 to aid interpretability.
REFERENCES Abdel-Hamid, T.K., Sengupta, K. and Ronan, D. Software project control: an experimental investigation of judgment with fallible information. IEEE Transactions on Software Engineering 19(6): 603-612 (1993) Albrecht, A.J. Measuring application development productivity. In Proceedings, IBM GUIDE/SHARE Applications Development Symposium. California USA (1979) Albrecht, A.J. and Gaffney, J.E., Jr. Software function, source lines of code, and development effort prediction: a software science validation. IEEE Transactions on Software Engineering 9(6): 639-648 (1983) Alonso, E.B., Moreno, A.G. and Galvez, J.F.G. Applying rough sets to software development metrics. In Proceedings of SCI'97/ISAS'97. Caracas (1997) Banker, R.D., Kauffman, R.J. and Kumar, R. An empirical test of object-based output measurement metrics in a computer aided software engineering (CASE) environment. Journal of Management Information Systems 8(3): 127-150 (1992) Basili, V.R., Shull, F. and Lanubile, F. Building knowledge through families of experiments. IEEE Transactions on Software Engineering 25(4): 456-473 (1999) Bastani, F.B., DiMarco, G. and Pasquini, A. Experimental evaluation of a fuzzy-set based measure of software correctness using program mutation. In Proceedings of the 15th International Conference on Software Engineering. Baltimore MY, USA, IEEE Computer Society Press, Los Alamitos CA (1993) 45-54
Bourque, P. and Côté, V. An experiment in software sizing with structured analysis metrics. Journal of Systems and Software 15: 159-172 (1991) Chan, T., Siu Leung Chung and Teck Hua Ho An economic model to estimate software rewriting and replacement times. IEEE Transactions on Software Engineering 22(8): 580-598 (1996) Chidamber, S.R. and Kemerer, C.F. Towards a metrics suite for object oriented design. In Proceedings of OOPSLA'91. Phoenix, AZ, ACM (1991) 197-211 Chidamber, S.R. and Kemerer, C.F. A metrics suite for object oriented design. IEEE Transactions on Software Engineering 20(6): 476-493 (1994) Chrysler, E. The impact of program and programmer characteristics on program size. In Proceedings of the National Computer Conference (1978) 581-587 Chulani, S., Boehm, B.W. and Steece, B. Bayesian analysis of empirical software engineering cost models. IEEE Transactions on Software Engineering 25(4): 573583 (1999) Cockcroft, S.K.S. Estimating CASE development size from outline specifications. Information and Software Technology 38: 391-399 (1996) DeMarco, T. An algorithm for sizing software products. ACM SIGMetrics Performance Evaluation Review 12(2): 13-22 (1984) DeMarco, T. In the land of function metrics. Presented to The 5th International COCOMO User Group Conference, Pittsburgh (1989) Dolado, J.J. A study of the relationships among Albrecht and Mark II function points, lines of 4GL code and effort. Journal of Systems and Software 37: 161-173 (1997) Ebert, C. Experiences with criticality predictions in software development. In Proceedings of the 6th European Software Engineering Conference (ESEC/FSE'97). Switzerland, Springer (1997) 278-293 Fenton, N.E. and Neil, M. Software metrics: success, failures and new directions. Journal of Systems and Software 47: 149-157 (1999)
Bezdek, J.C. Pattern Recognition with Fuzzy Objective Function Algorithms. Plenum, New York, 1981
Ferens, D.V. Software size estimation: quo vadis? National Estimator (Winter): 43-54 (1999)
Billaudel, P., Devillez, A. and Villermain Lecolier, G. Performance evaluation of fuzzy classification methods designed for real time application. International Journal of Approximate Reasoning 20: 1-20 (1999)
Gray, A.R. and MacDonell, S.G. A comparison of techniques for developing predictive models of software metrics. Information and Software Technology 39: 425437 (1997a)
Blackburn, J.D., Scudder, G.D. and Van Wassenhove, L.N. Improving speed and productivity of software development: a global survey of software developers. IEEE Transactions on Software Engineering 22(12): 875885 (1996)
Gray, A. and MacDonell, S.G. Applications of fuzzy logic to software metric models for development effort estimation. In Proceedings of the 1997 Annual Meeting of the North American Fuzzy Information Processing Society - NAFIPS. Syracuse NY, USA, IEEE (1997b) 394-399
Boehm, B.W. Software Engineering Economics. Englewood Cliffs NJ, USA, Prentice-Hall (1981) Boehm, B.W. and Papaccio, P.N. Understanding and controlling software costs. IEEE Transactions on Software Engineering 14(10): 1462-1477 (1988)
Griech, B. and Pomerol, J.-C. Design and implementation of a knowledge-based decision support system for estimating software development work-effort. Journal of Systems Integration 4: 171-184 (1994)
Hakuta, M., Tone, F. and Ohminami, M. A software size estimation model and its evaluation. Journal of Systems and Software 37: 253-263 (1997) Halstead, M.H. Elements of Software Science. New York NY, USA, Elsevier North-Holland (1977) Idri, A. and Abran, A. “Towards a Fuzzy Logic Based Measures for Software Projects Similarity”, In Proc 6th MCSEAI’2000 Maghrebian Conference on Computer Sciences. Fez, Morocco, 2000 Idri, A., Abran, A. and Kjiri, L. “COCOMO Cost Model Using Fuzzy Logic”, In Proceedings of the 7th International Conference on Fuzzy Theory and Technology. New Jersey, 2000 Idri, A. and Abran, A. “A Fuzzy Logic Based Set of Measures for Software Project Similarity: Validation and Possible Improvements”, In Proc 7th Intl Symposium on Software Metrics, London, IEEE Computer Society Press, 2001, 85-96 Idri, A., Abran, A., Khoshgoftaar, T.M. and Robert, S. “Evaluating Software Project Effort by Analogy Based on Linguistic Values”, to appear in Proc 8th Intl Symposium on Software Metrics, Ottawa, IEEE Computer Society Press, 2002, 21-32 Jørgensen, M. and Sjøberg, D.I.K. Impact of effort estimates on software project work. Information and Software Technology 43: 939-948 (2001) Khoshgoftaar, T.M. and Lanning, D.L. A neural network approach for early detection of program modules having high risk in the maintenance phase. Journal of Systems and Software 29: 85-91 (1995)
with cluster analysis. Information & Management 34: 1-9 (1998) Lehman, M.M. Software engineering, the software process and their support. Software Engineering Journal: 243-258 (1991) Lehman, M.M. Software's future: managing evolution. IEEE Software (January-February): 40-44 (1998) Lind, M.R. and Sulek, J.M. Undersizing software systems: third versus fourth generation software development. European Journal of Information Systems 7: 261-268 (1998) Lo, B.W.N. and Gao, X. Assessing software cost estimation models: criteria for accuracy, consistency and regression. Australian Journal of Information Systems 5(1): 30-44 (1997) MacDonell, S.G. Comparative review of functional complexity assessment methods for effort estimation. Software Engineering Journal 9(3): 107-116 (1994) MacDonell, S.G. Establishing relationships between specification size and software process effort in CASE environments. Information and Software Technology 39(1): 35-45 (1997) MacDonell, S.G., Shepperd, M.J. and Sallis, P.J. Metrics for database systems: an empirical study. In Proceedings of the Fourth International Software Metrics Symposium (Metrics'97). Albuquerque NM, USA, IEEE Computer Society Press (1997) 99-107
Kitchenham, B.A. A procedure for analyzing unbalanced datasets. IEEE Transactions on Software Engineering 24(4): 278-301 (1998)
MacDonell, S.G., Gray, A.R. and Calvert, J.M. FULSOME: a fuzzy logic modeling tool for software metricians. In Proceedings of the 1999 Annual Meeting of the North American Fuzzy Information Processing Society - NAFIPS. New York NY, IEEE Computer Society Press (1999) 263-267
Kitchenham, B.A., Pickard, L.M., MacDonell, S.G. and Shepperd, M.J. What accuracy statistics really measure. IEE Proceedings – Software Engineering 148(3): 81-85 (2001)
Mair, C., Kadoda, G., Lefley, M., Phalp, K., Schofield, C., Shepperd, M. and Webster, S. An investigation of machine learning based prediction systems. Journal of Systems and Software 53: 23-29 (2000)
Kosko, B. Fuzzy Engineering. Prentice Hall, New Jersey, 1997
Miyazaki, Y., Terakado, M., Ozaki, K. and Nozaki, H. Robust regression for developing software estimation models. Journal of Systems and Software 27: 3-16 (1994)
Kulkarni, A., Greenspan, J.B., Kriegman, D.A., Logan, J.J. and Roth, T.D. A generic technique for developing a software sizing and effort estimation model. In Proceedings, COMPSAC '88, (1988) 155-161 Kumar, S., Krishna, B.A. and Satsangi, P.S. Fuzzy systems and neural networks in software engineering project management. Journal of Applied Intelligence 4: 31-52 (1994) Laranjeira, L.A. Software size estimation of objectoriented systems. IEEE Transactions on Software Engineering 16(5): 510-522 (1990) Lee, H. A structured methodology for software development effort prediction using the analytic hierarchy process. Journal of Systems and Software 21: 179-186 (1993) Lee, A., Cheng, C.H. and Balakrishnan, J. Software development cost estimation: integrating neural network
Mukhopadhyay, T. and Kekre, S. Software effort models for early estimation of process control applications. IEEE Transactions on Software Engineering 18(10): 915-924 (1992) Murali, C.S. and Sankar, C.S. Issues in estimating realtime data communications software projects. Information and Software Technology 39: 399-402 (1997) Myrtveit, I. and Stensrud, E. A controlled experiment to assess the benefits of estimating with analogy and regression models. IEEE Transactions on Software Engineering 25(4): 510-525 (1999) Myrtveit, I., Stensrud, E. and Olsson, U.H. Analyzing data sets with missing data: an empirical evaluation of imputation methods and likelihood-based methods. IEEE Transactions on Software Engineering 27(11): 999-1013 (2001)
Padberg, F. A probabilistic model for software projects. In Proceedings of the 7th European Software Engineering Conference (ESEC/FSE'99). Toulouse, Springer (1999) 109-126 Pawlak, Z. Rough Sets: Theoretical Aspects of Reasoning About Data. Kluwer, 1991 Piattini, M., Genero, M. and Jiménez, L. A metric-based approach for predicting conceptual data models maintainability. International Journal of Software Engineering and Knowledge Engineering 11(6): 703-729 (2001) Pickard, L., Kitchenham, B. and Linkman, S. An investigation of analysis techniques for software datasets. In Proceedings of the 6th International Software Metrics Symposium. Boca Raton, Florida, IEEE (1999) 130-142 Pickard, L., Kitchenham, B. and Linkman, S.J. Using simulated data sets to compare data analysis techniques used for software cost modelling. IEE Proceedings – Software Engineering 148(6): 165-174 (2001) Pillai, K. and Nair, V.S.S. Statistical analysis of nonstationary software metrics. Information and Software Technology 39: 363-373 (1997) Putnam, D. Size Planner – An automated sizing model, Presented to The 3rd COCOMO User Group Meeting, Pittsburgh (1987) Rosenberg, J. Five easy steps to systematic data handling. IEEE Software (January-February): 75-77 (1998) Sauter, V.L. Intuitive decision-making. Communications of the ACM 42(6): 109-115 (1999) Shepperd, M. and Schofield, C. Estimating software project effort using analogies. IEEE Transactions on Software Engineering 23(12): 736-743 (1997) Shepperd, M.J., Cartwright, M. and Kadoda, G. On building prediction systems for software engineers. Empirical Software Engineering 5: 175-182 (2000) Shepperd, M. and Kadoda, G. Evaluating software prediction techniques using simulation. IEEE Transactions on Software Engineering 27(11): (2001) Shukla, K.K. Neuro-genetic prediction of software development effort. Information and Software Technology 42: 701-713 (2000) Symons, C.R. Function point analysis: difficulties and improvements. IEEE Transactions on Software Engineering 14(1): 2-10 (1988) Symons, C.R. Software Sizing and Estimating: Mk II FPA (Function Point Analysis). Chichester, UK, John Wiley & Sons (1991) Tate, G. and Verner, J.M. Software sizing and costing models: a survey of empirical validation and comparison studies. Journal of Information Technology 5: 12-26 (1990) Tate, G. and Verner, J.M. Approaches to measuring size of application products with CASE tools. Information and Software Technology 33(9): 622-628 (1991)
Turski, W.M. Reference model for smooth growth of software systems. IEEE Transactions on Software Engineering 22(8): 599-600 (1996) Verner, J.M. and Tate, G. A model for software sizing. Journal of Systems and Software 7: 173-177 (1987) Verner, J. and Tate, G. Estimating size and effort in fourth-generation development. IEEE Software: 15-22 (1988) Verner, J. and Tate, G. A software size model. IEEE Transactions on Software Engineering 18(4): 265-278 (1992) Walkerden, F. and Jeffery, R. An empirical study of analogy-based software effort estimation. Empirical Software Engineering 4: 135-158 (1999) Wrigley, C.D. and Dexter, A.S. A model for measuring information system size. MIS Quarterly (June): 245-257 (1991) Yau, C. and Tsoi, H.-L. Modelling the probabilistic behaviour of function point analysis. Information and Software Technology 40: 59-68 (1998)