Journal of Industrial and Systems Engineering Vol. 2, No. 1, pp 75-86 Spring 2008
Some Modifications to Calculate Regression Coefficients in Multiple Linear Regression S. M. Sajadifar 1*, M. Allameh 2 1
Department of Industrial Engineering, University of Science and Culture, P. O. Box: 13145-871, Tehran, Iran
[email protected] 2
Department of Mathematics, Azad University, P. O. Box: 81595-158, Khorasgan, Isfahan, Iran
[email protected] ABSTRACT
In a multiple linear regression model, there are instances where one has to update the regression parameters. In such models as new data become available, by adding one row to the design matrix, the least-squares estimates for the parameters must be updated to reflect the impact of the new data. We will modify two existing methods of calculating regression coefficients in multiple linear regression to make the computations more efficient. By resorting to an initial solution, we first employ the Sherman-Morrison formula to update the inverse of the transpose of the design matrix multiplied by the design matrix. We then modify the calculation of the product of the transpose of design matrix and the design matrix by the Cholesky decomposition method to solve the system. Finally, we compare these two modifications by several appropriate examples. Keywords: Regression, Inverse matrix, Cholesky decomposition, Sherman-Morrison Woodbury formula
1. INTRODUCTION There are some studies in the literature that employ the Sherman–Morrison formula and the corresponding generalization given by the Sherman–Morrison–Woodbury formula to express the inverse of a matrix after a small rank perturbation in terms of the inverse of the original matrix. Hager (1989) presents the history of Sherman-Morrison-Woodbury formulas and discusses some of its applications to statistics, networks, structural analysis, asymptotic analysis, optimization, and partial differential equations. He notes that the Sherman-Morrison-Woodbury formulas express the inverse of a matrix after a small rank perturbation in terms of the inverse of the original matrix. Hager in his paper surveys the history of these formulas and examines some applications where these formulas are helpful. Especially he presents an application of the modified formula to estimate some parameters in a linear model as new data are received.
*
Corresponding Author
Sajadifar and. Allameh
76
Egidia and Maponia (2006) proposed a new direct method to solve linear systems. Their method is based on the Sherman–Morrison formula and uses a finite iterative scheme. As they say, the Sherman–Morrison formula and the corresponding generalization given by the Sherman–Morrison– Woodbury formula have been used in several applications, such as the solution of special linear systems, the solution of linear systems arising in mathematical programming problems and other interesting applications. There are many aspects of Sherman-Morrison-Woodbury formula which have been addressed in the literature (see: Fitzpatrik and Murphy , 1993, Kok Song Chua, 2003 and Lai and Vemuri, 2003). Cholesky decomposition, on the other hand, is widely used for solving linear systems. Pourahmadi, et. al (2007) present a method for simultaneous modeling of Cholesky decomposition of several covariance matrices. They highlight the conceptual and computational advantages of the unconstrained parameterization of the Cholesky decomposition and compare the results with those obtained by the classical spectral (eigenvalue) and variance-correlation decompositions. Some other studies related to employing the Cholesky decomposition for solving linear systems are Kaci et. al (2001), Khamis and Kepler (2002), and Huang et al (2006). Many of the results derived for the simple linear model can be extended to the general linear case. It is not possible to develop the general model conveniently without resorting to matrix notation. We will denote the transpose of an arbitrary matrix A by A t and if A is a square nonsingular matrix, then we denote its inverse by A −1 . Consider the linear regression model
Y = β 0 x0 + β1 x1 + ... + β p x p + ε
(1)
and assume that a response yi is observed at the values xi0,xi1,…,xip, i =1, . . . , n with n > p + 1. That is, assume that p
E ( yi ) =
∑ β j xij ,
j =0
Var ( y i ) = σ 2 , Cov( y i , y k ) = 0 , i ≠ k
It is possible to reformulate the model in matrix notation as follows:
E (Y) = XB
V = σ 2I
where I is the n × n identity matrix, and Y , B , and X are
⎛ x10 K x1 p ⎞ ⎛ β0 ⎞ ⎛ y1 ⎞ ⎟ ⎜ ⎜ ⎟ ⎜ ⎟ M ⎟ Y = ⎜ M ⎟, B =⎜ M ⎟, X = ⎜ M ⎟ ⎜x ⎜β ⎟ ⎜y ⎟ ⎝ n⎠ ⎝ n 0 L xnp ⎠ ⎝ p⎠ The least-square (LS) estimates are the values β j = βˆ j that minimize the quantity
Some Modifications to Calculate Regression…
77 2
p ⎡ ⎤ S = ∑ ⎢ yi − ∑ β j xij ⎥ = (Y − XB)t (Y − XB) i =1 ⎣ j =0 ⎦ n
If we set the first partial derivatives of S with respect to β j 's, j=0,1,…,p, equal to zero and solve the resulting system of equations, then we obtain the LS estimates. Specifically, we should solve the following set of equations: p n ⎡ ⎤ ∂ S = ∑ 2 ⎢ yi − ∑ β j xij ⎥ (− xik ) = 0 , k = 0,1,..., p ∂β k i =1 ⎣ j =0 ⎦
This system of equations is linear in β j ’s, and it is conveniently expressed in matrix notation as
X t Y = X t X.B
(2)
Note that if the matrix Xt X is nonsingular, then there exists a unique solution of the form
B = (Xt X)−1 X t Y
(3)
r
Now suppose we receive new data that gives us the relation c B = y . The new X matrix and
⎡ X⎤ ⎡Y ⎤ Y vector corresponding to the additional data are X new = ⎢ r ⎥ and Y new = ⎢ ⎥ respectively . ⎣c ⎦ ⎣ y⎦ If W denotes the product X t X that is inverted in (3), then the new W corresponding to the new X can be expressed as:
rr W new = W old + c t c
(4)
Therefore, after adding one row to the design matrix, relations (2) and (3) will be changed to:
(Xnew )t Y new = W new .B
(5)
and
B = (W new )−1 (Xnew )t Y new
(6)
Unless indicated otherwise, we will assume that W = Xt X is nonsingular. Of course, a more basic assumption would be that X has full rank (for more detail see Bain and Engelhardt ,1992 or Neter et. al, 1996). Thus, one can easily find that X new has also full rank. Hence the matrix W new = ( X new ) t X new is nonsingular (Hoffman, 1971). To solve this new system, which is obtained after adding new data, one can either evaluate ( W new ) −1 by the inverse matrix modification formula which will be stated in the next section and
Sajadifar and. Allameh
78
from (6) directly obtain the regression coefficients or without evaluating ( W new ) −1 , directly from (5) and by decomposing W new to the product of the lower and upper triangular matrices solve the system and find the regression coefficients by some simple matrix operations. In this paper we employ the other methods to achieve this purpose (Gloub and Von Loan, 1998 and Rencher, 2000). To the best of our knowledge, no work has been done on numerical comparison between Cholesky decomposition method and Sherman-Morrison formula for solving linear systems. In this paper, by some appropriate examples, we compare these two methods for updating the least-square estimates for the parameters of multiple linear regression models and show that the Sherman-Morrison formula has considerably more numerical error than the Cholesky decomposition method. In the next two subsections we will present the Sherman-Morrison formula and the Cholesky decomposition method. In section 2 we will present some useful algorithms followed by two appropriate numerical examples in section 3. 1.1. Sherman-Morrison and Woodbury Formulas Hager (1989) discusses various applications of the Sherman-Morrison and Woodbury formulas. He states the Woodbury and the Sherman-Morrison formula as follows: If both A and I − VA −1U are invertible, then A − UV is invertible and we have
(A − UV)−1 = A −1 + A −1U(I − VA −1U)−1 VA −1
(7)
Suppose that U is n × m and V is m × n . We see that (7) provides a formula for the inverse of a matrix after it is modified by m rank 1 corrections. Notice that the matrix I − VA −1U is m × m . Formula (7) which is frequently called the Woodbury formula is useful in situations where m is much smaller than n and the structure of A is “nice” so that the effort involved in evaluating the correction A −1U(I − VA −1 U)−1 VA −1 relative to the effort involved in inverting a general n × n matrix is small (Hager, 1989). r
r
In the special case where U is a column vector u and V is a row vector v , (7) simplifies to
rr ( A − u v ) −1 = A −1 +
1 −1 r r −1 r −1 r A uv A (1 − v A u )
(8)
Equation (8) is often called the Sherman-Morrison formula. Based on the study of Hager (1989), equation (7) appeared in several papers before Woodbury’s report (1950) while (8) is actually a formula given by Bartlett (1951).
v
r
In the context of our modifications, we can replace the vectors u and v in (8) with the vectors r r “ − c t ” and c respectively and replace the matrix A in (8) with the matrix W to find from (8) that
r r ( W − (−c t c )) −1 = W -1 +
r t r -1 1 -1 r −1 r t W (−c )c W (1 − c W (−c ))
Some Modifications to Calculate Regression…
79
Or r r ( W new ) −1 = ( W + c t c ) −1 = W -1 −
1 -1 r t r -1 r r W c cW (1 + c W −1c t )
(9)
r
where c is the vector of the new data. Since W new is nonsingular then it is invertible and the relation (9) is just right. 1.2. Cholesky Decomposition Method This method converts the symmetric matrix W or W new to a lower triangular matrix L such that W = LLt . With this conversion the system depicted in (2) (or (5)) can be easily solved. This method is based on the following definitions and theorem.
i=1, j=1
j≤n
No
End
Yes j=j+1
No
i≤n
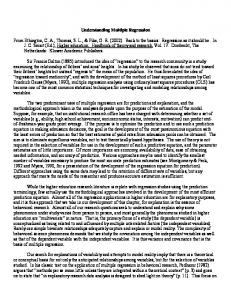
Yes W(i,j)=W(i,j)+x(i).y(j) i=i+1 Figure 1: Flowchart of updating the matrix W Definition: A (complex) n × n matrix A is said to be positive definite if •
A = AH, i.e A is a Hermitian matrix.
•
xHAx > 0 for all x ∈ Cn x ≠ 0
Theorem: (Stoer and Bulirsch, 1993) For each n × n positive definite matrix A there is a unique n×n lower triangular matrix L (lik = 0 for k > i) with lii > 0, i = 0, 1, . . . , n, satisfying A = LLH. If A is real, so is L.
Sajadifar and. Allameh
80
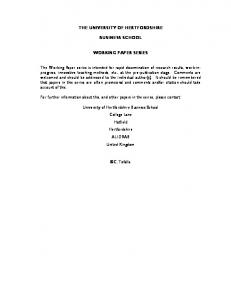
2. ALGORITHMS In this section we will examine two algorithms for updating the design matrix and decomposing the matrix W to lower and upper triangular matrices (for more details see Golub and Von Loan (1989)). Algorithm 1: Updating the general matrix W for computing W new Figure1 shows the algorithm flowchart for computation of the outer product update through which we can compute W new (see (4)). Algorithm 2. Cholesky decomposition: Figure 2 shows the flowchart of the algorithm for decomposing a Hermitian positive definite matrix A n× n .
i=1 No
i= j
B i≤n
No
End
Yes
Yes Fail
j=i
No
x>0 Yes
A
p (i ) =
x=A(i,j)
1 x
k=i-1
A(j,i)=x×p(i)
k ≥1 Yes x=x- A(j,k)×A(i,k)
k=k-1
No
j=j+1
j≤n
Yes
No i=i+1
B
Figure 2: Flowchart of decomposing a Hermitian positive definite matrix A n× n
A
Some Modifications to Calculate Regression…
81
3. NUMERICAL EXAMPLES In this section we present two appropriate examples. We name the initial matrix X1 and once a row is added to it we arrive at matrix X 2 . All calculations are performed with four digits of accuracy for each of the cases under study.
⎡2 − 1 ⎤ ⎡13 1 ⎤ ⎡2 − 1 ⎤ ⎢ ⎥ Example 1. Let X1 = ⎢ and X 2 = 3 1 , then we have X1t X1 = W = ⎢ and ⎥ ⎢ ⎥ 1 2 ⎥⎦ ⎣ ⎣3 1 ⎦ ⎢⎣4 0 ⎦⎥ ⎡0.08 − 0.04 ⎤ (X1t X1 )−1 = W −1 = ⎢ ⎥. ⎣− 0.04 0.52 ⎦ ⎡2.005 ⎤ ⎡22.0649 ⎤ , then X1t Y which we call R will be equal to ⎢ ⎥ . So ⎥ ⎣− 5.9952⎦ ⎣− 4.0001⎦
Now let exact B be B = ⎢ we will have
⎡2.005 ⎤ W −1 .R = ⎢ ⎥ . ⎣− 4.0001⎦ Now with Cholesky decomposition for solving the system depicted in (2) by algorithm 2 one gets
⎡3.6056 X1t X1 = W = ⎢ ⎣0.2774
⎤ ⎡3.6056 0.2774⎤ = LLt ⎥ ⎢ ⎥ 1.3868⎦ ⎣0 1.3868 ⎦ 0
So,
⎡6.1196 ⎤ t Chol. ⎡2.005 ⎤ , LB Ly = R , y = ⎢ = y , then B Chol. = ⎢ ⎥ ⎥. ⎣− 5.5471⎦ ⎣− 3.9999⎦ Comparing the real B and B from Cholesky decomposition method denoted by B Chol. , we can find
⎡29 1 ⎤ ⎥ and if the ⎣1 2⎦
a small error. Now for X 2 by using algorithm 1, we have X t2 X 2 = W new = ⎢
⎡1.2436 ⎤ ⎥ , then R will be ⎣− 0.0101⎦
exact B = ⎢
⎡36.0543⎤ ⎢1.2234 ⎥ . ⎣ ⎦
So from (9),
0.0351 − 0.0175⎤ ⎡0.08 − 0.04⎤ 1 ⎡0.32 ⎤ (X t2 X 2 )−1 = (W new )−1 = ⎢ [0.32 − 0.16] = ⎡⎢ − ⎥ ⎢ ⎥ ⎥ 32 ⎣− 0.04 0.52 ⎦ 1 + ⎣− 0.16⎦ ⎣− 0.0175 0.5088 ⎦ 25 Which leads to
Sajadifar and. Allameh
82
⎡0.0351 − 0.0175⎤ ⎡36.0543⎤ ⎡1.2441 ⎤ B S − M = (W new )−1 R = ⎢ ⎥⎢ ⎥=⎢ ⎥ ⎣− 0.0175 0.5088 ⎦ ⎣1.2234 ⎦ ⎣− 0.0085⎦ where B S − M denotes the solution of the linear system depicted by (6) whose corresponding (W new )−1 comes from the Sherman-Morrison formula. and by the Cholesky decomposition method we have
⎡5.3852 X t2 X 2 = W new = ⎢ ⎣0.1857
⎤ ⎡5.3852 1.4020⎥⎦ ⎢⎣0 0
0.1857⎤ = LLt . ⎥ 1.4020 ⎦
⎡36.0543⎤ ⎡6.6951 ⎤ ⎡1.2436 ⎤ , then y = ⎢ and since Lt B Chol. = y , thus B Chol. = ⎢ ⎥ ⎥ ⎥. ⎣1.2234 ⎦ ⎣− 0.0142⎦ ⎣− 0.0101⎦
So, Ly = ⎢
If eS − M = B − BS − M and eChol. = B − B Chol. denote the errors corresponding to the ShermanMorrison formula and Cholesky decomposition method respectively, we will find in example 1 after receiving new data, that 0 = eChol. < eS − M . Example 2. Let
− 0.1896 1 1.0073 4.7896 ⎤ ⎡ 2.4752 ⎢ − 6.7352 − 8.96 − 0.0001 62.0079 ⎥⎥ 4.2356 ⎢ X1 = ⎢ 47.7868 − 35.5691 − 23.7998 41.0973 15.3714 ⎥ . ⎥ ⎢ 0.4232 ⎥ ⎢− 14.6933 − 32.1950 − 19.0205 23.0820 ⎢⎣ 45.1882 13.2548 28.6621 − 34.2043 − 23.2021⎥⎦ So if B is
B = [1.07 − 0.6742 2 − 0.7352 9]
t
then
R = [− 353.3117 − 13504.8443 − 5941.7900 12540.3001 41483.7387] . t
Now we have B = W −1 .R , thus
0.0019 − 0.1062 − 0.0776 0.0090 ⎤ ⎡ 0.0128 ⎡ 1.0629 ⎤ ⎢ 0.0019 ⎥ ⎢ 0.7382 ⎥ 0.0028 − 0.0135 − 0.0079 0.0014 ⎥ ⎢ ⎢ ⎥ B = ⎢− 0.1062 − 0.0135 0.9020 0.6614 − 0.0760⎥.R = ⎢ 1.7329 ⎥ ⎢ ⎥ ⎢ ⎥ 0.4867 − 0.0556⎥ ⎢− 0.0776 − 0.0079 0.6614 ⎢ 1.0735 ⎥ ⎢⎣ 0.0090 ⎢⎣10.1898⎥⎦ 0.0014 − 0.0760 − 0.0556 0.0067 ⎥⎦
Some Modifications to Calculate Regression…
83
and by the Cholesky decomposition method we have
⎡ 67.7712 ⎤ ⎢ − 8.3788 49.8747 ⎥ ⎢ ⎥ ⎥.Lt . X1t X1 = W = ⎢ 6.0689 37.1235 18.8064 ⎢ ⎥ − 53.1008 − 22.9986 6.5295 ⎢ 1.2044 ⎥ ⎢⎣− 10.7112 − 30.3592 22.3631 54.3754 12.2276⎥⎦ Since Ly = R , thus, y = [− 5.2133 − 271.6513 221.9721 494.1765 110.0586] and t
⎡ 1.0711 ⎤ ⎢− 0.6741⎥ ⎢ ⎥ Lt B = y , then B = ⎢ 1.9904 ⎥ . ⎢ ⎥ ⎢ 0.7281 ⎥ ⎢⎣ 9.0008 ⎥⎦ Now add the row, [25.9999 − 15.0563 9.3248 − 29.7953 − 36.2248] to X1 and call the modified matrix X 2 . If exact B is
B = [5.071 − 3.9942 − 0.0073 1.1123 4.1] , t
then
R = [22936.9659 − 22060.0619 − 10852.5632 20421.8202 22279.2954]
t
From (9) we have
0.0858 − 14.4307 − 10.6841 1.1935 ⎤ ⎡ 1.6900 ⎢ 0.0858 − 0.7326 − 0.5424 0.0044 0.0606 ⎥⎥ ⎢ 1 ⎢− 14.4307 − 0.7326 123.2211 91.2295 − 10.1914⎥ . (W new )−1 = W −1 − 1 + 140.9109 ⎢ ⎥ 67.5437 − 7.5454 ⎥ ⎢ − 10.6841 − 0.5424 91.2295 ⎢⎣ 1.1935 0.0606 − 10.1914 − 7.5454 0.8429 ⎥⎦ So,
0.0013 − 0.0045 − 0.0023 0.0006 ⎤ ⎡ 0.0009 ⎢ 0.0013 0.0028 − 0.0083 − 0.0041 0.0010 ⎥⎥ ⎢ (W new )−1 = ⎢− 0.0045 − 0.0083 0.0337 0.0185 − 0.0042⎥ . ⎢ ⎥ 0.0107 − 0.0024⎥ ⎢− 0.0023 − 0.0041 0.0185 ⎢⎣ 0.0006 0.0010 − 0.0042 − 0.0024 0.0008 ⎥⎦
Sajadifar and. Allameh
84
Now B is
⎡ 7.1991 ⎤ ⎢− 3.3240⎥ ⎢ ⎥ B = (Wnew )−1 R = ⎢ − 1.6186 ⎥ . ⎢ ⎥ ⎢ 1.9620 ⎥ ⎢⎣ 6.0940 ⎥⎦ But by the Cholesky decomposition method one gets
X t2 X 2 = W new
⎡ 72.5874 ⎤ ⎢ − 13.2159 51.0854 ⎥ ⎢ ⎥ ⎥.Lt . = ⎢ 9.0062 34.8299 23.6936 ⎢ ⎥ ⎢ − 9.5479 − 45.7285 − 42.0208 18.2338 ⎥ ⎢⎣− 22.9758 − 23.1503 − 4.0525 58.7350 37.7479⎥⎦
⎡ 315.9910 ⎤ ⎡ 5.0710 ⎤ ⎢− 350.0796⎥ ⎢− 3.9943⎥ ⎢ ⎥ ⎢ ⎥ Ly = R , then y = ⎢ − 63.5279 ⎥ and since Lt BChol. = y , we will have B Chol. = ⎢ − 0.0071⎥ . ⎢ ⎥ ⎢ ⎥ ⎢ 261.0955 ⎥ ⎢ 1.1123 ⎥ ⎢⎣ 154.7663 ⎥⎦ ⎢⎣ 4.1000 ⎥⎦ Table 1. Comparison between regression coefficient results from (9) and Cholesky with the exact solution
eS − M
eChol. .
⎛ 2.0050 ⎞ ⎜⎜ ⎟⎟ ⎝ − 3.9999 ⎠ ⎛ 1.2436 ⎞ ⎜⎜ ⎟⎟ ⎝ − 0.0101⎠ ⎛ 1.0711 ⎞ ⎟ ⎜ ⎜ − 0.6741⎟ ⎜ 1.9904 ⎟ ⎟ ⎜ ⎜ 0.7281 ⎟ ⎟ ⎜ ⎝ 9.0008 ⎠
⎛ 0.0000 ⎞ ⎜⎜ ⎟⎟ ⎝ 0.0000 ⎠ ⎛ 0.0005 ⎞ ⎜⎜ ⎟⎟ ⎝ 0.0016 ⎠ ⎛ 0.0071⎞ ⎟ ⎜ ⎜ 1.4124 ⎟ ⎜ 0.2671⎟ ⎟ ⎜ ⎜ 0.3383 ⎟ ⎟ ⎜ ⎝ 1.1898 ⎠
⎛ 0.0000 ⎞ ⎜⎜ ⎟⎟ ⎝ 0.0002 ⎠ ⎛ 0.0000 ⎞ ⎜⎜ ⎟⎟ ⎝ 0.0000 ⎠ ⎛ 0.0011 ⎞ ⎟ ⎜ ⎜ 0.0001 ⎟ ⎜ 0.0096 ⎟ ⎟ ⎜ ⎜ 0.0071 ⎟ ⎟ ⎜ ⎝ 0.0008 ⎠
⎛ 5.0710 ⎞ ⎟ ⎜ ⎜ − 3.9943 ⎟ ⎜ − 0.0071⎟ ⎟ ⎜ ⎜ 1.1123 ⎟ ⎟ ⎜ ⎝ 4.1000 ⎠
⎛ 2.1281 ⎞ ⎟ ⎜ ⎜ 0.6702 ⎟ ⎜ 1.6113 ⎟ ⎟ ⎜ ⎜ 0.8497 ⎟ ⎟ ⎜ ⎝ 1.9940 ⎠
⎛ 0.0000 ⎞ ⎟ ⎜ ⎜ 0.0001 ⎟ ⎜ 0.0002 ⎟ ⎟ ⎜ ⎜ 0.0000 ⎟ ⎟ ⎜ ⎝ 0.0000 ⎠
Ecaxt B
B from (9)
B from
⎛ 2.0050 ⎞ ⎜⎜ ⎟⎟ ⎝ − 4.0001⎠ ⎛ 1.2436 ⎞ ⎜⎜ ⎟⎟ ⎝ − 0.0101⎠ ⎛ 1.0700 ⎞ ⎟ ⎜ ⎜ − 0.6742 ⎟ ⎜ 2.0000 ⎟ ⎟ ⎜ ⎜ 0.7352 ⎟ ⎟ ⎜ ⎝ 9.0000 ⎠
⎛ 2.0050 ⎞ ⎜⎜ ⎟⎟ ⎝ − 4.0001⎠ ⎛ 1.2441 ⎞ ⎜⎜ ⎟⎟ ⎝ − 0.0085 ⎠ ⎛ 1.0629 ⎞ ⎟ ⎜ ⎜ 0.7382 ⎟ ⎜ 1.7329 ⎟ ⎟ ⎜ ⎜ 1.0735 ⎟ ⎟ ⎜ ⎝10.1898 ⎠
⎛ 5.0710 ⎞ ⎟ ⎜ ⎜ − 3.9942 ⎟ ⎜ − 0.0073 ⎟ ⎟ ⎜ ⎜ 1.1123 ⎟ ⎟ ⎜ ⎝ 4.1000 ⎠
⎛ 7.1991 ⎞ ⎟ ⎜ ⎜ − 3.3240 ⎟ ⎜ − 1.6186 ⎟ ⎟ ⎜ ⎜ 1.9620 ⎟ ⎟ ⎜ ⎝ 6.0940 ⎠
Cholesky Example1 with
X1 Example1 with
X2
Example2 with
X1
Example2 with
X2
Some Modifications to Calculate Regression…
85
Table 1 shows the results of these two examples. As can be seen, in both examples, the errors associated with the Cholesky decomposition are considerably less than the ones associated with the Sherman-Morrison formula. 4. CONCLUSIONS In this paper, using the Sherman-Morrison formula we first updated the (X t X)−1 matrix after receiving new data by resorting to an initial inverse solution and then modified the calculation of (Xt X) by utilizing the Cholesky decomposition method to solve the system. In this study we compared these two modifications. Resorting to some numerical examples it can be seen that using the Cholesky decomposition method to update the regression coefficients leads to considerably less error than using the Sherman-Morrison formula. Especially when the size of predicting variables in the multiple linear regression is too large, this error can lead to an irremediable size in forecasting the response variable. One way to overcome this fault can be resorting to much higher accuracy in performing the calculations. Of course it should be noted that even though the error associated with the method based on the Sherman-Morrison formula is greater than the one incurred by the Cholesky decomposition method, the former method has the advantage of dealing with linear relations only. This fact can significantly affect the time complexity corresponding to these two methods. REFERENCES [1]
Bain L.J., Engelhardt M. (1992), Introduction to Probability and Mathematical Statistics; 2nd edition, PWS-KENT.
[2]
Bartlett M.S. (1951), An Inverse Matrix Adjustment Arising in Discriminant analysis; Ann. Math. Statist 22; 107-111.
[3]
Egidi N., Maponi P. (2006), A Sherman-Morrison Approach to the Solution of Linear Systems; Journal of Computational and Applied Mathematics 189; 703-718.
[4]
Fitzpatrik P., Murphy C.C. (1993), Solution of Linear Systems of Equations in the Presence of Two Transient Hardware Faults; IEE Proceedings E: Computers and Digital Techniques 140(5); 247-254.
[5]
Golub G.H., Von Loan C.F. (1989), Matrix computations, 2nd edition; The Johns Hopkins University press.
[6]
Hager W.W. (1989), updating the Inverse of a Matrix; SIREV 31(2); 221-239.
[7]
Hoffman K. (1971), Linear Algebra, 2nd edition, Prentice Hall, Inc.,NJ.
[8]
Huang J. Z., Liu N., Pourahmadi M. and Liu L. (2006), Covariance Matrix Selection and Estimation Via Penalized Normal Likelihood, Biometrika; 93(1); 85-98.
[9]
Kaci M., Sadoun T., Moussaceb K. and Akvoune N. (2001), Modelling of degradation of unstabilized and HALS-stabilized LDPE films under thermo-oxidation and natural weathering conditions; Journal of Applied Polymer Science; 82(13); 3284-3292.
[10]
Khamis H. and Kepler M. (2002), Multivariate Cubic Spline Smoothing in Multiple Prediction; Computer Methods and Programs in biomedicine; 67(2); 131-136
86
Sajadifar and. Allameh
[11]
Kok Song Chua (2003), Efficient Computations for Large Least Square Support Vector Machine Classifiers; Pattern Recognition Letters; 24(1-3); 75-80.
[12]
Lai S. H. and Vemuri B. C. (2003), Sherman-Morrison-Woodbury-Based Algorithms for the Surface Smoothing Problem; Linear Algebra and its Application; 265(1-3); 203-229.
[13]
Neter J., Kutner M. H., Nachtsheim C. J. and Wasserman W. (1996), Applied linear regression models, 3rd edition, McGraw-Hill; New York
[14]
Pourahmadi M., Daniels M. J. and Park T. (2007), Simultaneous Modelling of the Cholesky Decomposition of Several Covariance Matrices; Journal of Multivariate Analysis; 98(3); 568-587.
[15]
Rencher, A., C. (2000), Linear Models in Statistics, John Wiley & Sons, New York.
[16]
Stoer J. and Bulirsch R. (1993), Introduction to Numerical analysis, 2nd edition, Springer, New York.
[17]
Woodbury M. (1950), Inverting Modified Matrices; Memorandom Rept. 42, Statistical Research Group, Princeton University, Princeton, NJ.