{firstname.lastname}@cl.cam.ac.uk. Abstract ... Soroban allows developers to instrument applications, such as web ... from running the application in a non-virtualized envi- ronment. ... plore flexible new pricing models that set price points as.
Soroban: Attributing Latency in Virtualized Environments James Snee, Lucian Carata, Oliver R. A. Chick, Ripduman Sohan, Ramsey M. Faragher, Andrew Rice, and Andy Hopper Computer Laboratory, University of Cambridge, UK {firstname.lastname}@cl.cam.ac.uk
Abstract Applications executing on a hypervisor or in a container experience a lack of performance isolation from other services executing on shared resources. Latencysensitive applications executing in the cloud therefore have highly-variable response times, yet attributing the additional latency caused by virtualization overheads on individual requests is an unsolved problem. We present Soroban, a framework for attributing latency to either the cloud provider or their customer. Soroban allows developers to instrument applications, such as web servers to determine, for each request, how much of the latency is due to the cloud provider, and how much is due to the consumer’s application or service. With this support Soroban enables cloud-providers to provision based on acceptable-latencies, adopt finegrained charging levels that reflect latency demands of users and attribute performance anomalies to either the cloud provider or their consumer. We apply Soroban to a HTTP server and show that it identifies when the cause of latency is due to a provider-induced activity, such as underprovisioning a host, or due to the software run by the customer.
1
Introduction
The rise of cloud computing can primarily be attributed to multi-tenant hosting. Typically, multiple services are co-located together with the hypervisor or containerization mechanism scheduling services as necessary. While co-hosting increases utilization, it introduces a number of disadvantages. In particular: (i) The hypervisor introduces an additional (un-coordinated) level of indirection with respect to process scheduling. This property makes the service time of requests unpredictable. (ii) The service performance is influenced by overall system state of which individual services have no information, e.g. number of other services hosted, time scheduled in and contention on shared resources. Given the lack of mutual
performance isolation, it is common for co-located services to affect each other’s performance. While there has been previous work in improving the scheduling problem [8, 21], the lack of performance isolation remains. This has lead to a situation where pinpointing the reasons for performance irregularities in cloud environments can be challenging. In particular, it is difficult to ascertain whether performance anomalies are being caused by the behaviour of the running service (e.g. garbage collection) or if they are due to external artifacts (e.g. CPU starvation). Current techniques for characterizing system-wide effects in cloud platforms rely on benchmarking virtual machines to measure their performance. However, the utility of benchmarking is reduced by several factors: (i) benchmarks are typically not representative of true workloads [12, 20] (ii) benchmarks do not typically model real-world events that may significantly impact performance (e.g. domain creation, boot storms, a domain being slashdotted) and (iii) while benchmarks reveal a measurement of the throughput or latency of the system, they do not provide a root-cause analysis for performance anomalies. To this end, we present Soroban, a framework for attribution of latency to either the cloud provider or their customer. With Soroban programs executing on virtualized hardware can be instrumented to indicate the semantics of processing actions, for example serving a request. Soroban then monitors the servicing of each action in the system and records all latency-influencing actions performed on the virtual machine or container by the cloud provider (e.g. an HTTP request taking a VM exit whilst being serviced). Furthermore, Soroban reports how much of the latency in serving each individual action is attributable to the cloud provider and how much is due to the consumer’s software by comparing online latency against a machine-learning model constructed from running the application in a non-virtualized environment. We presently have implementations of Soroban
for the Xen hypervisor [5] and Linux Containers. In summary the contributions of this paper are: 1. We show that by exposing the quality of service given to a virtual machine or container we can use supervised machine learning to determine the effect of virtualization on the latency of individual actions, such as serving HTTP requests (§3). 2. We evaluate Soroban, showing that it can attribute an increase in server latency to cloud-provider actions, such as performing an antivirus scan (§4).
2
Soroban
Soroban allows services running in a virtualized environment to determine how much of their server-side latency is attributable to the underlying cloud infrastructure and how much is due to their own software stack. For instance, if a cloud provider creates a boot storm it induces latency on its clients, whereas if the load being served by the virtual machine increases, the latency will be caused by the client. Users deploy Soroban by instrumenting their application using the Soroban API. With this API services are able to receive event information specific to the underlying virtualization platform (e.g. in Xen we provide VM entry and VM exit events). Associated with every event we provide enough resource consumption information (e.g. cycle-count at time of event) so that Soroban can reconstruct the impact on latency of the hypervisor or container. Thus, services are able to monitor system-wide effects that impact the performance of their actions.
2.1
Motivating Soroban
We highlight three motivating scenarios where Soroban can be applied in production cloud environments: Dynamic allocation. With Soroban, consumers can specify the upper bound on performance overhead that is tolerable. This allows the provider to react to users in a more accurate manner by allocating resources according to price and demand. QoS-based, fine-grained charging. Current charging models are coarse-grained. Physical resources are priced at the unit level and users pay on a per-unitconsumed basis. However, this model does not account for the quality-of-service that is finally provided. A user is charged the same amount per-unit regardless of the effects imposed by the hypervisor. For example, a user will pay the same amount to service two HTTP requests even if one takes twice as long to complete due to hypervisor delays. With Soroban it is possible for providers to explore flexible new pricing models that set price points as a function of user demand and overall system-imposed
1 2 3 4 5 6 7 8
int sd = srbn_start () ; ... srbn_yield ( sd ) ; ... srbn_resume ( sd ) ; ... srbn_end ( sd ) ; auto & srbn_data { srbn_read ( sd ) };
Figure 1: The Soroban API allows applications to be instrumented to mark the start, and end of requests.
delay, leading to more accurate and representative charging models. Attributing performance anomalies. Slow server responses are a principal component of end-to-end latency for client-server systems [9]. Soroban attributes slow responses to either the cloud provider or the customer software stack. Consumers can use this information to purchase more computing resource or focus their efforts on modifying their software. Soroban enables accurate pinpointing of performance anomalies at a request level enabling both providers and users to obtain a detailed fingerprint on online service performance.
3
Implementation
We currently maintain two implementations of Soroban: one for virtual machines running on Xen and one for Docker containers. Most of the code is shared between those implementations, keeping the virtualizationspecific code targeted at capturing specific Xen or container scheduling events. In this section we outline the implementation details necessary to support Soroban on these platforms.
3.1
Design
Applications are instrumented to mark the start and end of each action by adding a call to the Soroban library. The Soroban library tracks the scheduling events performed by Xen or the Linux kernel using regions of memory shared either with the hypervisor or with the Linux kernel. At the end of processing a request the application can read back all those events that affected its performance. Moreover, the Soroban library provides a measure of how much of that request’s server-side latency is caused by executing in the cloud, rather than on bare metal. This measure is ideally independent of load in the virtual machine, or container, and dependent on the state of the host machine.
Service API
3.3
Xen Implementation
We modify Xen to export to each domain data about all scheduling events on each of its vCPUs. In particular at every VM entry, and VM exit, we expose a timestamp, cycle count, the credit of the vCPU, the number of pending events in the event channel, the number of yields, and the number of blocks. These data are exposed to the guest using shared hypervisor memory, and are read by the guest Soroban API. We therefore do not add the overhead of increased interrupts on each vCPU scheduling activity.
3.4
Docker Implementation
A Linux scheduler instrumentation layer (∼ 200 LoC) interposes the host OS and tracks scheduling events that interact with the Soroban-enabled processes. The aggregated events are accessible to the Soroban library via shared memory.
3.5
Latency Attribution
Soroban uses data from Xen and Docker to attribute proportions of the latency of each individual action to the cloud provider or the user’s software stack.
1e8 1.2
66%
1.0
140 120
0.8
100
0.6
30%
80 60
0.4
40
0.2 0.0
160
20 0.8
1.0
1.2
1.4
Server-side latency (cycles)
1.6 1e8
0
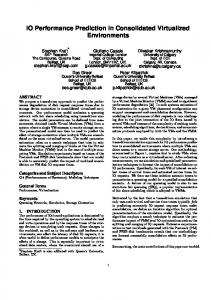
Figure 2: Baseline Xen scheduling measurements for lighttpd requests, under low resource contention. The solid line is x = y, the line of complete attribution (time scheduled out equals server-side latency). The two major clusters represent request latencies for which a constant proportion (66% and 30%) can be attributed to the time being scheduled-out. In principle, a hypervisor should fairly divide resources amongst contending VMs, with the latency of a particular service increasing proportionally to the time its VM has been scheduled out. Simply measuring the VM scheduled-out time for each application activity could thus be seen as an easy solution to the attribution problem. However, Figure 2 shows a more complicated story: because of variations in concurrent workloads running on the same infrastructure and the adaptability of the scheduler, the time scheduled out can vary substantially (for example, going from 30% to 66%) without any increases in server-side latency. As a simple example of how this is possible, being scheduled out while a server process is blocked on a file descriptor operation will not add to the final latency. Nevertheless, this also implies that looking at a given (latency, sched-out) pair alone, one can not precisely determine how much latency is added by running alongside other services in a virtualized environment. Instead, Soroban uses supervised machine learning to build a slowdown attribution model from multiple metrics, using both PMU data (cycles, cache data, per-subsystem kernel measurements) and scheduler information (time scheduled out, number of blocks, yields, number of events on the event channel). We use a Gaussian process regression that, after training, can map the set of measurements gathered for a given request to a number representing the latency introduced by the cloud provider for that request (or any other application activity). The ground truth data for the training is obtained by measuring the shift between the latency distributions of the service running uncontended on bare metal, and it running in a virtualized environment (either Xen or Docker). Concretely, the shift, δlat is computed by taking
xen # schedules due to blocking
Applications interact with Soroban via an API, designed to be minimally invasive and requiring little integration effort. Figure 1 outlines the API. Services use srbn start (1) and srbn end (7) to start and stop tracking resource consumption. It is expected that the service will use those calls to signal a logical event where resource allocation for a particular action (e.g. serving a HTTP request) will start and stop. A call to srbn start (1) returns an unique token for identifying the current application action to which measurements should be attributed. Services distinguish between simultaneous logical events through multiple calls to the start and end operations, thereby enabling differentiation based on service classification (e.g. per user). A single user-level thread can differentiate between logical actions via the srbn yield (3) and srbn resume (5) calls, which allow user-level applications to signal that subsequent system calls should be attributed to a different logical event [3]. User-level applications access a single logical event’s resource usage via the srbn read (8) call which returns a breakdown of the resources consumed by the hypervisor. In particular, applications access a single srbn data->cloud latency field which contains the amount of latency for the event that is attributable to the hypervisor.
Xen scheduling measurements Xen scheduled-out (cycles)
3.2
the difference between the latency of requests in the virtualized experiment and the latency of requests from the bare-metal experiment that are in the same percentile. The Gaussian process regression is then trained to learn the relationships between each multi-dimensional feature vector containing the measurements for a particular request in the virtualized experiment (m1 , m2 , m3 , ...) and the corresponding δlat . To ensure accurate predictions from the model, virtualized measurements are taken whilst increasing the number of other guests on the server, introducing resource contention with a mixed IO and CPU load. The whole training process need only be performed once at a coarse-grained level, based on all requests served by the virtual machine. However, whenever there are classes of requests that execute differing loads on the hypervisor, a new training set could be taken for increased precision. The final output of this process is a model that when given a new vector of measurements, returns the predicted latency increase attributed to the current virtualization load, and a confidence interval. This scheme is robust to differences between bare-metal environments and virtualized environments—such as a micro VM executing on a high-end server—in that Soroban reports a large overhead imposed by virtualizing the application, which can be reduced by purchasing a larger VM.
4
Evaluation
In this section we focus on identifying how well our proposed slowdown attribution model works in a controlled setup that mimics some of the conditions present in cloud environments, like the contention on resources or the existence of periodic running tasks. We use a controlled setup as some important metrics (scheduling information, pending interrupts) are not currently accessible to the application in third party cloud solutions. However, the proposed model itself is sufficiently general to allow for extensibility and consider more complex scenarios (feature vectors with more dimensions, realistic workloads and contention). We explore how changes in the distribution of request latencies can be attributed to the cloud provider or to client application/VM activities. We run all workloads on a machine with an Intel Xeon E3-1230 V2 @ 3.3 GHz and depending on the virtualization type being evaluated, either Xen-unstable (compiled from source) in PV mode or Docker containers. In all cases we use Ubuntu 14.10 with the 3.19 upstream kernel compiled from the Linus branch. For Xen, the unstable branch has been chosen to make use of the Credit2 Scheduler, which is optimized for low latency. We instrument lighttpd with the Soroban API to report when individual requests start, stop being processed or are multiplexed by the main event loop. At runtime,
Figure 3: As the load on hypervisor/containers system increases, there is an increase in the latency at which requests are served. Soroban only identifies the cause of the latency as being due to the cloud provider when the hypervisor or host OS is under load. Soroban can aggregate per-request resource consumption metrics and events, from both the OS and the hypervisor. This data can be read back in real time by lighttpd after a response has been sent or alternatively saved for later analysis. This builds the per-request feature vectors required by our latency attribution model. We then perform the training stage outlined in §3.5. Understanding request slowdowns. In order to verify that our model is reasonable and useful, we run experiments by varying the number of virtualized guests running on the same host (and executing CPU-intensive tasks) and the load within the guest running lighttpd and serving requests. In each case we obtain measurements for approximately 50000 requests, and use the regression from the training phase to predict how much of the observed tail latency is due to the virtualization. The results are summarized in Figure 3. Each cell shows the estimated number of cycles that are attributable to the cloud provider for increasing the tail (99th percentile) latency of requests. Similar heatmaps could be used to investigate the causes of shifts in median latency or in other measured features. Using the full Soroban results, a complete image describing the slowdown caused by the hypervisor can be obtained for the entire lighttpd latency distribution, with plots similar to Figure 4 being available for each cell in the heatmap. The request latency attributed to both Xen and Docker, as reported by Soroban, increases proportionally to the hypervisor contention (more VMs and containers), for any given guest load (every column in Figure 3). In addition, for a given number of concurrent VMs or containers, as the load on the virtual machine increases, we do not see a significant change in attribution metrics, suggesting that Soroban does not attribute increases in guest load to the cloud provider. Periodic events. Using the same training dataset, we also explore whether common repetitive tasks that exe-
CDFs of hypervisor-induced latency 1.0 0.8 0.6 0.4
Low contention AV scan running
0.2 0.0 30
35
40
45
50
55
60
65
Hypervisor-induced latency (ms)
Figure 4: When the cloud provider executes an antivirus scan the tail latency of serving HTTP requests increases from 36ms to 47ms. Soroban correctly attributes this increase in latency to the cloud provider. cute on other VMs or in dom0 and slow down requests can be detected and properly classified using our model. For this purpose, we compare the slowdown caused by the hypervisor in two cases (Figure 4): The first case—running a realistic mix of CPU/Network and I/O workloads on sixteen other VMs sharing the same host, but keeping overall contention low (30%); The second case—running a periodic virus scan (clamav) in dom0. As expected, we are able to see a shift in the hypervisorinduced latency, with the 90th percentile shifting from 36 ms to 47 ms (with lighttpd serving 500 KB files). In the general case, we believe that the ability to understand fine-grained behavior under virtualization, such as in the examples above would offer ample opportunities for application optimization in cloud environments. The overheads imposed by Soroban on lighttpd are not statistically significant, and would therefore not prohibit any such usecases.
5
Related Work
Existing cloud service providers bill users based on their use of coarse-grained system resources such as the number of vCPUs or amount of memory. But work has suggested that this often leads to an underprovisioning of resources, something that AutoPro attempts to overcome by provisioning machines based on performance requirements [6]. Agmon et al. predict new markets for fine-grained performance and resource requirements [1], with pricing that encourages users to accurately predict the requirements of their application’s actions [2]. Soroban supports these systems by providing a transparent layer between the provider and customer, allowing the user to quantify the performance impact the provider has on individual system actions, improving billing procedures [14]. The performance impact of virtualization has been well investigated [7]. Work to overcome this has looked
at finding compositions of applications that interact well together [16, 15], but this requires accurate indicators of provider induced overhead and often falls back to observing overall system throughput, suggesting that better predictors be found. Understanding the performance of individual actions of a system provides a much more informative description of its behavior, and work has been carried out into investigating variance in request based systems [19]. Whilst existing work can detect cloud providers causing consistent, system-wide overheads, they cannot determine per-action impact on latency over a short time period with unstable interference [18], so are only suitable for performance anomalies [10]. Similarly, techniques for detecting changes in data collected over a long period of time exist [22]. Soroban’s API allows users to annotate actions in the system and propagate IDs similarly to X-Trace [13], without requiring behavior traces to be re-built afterwards such as in Magpie [4]. This provides a much more accurate view of the overhead imposed by service providers on individual actions than external measures such as throughput or coarse-grained system call tracking. Soroban exposes the behavior of the underlying hypervisor layer’s scheduler to the guest, using a similar technique to existing work that investigates the virtualization of the CPU’s PMU [11, 17].
6
Conclusion
We have presented Soroban, a framework that allows servers hosted in either a virtual machine, or a container, to determine the latency overhead imposed by the cloud provider on serving individual actions. Soroban exposes additional information from the hypervisor or container system that allows clients to determine the quality of service that they received from their provider. Using this information, Soroban reports the overhead imposed on each action due to being hosted on cloud infrastructure, which may be contended.
7
Acknowledgments
This work was principally supported by internal funds from the Computer Laboratory at the University of Cambridge; and also by the Engineering and Physical Sciences Research Council [grant number EP/K503009/1]. The raw data and code required for reproducing the figures in this paper is available.1 We aim to release the source code for Soroban along with a more complete technical description as part of a full-length paper in 2016. 1 https://www.cl.cam.ac.uk/research/dtg/rscfl
8
Discussion Topics
Claims: We have shown the technical feasibility of a low-overhead system for collecting and correctly attributing resource consumption in cloud services. This system operates by providing services real-time access to key metrics describing system state. Point 1: Useful for datacenter wide resource consumption? Our proof-of-concept implementation only operates on a single host. Whilst existing techniques can account for network delays in serving requests [9] we should like to attribute resource consumption across all the elements in a datacenter at a logical request level. We believe providing this information to service operators and users will result in increased efficiency for both parties. In order to be useful across an entire datacenter we believe it is necessary to instrument all data and control paths. Specifically, we expect that end-to-end resource consumption support will only be possible with the support of intermediate processing elements in the data plane (switches, routers and SAN and NAS devices). We expect the major problems that are required to be solved are: (i) How to represent a logical action as a series of discrete related sub-actions or sub-events. (ii) Correlating resource consumption metrics across these sub-events. (iii) Providing this support with acceptable (ideally ≤ 10%) space and time overheads and (iv) Extending this mechanism across the entire data plane in a homogeneous manner. Point 2: A basis for tiered charging? This work can be used as the basis for finer-grained charging models. In particular, we believe it supports the creation of efficient tiered charging models where users can be grouped not only by the amount of resource they require but also by how quickly they require it. While a complete design of such a system would require a supporting economic model to ensure fair and equitable resource allocation, it should be possible to retrofit a simplified implementation of the idea as a basic Dutch auction mechanism in existing platforms. Point 3: Pitfalls and limitations in Soroban. Soroban requires that applications are modified to indicate the start and end of every action that should be accounted for. This requires additional engineering effort for both cloud providers and application developers. Moreover, we also require a training exercise to be performed with data from running the application on baremetal, executing the relevant codepaths. An alternative to this approach is that the cloud provider temporarily migrates virtual machines onto a dedicated host, and allocates all resources to the virtual machine whilst training Soroban. Rather than reporting the total overheads of virtualization such a scheme would report the overhead
Figure 5: Soroban shows the poor performance isolation properties of containers running multiple processes (workers). This limits the ability of Soroban to correctly attribute increases in latency to guest activities. of not having purchased the cloud provider’s premium service. Some of the benefits of Soroban could be achieved even without performing machine learning, at the expense of doing manual statistical analysis on multidimensional measurement data, while also having a good knowledge about the low-level behavior of the application under test. Further issues may arise if cloud providers are reluctant to expose hypervisor memory or metrics to guests. The lower performance isolation of some virtualization methods is also a concern. For example (Figure 5) shows the poor isolation of containers when running multiple worker processes to generate load, as opposed to the one worker case seen in Figure 3. This is caused by the kernel scheduler being shared between all containers running on the same machine, and translates into a poor ability to distinguish between service and cloud provider-induced latency (significant changes within every line of the heatmap). Point 4: Integration into existing platforms? Integrating Soroban into existing systems is a necessary component for its widescale adoption but it is still an open question whether system-wide adoption of the platform would be feasible across current production cloud platforms. In particular, it is an open question whether there is a business demand for this platform and how it would be integrated into user business models. Point 5: Practicality of instrumentation. Soroban requires that developers augment their application with instrumentation that specifies the semantics of processing a request. At the moment this instrumentation is manual and restricted to a single machine. Typically, cloud services have a distributed model with many (virtual) machines serving requests. We are investigating ways of extending Soroban to operate across such distributed systems whilst minimizing the need for instrumentation. For instance, can Soroban be combined with Protocol Buffers or Apache Thrift to infer the start and end of requests?
References [1] AGMON B EN -Y EHUDA , O., B EN -Y EHUDA , M., S CHUSTER , A., AND T SAFRIR , D. The resource-as-a-service (raas) cloud. In Proceedings of the 4th USENIX Conference on Hot Topics in Cloud Ccomputing (Berkeley, CA, USA, 2012), HotCloud’12, USENIX Association, pp. 12–12. [2] AGMON B EN -Y EHUDA , O., P OSENER , E., B EN -Y EHUDA , M., S CHUSTER , A., AND M U ’ ALEM , A. Ginseng: Market-driven memory allocation. In Proceedings of the 10th ACM SIGPLAN/SIGOPS International Conference on Virtual Execution Environments (New York, NY, USA, 2014), VEE ’14, ACM, pp. 41–52. [3] BANGA , G., D RUSCHEL , P., AND M OGUL , J. C. Resource containers: A new facility for resource management in server systems. In Proceedings of the Third Symposium on Operating Systems Design and Implementation (Berkeley, CA, USA, 1999), OSDI ’99, USENIX Association, pp. 45–58. [4] BARHAM , P., D ONNELLY, A., I SAACS , R., AND M ORTIER , R. Using magpie for request extraction and workload modelling. In Proceedings of the 6th Conference on Symposium on Opearting Systems Design & Implementation - Volume 6 (Berkeley, CA, USA, 2004), OSDI’04, USENIX Association, pp. 18–18. [5] BARHAM , P., D RAGOVIC , B., F RASER , K., H AND , S., H ARRIS , T., H O , A., N EUGEBAUER , R., P RATT, I., AND WARFIELD , A. Xen and the art of virtualization. In Proceedings of the Nineteenth ACM Symposium on Operating Systems Principles (New York, NY, USA, 2003), SOSP ’03, ACM, pp. 164–177. [6] BARTOLINI , D. B., S IRONI , F., S CIUTO , D., AND S ANTAM BROGIO , M. D. Automated fine-grained cpu provisioning for virtual machines. ACM Trans. Archit. Code Optim. 11, 3 (July 2014), 27:1–27:25. [7] C HERKASOVA , L., AND G ARDNER , R. Measuring cpu overhead for i/o processing in the xen virtual machine monitor. In Proceedings of the Annual Conference on USENIX Annual Technical Conference (Berkeley, CA, USA, 2005), ATEC ’05, USENIX Association, pp. 24–24. [8] C HERKASOVA , L., G UPTA , D., AND VAHDAT, A. Comparison of the three cpu schedulers in xen. SIGMETRICS Performance Evaluation Review 35, 2 (2007), 42–51. [9] C HOW, M., M EISNER , D., F LINN , J., P EEK , D., AND W ENISCH , T. F. The mystery machine: End-to-end performance analysis of large-scale internet services. In Proceedings of the 11th USENIX Conference on Operating Systems Design and Implementation (Berkeley, CA, USA, 2014), OSDI’14, USENIX Association, pp. 217–231. [10] D EAN , D. J., N GUYEN , H., WANG , P., AND G U , X. Perfcompass: Toward runtime performance anomaly fault localization for infrastructure-as-a-service clouds. In Proceedings of the 6th USENIX Conference on Hot Topics in Cloud Computing (Berkeley, CA, USA, 2014), HotCloud’14, USENIX Association, pp. 16–16. [11] D U , J., S EHRAWAT, N., AND Z WAENEPOEL , W. Performance profiling of virtual machines. In Proceedings of the 7th ACM SIGPLAN/SIGOPS International Conference on Virtual Execution Environments (New York, NY, USA, 2011), VEE ’11, ACM, pp. 3–14. [12] E LLARD , D., AND S ELTZER , M. Nfs tricks and benchmarking traps. In Proceedings of the Annual Conference on USENIX Annual Technical Conference (Berkeley, CA, USA, 2003), ATEC ’03, USENIX Association, pp. 16–16. [13] F ONSECA , R., P ORTER , G., K ATZ , R. H., S HENKER , S., AND S TOICA , I. X-trace: A pervasive network tracing framework. In
Proceedings of the 4th USENIX Conference on Networked Systems Design & Implementation (Berkeley, CA, USA, 2007), NSDI’07, USENIX Association, pp. 20–20. [14] J ELLINEK , R., Z HAI , Y., R ISTENPART, T., AND S WIFT, M. A day late and a dollar short: The case for research on cloud billing systems. In Proceedings of the 6th USENIX Conference on Hot Topics in Cloud Computing (Berkeley, CA, USA, 2014), HotCloud’14, USENIX Association, pp. 21–21. [15] L LOYD , W., PALLICKARA , S., DAVID , O., LYON , J., A RABI , M., AND ROJAS , K. Performance modeling to support multi-tier application deployment to infrastructure-as-a-service clouds. In Proceedings of the 2012 IEEE/ACM Fifth International Conference on Utility and Cloud Computing (Washington, DC, USA, 2012), UCC ’12, IEEE Computer Society, pp. 73–80. [16] NATHUJI , R., K ANSAL , A., AND G HAFFARKHAH , A. Qclouds: Managing performance interference effects for qos-aware clouds. In Proceedings of the 5th European Conference on Computer Systems (New York, NY, USA, 2010), EuroSys ’10, ACM, pp. 237–250. [17] N IKOLAEV, R., AND BACK , G. Perfctr-xen: A framework for performance counter virtualization. In Proceedings of the 7th ACM SIGPLAN/SIGOPS International Conference on Virtual Execution Environments (New York, NY, USA, 2011), VEE ’11, ACM, pp. 15–26. [18] N OVAKOVI C´ , D., VASI C´ , N., N OVAKOVI C´ , S., KOSTI C´ , D., AND B IANCHINI , R. Deepdive: Transparently identifying and managing performance interference in virtualized environments. In Presented as part of the 2013 USENIX Annual Technical Conference (USENIX ATC 13) (San Jose, CA, 2013), USENIX, pp. 219–230. [19] S AMBASIVAN , R. R., AND G ANGER , G. R. Automated diagnosis without predictability is a recipe for failure. In Proceedings of the 4th USENIX Conference on Hot Topics in Cloud Ccomputing (Berkeley, CA, USA, 2012), HotCloud’12, USENIX Association, pp. 21–21. [20] S CHWARZKOPF, M., M URRAY, D. G., AND H AND , S. The seven deadly sins of cloud computing research. In Proceedings of the 4th USENIX Conference on Hot Topics in Cloud Ccomputing (Berkeley, CA, USA, 2012), HotCloud’12, USENIX Association, pp. 1–1. [21] S HIEH , A., K ANDULA , S., G REENBERG , A., AND K IM , C. Seawall: Performance isolation for cloud datacenter networks. In Proceedings of the 2Nd USENIX Conference on Hot Topics in Cloud Computing (Berkeley, CA, USA, 2010), HotCloud’10, USENIX Association, pp. 1–1. [22] VALLIS , O., H OCHENBAUM , J., AND K EJARIWAL , A. A novel technique for long-term anomaly detection in the cloud. In Proceedings of the 6th USENIX Conference on Hot Topics in Cloud Computing (Berkeley, CA, USA, 2014), HotCloud’14, USENIX Association, pp. 15–15.