In this paper we investigate an acoustic speaker localization method based on a set of microphone arrays distributed on the walls and at the ceiling of a living ...
2008 International Workshop on Nonlinear Circuits and Signal Processing NCSP'08, Gold Coast, Australia, March 6-8, 2008
Sound source localization by distributed microphone network Alberto Yoshihiro Nakano, Longbiao Wang, Kazumasa Yamamoto, Seiichi Nakagawa Toyohashi University of Technology 1-1, Hibarigaoka, Tenpaku-cho, Toyohashi, Aichi, 441-8580, Japan Phone:+81-532-44-6777 /FAX: +81-532-44-6757 Email: {alberto, wang, kyama, nakagawa}@slp.ics.tut.ac.jp
Abstract In this paper we investigate an acoustic speaker localization method based on a set of microphone arrays distributed on the walls and at the ceiling of a living room. The time delay of arrival (TDOA) of microphone pairs of each array is estimated and combined to determine the optimal source position by geometrical derivation. We try to improve this localization method using power and position estimation constraints at each microphone array. Experimental results show the validity of these constraints, but we observe that the position estimation is high dependent of the environment and the speaker directivity, that is, under high background noise, high reverberation and lack of direct path propagation to the array, the localization may fail. 1. Introduction Acoustic source localization using microphone arrays is an important task in many practical applications, for instance, videoconferencing, hands-free communication systems, and human-machine interaction [1]. Many source localization methods were proposed, like SRP-PHAT (Steered Response Power - Phase Transform) and this variations [2] based on the maximization of power obtained by steering the microphone array to all potential source positions, and methods based on TDOA [3] [4] where the optimal position is estimated by geometrical triangularization using time delays of microphone pairs of an array. We focus our analysis on TDOA approach because it requires low computational processing desired for real time application. Position estimation based on TDOA methods are high dependent of the correct estimation of the delays, a poor estimative causes a wrong position estimation. In this work GCC-PHAT (Generalized Cross Correlation Phase Transform) method is employed in TDOA estimation [4], in this method the time delay corresponds to the timelag which maximizes a cross-correlation function. In [5] a more robust cross-correlation function is obtained combining results of different frames of a signal. However, a high correlated noise level at the microphone of an array yields a wrong TDOA estimation. Thus, to improve this method only reli-
able frames, frames with high signal-to-noise ratio (SNR) are used in the estimation, where noise level can be estimated at no voice activity frames. In practice, reliable frames are determined indirectly by TDOA results. When TDOA leads to zero delay over all microphone pairs it means that the propagated wave arrives in phase at the array. This situation is only possible when the source is located far away to the array, although in reality the source is at a relative near distance. This wrong estimation can be due to the correlated noise level at the array. Thus, removing frames where all TDOAs of microphone pairs are zero is an indirect way to consider only frames with high SNR. Once TDOA is estimated, the proposed method in [5] is employed in position estimation. It is a simple and effective method derived to a “T”-shape microphone array composed by 4 microphones where horizontal and vertical distances between microphone pairs are equal. The center microphone is taken as a reference and time delays are calculated to the other three microphones. The 3-tuples of pairs are then used to estimate the location of the source by geometrical derivation in the three dimensional space 1 . We analyze the position estimation obtained by eight arrays distributed at walls and ceiling of a room. We assumed that there is at least one array among all arrays that yields good position estimation and we investigate this assumption based on power at microphones of an array, correlation between pairs of microphones of an array, and estimated distance. In our experiments we note that the position estimation is high dependent of the environment and the speaker directivity, that is, under high background noise, and lack of direct path propagation to the array, the localization may fail. This paper is organized as follows, in Section 2 the TDOA method is presented in more details as well as proposed modifications, Section 3 covers the selection method of the best array, in Section 4 experiments are conducted, and we conclude in Section 5. 1 Theoretically, with a 4 microphone array a 3D position can be estimated. With the same array it’s also possible to obtain four estimations in 2D space, but in this work we only neglect the z-dimension obtained in 3D space to consider the 2D space.
- 383 -
2. TDOA estimation
signal is stronger than the noise for K < L, then Equation (4) turns to
2.1. Conventional TDOA estimation based on GCCPHAT Consider P arrays each one with Q microphones, where each microphone is defined as qm , for m = 1, . . . , Q. Given a signal source s(t), the signal at each microphone can be represented as x pqm (t) = h pqm (t) ∗ s(t) + n(t),
(1)
where p ∈ {1, . . . , P}, qm ∈ {q1 , q2 , . . . , qQ }, “∗” means convolution, h pqm (t) is the reverberation impulse response that characterizes the propagation mean between the source s(t) and each microphone array, and n(t) is the additive background noise. TDOA is estimated by GCC-PHAT (generalized crosscorrelation phase transform) function as follows, R(τmn ) =
Z
+∞ −∞
X pqm ( f )X ∗pqn ( f ) |X pqm ( f )X ∗pqn ( f )|
e− j2π f τmn d f,
(2)
where R(τmn ) is the function of time delay τmn of a pair of microphones for m , n, X pqm ( f ) and X pqn ( f ) are spectral representation of signals x pqm (t) and x pqn (t), respectively. TDOA is obtained by taking the time delay that maximizes the following function τˆ mn = max {R(τmn )} . τmn
(3)
In practice, signals x pqm (t) are segmented into frames and TDOA can be estimated for each frame. A new function can be generated combining results of all frames, and then Equation (2) turns to R2 (τmn ) =
L X
R(τmn , l)
(4)
l=1
where L is the total number of frames, R(τmn , l) is the GCCPHAT function ( Equation (2)) calculated for each frame l, and R2 (τmn ) characterizes the new cross-correlation function. Time delay τmn is obtained as Equation (3) by maximizing R2 (τmn ). 2.2. Proposed modification Considering the effect of noise there will be frames with low SNR and TDOA analysis over those frames will indicate that the signal arrived at the array in phase, that is, the source is located far away. But, due to space limitation it is reasonable to assume that the source is located at a relative near distance. Thus, considering only reliable frames with high SNR in Equation (4), we expect to obtain a better TDOA estimation. Let us consider K the number of frames where the
R3 (τmn ) =
K X
R(τmn , k),
(5)
k=1
where K is the number of reliable frames and R3 (τmn ) in the new cross-correlation function. Time delay τmn can be obtained as in Equation (3) by maximizing R3 (τmn ). SNR can be calculated by taking the power of the signal in the frame and the noise power can be estimated under no voice activity segments. If the calculated value is above a threshold, it is defined a reliable frame, otherwise the frame is discarded. The drawback of this method is the necessity to estimate the power of the signal, the power of the noise, and define a threshold. To avoid those steps, reliable frames are determined indirectly in this work during the TDOA estimation. Here, it is assumed that wrong TDOA estimation is due to the level of noise at the microphones, then, removing frames that yields wrong estimation, that is, zero delays over all microphone pairs, it is an indirect way to consider reliable frames. In our experiments reliable frames correspond to 55.6% of the total number of frames. 3. Selection Method In this work the mean position error is taken as a reference to compare the selection of the best microphone array, in terms of power, estimated distance, and correlation of pair of microphones. Although the position estimation method proposed in [5] gives a three dimension resolution, we assume that the z-dimension is known a priori neglecting the value calculated by the proposed method. The mean position error is defined as N q 1 X Error = (xn − x0 )2 + (yn − y0 )2 , (6) N n=1
where N is the number of estimated position values (xn , yn ) for N utterances, and (x0 , y0 ) is the real position of the source. We assume that the array with minimum mean position error over all arrays corresponds to the best array for utterances. The selection method based on power assumes that the most reliable array has the highest level of power among all arrays. The power of an array is taken as the maximum value obtained for all microphones, that is o n (7) Power p = max Power pqm , m
where Power pqm is the power calculated for microphone qm of the array p. The selection based on distance assumes that the nearest array is the most reliable array among all arrays. This value is calculated by the Euclidean distance between
- 384 -
the estimated position and the array position, given by � �q (xn − x p )2 + (yn − y p )2 , D p = min p
(8)
where (x p , y p ) is the true array position. The selection based on correlation over microphone pairs of an array assumes that the most reliable array has the biggest value of correlation among all arrays. It is calculated as follows o n (9) Corr p = max Corr pqm ,pqn ,
speaker is an Entry S type manufactured by ALR Jordan and microphones are ECM-C10 model produced by Sony Corporation. In GCC-PHAT analysis we consider frame length of 256 samples, overlap of 128 samples and Hammming window. In our experiments one position estimation is obtained per utterance, and we restrict our analysis to the (x, y) space. r r r
A
m,n
45
where Corr pqm ,pqn is the correlation calculated between microphones pqm and pqn of the array p.2
37
39
E
4. Experiments
r r r
4.1. Experimental Setup
C
47
r r r r 31
23
25
2 In this work Error, Power , D , Corr are calculated taking the mean p p p average of 50 utterances
H 11
01
13
07
08
03
34
43
r F 35r r r 29
27
20
r r r r
49
41
33
18
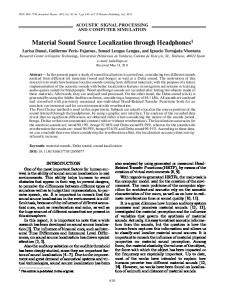
All experiments were conducted in a room (5m × 6.4m × 2.65m) (Length × Width × Height) without acoustic isolation, that is, with influence of outdoor noise as well as indoor caused by computer fans. Sofa, chairs, tables and shelves were not removed from the room keeping the environment conditions as real as possible making the position estimation task a really challenging problem. The entrance is at South side, at the North side there are windows, and at East and West sides shelves characterizing reflecting surfaces. Sofas are located at the center area, tables are distributed near the entrance and the windows. Some chairs are distributed near the tables. Eight microphone arrays in “T”-shape were used; one array fixed at every wall (arrays A, B, C, and D) and four arrays fixed to the ceiling (arrays E, F, G, and H) as illustrated in Figure 1. The main reason for the defined array position was to avoid obstacles near the arrays. Each array was mounted on a structure composed by acoustic absorber to reduce reflection effects. The distance between pairs of microphones at each array was set to 20cm avoiding spatial aliasing. The room was divided in 50 areas, each one 50cm by 50cm, but only 29 areas were considered in our analyses, as shown in Figure 1. To simulate a person, one loudspeaker was set-up over a stand fixed at 140cm height. The stand was centered at each area and 50 Japanese utterances were played, where the mean duration of an utterance is 0.6 seconds. At each area 4 orientations; east, north, south and west were considered resulting in 116 study cases (29 × 4). The utterances were recorded at 48kHz by a 32 channels acquisition system board and down sampled to 12kHz. The acquisition and the playback equipment are separated, each one running in different computers with Linux operation system. The acquisition board is manufactured by Tokyo Electron Device Limited, the
48
21
15
r r r
B
22
G
r r r r
09
05
D r r r
�
N 6
-
? × (X, Y) = (0, 0)
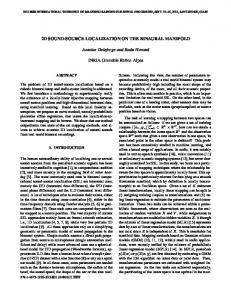
Figure 1: This figure is proportional to the real size room and shows the position of the microphone network. Considered areas in our analyses are numbered. The origin of the coordinate system and the relative orientation are shown at the bottom left 4.2. Distribution of utterances by areas At each area we calculate the number of utterances, out of 50, which yield a position estimation with a reasonable position error, where 40cm was assumed as a maximum reasonable value. In this analysis we note that for all 116 study cases only 68.4% (for position estimation using all frames we have 44.8%) of all utterances were estimated by at least one array to yield a position error less than 40cm. Figure 2 illustrates the distribution of valid utterances (utterances where the position error is less than 40cm) in percentage considering the best result of 8 arrays for two different directions, when the speaker is turned to north and south. An analysis of the curves shows that for different orientation the distribution changes considerably due to a lack of direct path propagation
- 385 -
to the array and the directivity pattern of the speaker. Positions close to the arrays are better estimated. We note that even considering the results of the best array there are areas where position estimation is difficult, in those areas we can not guarantee an acceptable position error, that is, the study method will fail. 70
50 40
60
Y (m)
70
90
3.5
90 50
90
3
2.5 90
90
1
40
90
100
90
60
60
70
80
80
2
60 70 80
90
30
80
4
60
60 50 40
4.5
Reliable Frames − NORTH − Considering (X,Y) 90 780 0 50 40 30 80 20 30 20 40 10 80 50 0 6 90 70 80
50
5
80
5. Conclusions
80
2
2.5 X (m)
3
3.5
Reliable Frames − SOUTH − Considering (X,Y)
60
90 90
90
60
50
20
20
30
60
70
50
90 90
60
70
80
50
1.5
30
70
20
6. Acknowledments
60
We would like to thanks the Global COE program “Frontiers of Intelligent Sensing” and Japan’s Ministry of Education, Culture, Sports, Science and Technology for supporting our research.
40
20
40
60
10
30
90
1
50
2
80 70 60
90
70
80
80
2.5
80
2
2.5 X (m)
In this work we analyze a position estimation method based on TDOA. The environment is kept as real as possible making the position estimation task a really challenging problem. A modification based on reliable frames is proposed to improve the TDOA estimation that leads to a more precise position estimation verified by the minimum mean position error value. we observe that the position estimation is high dependent of the environment and the speaker directivity. We will continue investigating this position estimation method as well as selection methods.
90
50
70
70
90
30 40
5040 30
80
80
70
40
30
60 3
60
50
20
Y (m)
70 60
40
80
4 5 0 4 300 3.5
70
80
40
4.5
50
5
Table 1: Comparing the selection method when the minimum position error is known a priori (x, y) - position Power Correlation Distance Number of Matches in 116 41 53 68 Mean Position Error (cm) 33.1 41.2 60.0
60 70
80
1.5
80
70
50
methods match the best array based on minimum position error. The error is calculated over selected cases. An analysis of this table shows that the best result of mean position error is due to the power selection and the method that has large matches is based on distance. When the minimum mean position error is not known, as the real case, the calculated mean position error for each selection method generates a large error. The best performance was obtained by the selection method based on distance with 0.91m.
3
3.5
Figure 2: Distribution of utterances in percentage by areas considering the best array. In the top the speaker is turned to the north and in the bottom the speaker is turned to the south
References [1] K. Nakadai, et al, “Robust tracking of multiple sound sources by spatial integration of room and robot microphone arrays”,pp. IV 929-932, in Proc. ICASSP 2007. [2] C. Zhang, Z. Zhang, D. Florˆencio, “Maximum likelihood sound source localization for multiple directional microphones”, , pp. I 125-128, in Proc. ICASSP 2007
4.3. Best array selection Considering all 116 study cases, the minimum mean position error in (x, y) plane based only in the best array is 56.7cm. Only for comparison, the minimum mean position error considering all frames in TDOA estimation is 78.4cm, validating our approach suggested by Equation (5). Table 1 shows some results comparing the selecting methods assuming that the best array based on minimum mean position error is known a priori for each case. The number of matches is the number of study cases when the best array chosen by the selection
[3] A. Brutti, M. Omologo, P. Svaizer, C. Zieger, “Classification of acoustic maps to determine speaker position and orientation from a distributed microphone network”, pp. IV 493-496, in Proc. ICASSP 2007 [4] M. Omologo, P. Svaizer, “Use of the Crosspower-Spectrum Phase in Acoustic Event localization”, pp.288-292, IEEE Trans. on Speech and Audio Processing, vol.5, n.3, May 1997. [5] L.Wang, N. Kitaoka, S. Nakagawa, “Robust distance speaker recognition based on position-dependent CMN by combining speaker-specific GMM with speaker-adapted HMM”, pp. 501-513, in Speech Communications, Vol.49, 2007.
- 386 -