Atmospheric Chemistry and Physics Discussions
Correspondence to: Y. S. Wang (
[email protected]) Published by Copernicus Publications on behalf of the European Geosciences Union.
|
1367
Discussion Paper
Received: 4 November 2012 – Accepted: 2 January 2013 – Published: 14 January 2013
|
State Key Laboratory of Atmospheric Boundary Layer Physics and Atmospheric Chemistry (LAPC), Institute of Atmospheric Physics, Chinese Academy of Sciences, Beijing 100029, China 2 Beijing Weather Modification Office, Beijing, China
Discussion Paper
1
ACPD 13, 1367–1397, 2013
Source apportionment of ambient fine particle Z. R. Liu et al.
Title Page Abstract
Introduction
Conclusions
References
Tables
Figures
J
I
J
I
Back
Close
|
Z. R. Liu1 , Y. S. Wang1 , Q. Liu1,2 , B. Hu1 , and Y. Sun1
Discussion Paper
Source apportionment of ambient fine particle from combined size distribution and chemical composition data during summertime in Beijing
|
This discussion paper is/has been under review for the journal Atmospheric Chemistry and Physics (ACP). Please refer to the corresponding final paper in ACP if available.
Discussion Paper
Atmos. Chem. Phys. Discuss., 13, 1367–1397, 2013 www.atmos-chem-phys-discuss.net/13/1367/2013/ doi:10.5194/acpd-13-1367-2013 © Author(s) 2013. CC Attribution 3.0 License.
Full Screen / Esc
Printer-friendly Version Interactive Discussion
5
Discussion Paper |
25
Numerous epidemiological studies have shown a consistent association of cardiovascular hospital admissions with particulate mass concentrations (Peters et al., 2000; Dominici et al., 2005; Brook et al., 2010). In addition to mass, evidence from many studies has indicated that the particle number concentration (mainly ultrafine particles, UFP, diameter 60 %), whereas, its contribution to the total particle number concentration is much lower in Beijing (37.5 %), the diversification of the particle sources in Beijing should response for this kind of contribution divergence. The volume concentration contribution of cooking in this study is lower, but with a much higher number concentration
Full Screen / Esc
Printer-friendly Version Interactive Discussion
4.3 Primary and secondary organic aerosol
|
Current knowledge regarding organic aerosols, including POAs emitted directly from primary sources and SOAs from the oxidation of VOCs, is still very limited. Most particle source apportion articles have been unable to distinguish primary and secondary organic aerosols because these studies have used 24 h or 12 h particle filter samples, thus lacking high-temporal-resolution physical and chemical information. However, such information is sufficient in this study and provides an opportunity to explore
Discussion Paper
1381
|
25
Discussion Paper
20
ACPD 13, 1367–1397, 2013
Source apportionment of ambient fine particle Z. R. Liu et al.
Title Page Abstract
Introduction
Conclusions
References
Tables
Figures
J
I
J
I
Back
Close
|
15
Discussion Paper
10
In previous source apportionment studies, it has been difficult to distinguish between local origin and regional transport for secondary aerosols, such as secondary sulfate and secondary nitrate, because of the lack of high-temporal-resolution physical and chemical information on the particles. In the present study, local and remote sources were successfully distinguished based on the particle size characteristics of each source, where local sources were generally characterised by unimodal or bimodal number distributions consisting mostly of particles less 0.1 µm in diameter. The regional source was defined mostly by accumulation mode particles. More than one-third of the secondary nitrate and secondary sulfate in Beijing was transported from the surrounding areas of Beijing (Table 2). Locally originated nitrate was mostly from atmospheric processing of local NOx emissions during night-time, and locally originated sulfate was mostly formed through in-cloud or aerosol droplet process and gas condensation process.
|
4.2 Local and remote secondary aerosol
Discussion Paper
5
contribution than that of Harrison et al. (2011). Under the same cooking conditions, the Chinese cooking style usually produces more UFP concentrations than the western cooking style, as there is more frying activity in the former (Zhang et al., 2010). Consequently, a larger percentage of the cooking contribution to the particle number concentration in this study could be reasonable.
Full Screen / Esc
Printer-friendly Version Interactive Discussion
Discussion Paper |
In this study, the most important sources for particle volume concentration were road dust, coal-fired power plant and regional sources, these three sources contributed more 1382
|
4.4 Implications for future abatement policy
Discussion Paper
25
ACPD 13, 1367–1397, 2013
Source apportionment of ambient fine particle Z. R. Liu et al.
Title Page Abstract
Introduction
Conclusions
References
Tables
Figures
J
I
J
I
Back
Close
|
20
Discussion Paper
15
|
10
Discussion Paper
5
the probably formation mechanisms of SOAs. According to the previous analysis, organic aerosols are mainly included in six types of sources (Table 2). Four of these types can be regarded as directly emitted from primary sources or aged regional transported organic aerosols: cooking, solid carbon from exhaust, accumulation mode and road dust. The organic aerosols from the other two sources are probably from secondary formation (secondary sulfate and secondary nitrate). SOA is formed through the gas-phase oxidation of VOCs by reactions with the hydroxyl radical (OH), O3 and NO3 (Hallquist et al., 2009). Organic matter contained in the secondary sulfate source (24.2 % in Aitken mode and 15.6 % in droplet mode) is most likely due to the oxidation of VOCs via O3 and OH, as the photochemical production of sulfate is generated at the same time (Sun et al., 2011a). It is interesting to note that a larger amount of organic matter (30.6 % in Aitken mode and 22.0 % in droplet mode) appears in the secondary nitrate source. Because the primary source of organic matter at night can be attributed to Factor 2, this portion of organic matter at night could be secondarily generated. Most laboratory (Hallquist et al., 2009; Kroll and Seinfeld, 2008) and field (Jimenez et al.,2009; Hildebrandt et al., 2010) SOA studies have focused on the role of oxidation via O3 and OH as SOA sources, but few have focused on the oxidation pathway of NO3 . A recently study conducted in Bakersfield, California, indicates that most night-time secondary OA is due to the NO3 product of anthropogenic NOx emissions (Rollins et al., 2012), suggesting the importance of NO3 in the formation of SOA. That study supports the presence of organic aerosol in the secondary nitrate source, though a more detail analysis should be performed in the future. From the above analysis, we can conclude that the secondary sources are responsible for 36.7 % of the OC, broadly consistent with estimates of 38.4 % by Guo et al. (2012) conducted during summertime at an urban site in Beijing.
Full Screen / Esc
Printer-friendly Version Interactive Discussion
Discussion Paper |
1383
|
25
Discussion Paper
20
Combining particle size distribution and chemical composition data sets resulted in a better identification of sources contributing to fine particles in Beijing’s air. Using the PMF model, eight sources were successfully identified from the size distribution, directional association, diurnal variation and their relationship to chemical composition and gaseous pollutants. The aforementioned analysis results in the obtaining of specific emission sources such as cooking, solid mode exhaust, nucleation mode exhaust, accumulation mode, secondary nitrate, secondary sulphate, coal-fired power plant and road dust. Nearly two-thirds of the particulate number concentration was contributed from motor vehicles (37.5 %) and cooking (22.8 %), and more than two thirds of the fine
ACPD 13, 1367–1397, 2013
Source apportionment of ambient fine particle Z. R. Liu et al.
Title Page Abstract
Introduction
Conclusions
References
Tables
Figures
J
I
J
I
Back
Close
|
5 Conclusions
Discussion Paper
15
|
10
Discussion Paper
5
than two thirds of fine particle volume concentration in summertime of Beijing. This result suggests that cutting down emissions from road dust and power plant will effectively decrease the concentration of fine particle and improve the air quality in Beijing. At the same time, it should be aware that the highly polluted atmosphere of Beijing is also attributed to the regional air pollution, as the contribution of regional sources to the volume concentration was estimate to 32.2 % in this study. Improving Beijing’s air quality can not only be achieved by Beijing’s own effort, but also need collaborative governance of emission sources in the surrounding areas. When concerning the particle number concentration, nearly two-thirds of the particulate number concentration was contributed from cooking (22.8 %) and motor vehicles (37.5 %). This result suggests cooking emissions can be regarded as one of the major aerosol sources in Beijing unban environments, which is ignored or do not pay sufficient attention to current abatement policies and control measures should be implemented in future abatement policy. Furthermore, executing stricter emission standards and reducing pollution caused by vehicle exhaust is still an effective way to improve the air pollution and reduce the health risks caused by the highly particle number concentration especially for the ultrafine particles of Beijing.
Full Screen / Esc
Printer-friendly Version Interactive Discussion
Discussion Paper
Acknowledgements. This work is supported by the Knowledge Innovation Project of the Chinese Academy of Sciences (No.: KZCX1-YW-06-01) and the Science and Technology Project of Beijing (No.: D09040903670902). We thank K. Schaefer for his insightful and helpful comments for this manuscript. We also sincerely thank G. R. Liu, W. K. Gao and W. Zhang for their cooperation during the intensive observation period.
|
20
25
Beddows, D. C. S., Dall’osto, M., and Harrison, R. M.: An enhanced procedure for the merging of atmospheric particle size distribution data measured using electrical mobility and time-offlight analysers, Aerosol Sci. Technol., 44, 930–938, 2010. Brook, R. D., Rajagopalan, S., Pope, C. A., Brook, J. R., Bhatnagar, A., Diez-Roux, A. V., Holguin, F., Hong, Y. L., Luepker, R. V., Mittleman, M. A., Peters, A., Siscovick, D., Smith, S. C., Whitsel, L., and Kaufman, J. D.: Particulate matter air pollution and cardiovascular disease
|
1384
Discussion Paper
References
ACPD 13, 1367–1397, 2013
Source apportionment of ambient fine particle Z. R. Liu et al.
Title Page Abstract
Introduction
Conclusions
References
Tables
Figures
J
I
J
I
Back
Close
|
15
Discussion Paper
Supplementary material related to this article is available online at: http://www.atmos-chem-phys-discuss.net/13/1367/2013/ acpd-13-1367-2013-supplement.pdf.
|
10
Discussion Paper
5
particles volume concentrations was attributed to road dust (15.5 %), coal-fired power plant (21.3 %) and regional transport (32.2 %). Local and remote secondary aerosols were also successfully distinguished in the present study: local sources were generally characterised by unimodal or bimodal number distributions consisting mostly of particles less 0.1 µm in diameter. The regional source was defined by mostly accumulation mode particles. Based on this size characteristic, secondary sulfate and secondary nitrate were first distinguished from locally originated and regionally transported, and primary organic aerosols and secondary organic aerosols were also successfully separated. This method of source apportionment may be particularly important for studying complex urban aerosols.
Full Screen / Esc
Printer-friendly Version Interactive Discussion
1385
|
| Discussion Paper
30
Discussion Paper
25
ACPD 13, 1367–1397, 2013
Source apportionment of ambient fine particle Z. R. Liu et al.
Title Page Abstract
Introduction
Conclusions
References
Tables
Figures
J
I
J
I
Back
Close
|
20
Discussion Paper
15
|
10
Discussion Paper
5
an update to the scientific statement from the American Heart Association, Circulation, 121, 2331–2378, 2010. Buonanno, G., Morawska, L., and Stabile, L.: Particle emission factors during cooking activities, Atmos. Environ., 43, 3235–3242, 2009. Casati, R., Scheer, V., Vogt, R., and Benter, T.: Measurement of nucleation and soot mode particle emission from a diesel passenger car in real world and laboratory in situ dilution, Atmos. Environ., 41, 2125–2135, 2007. Chan, C. K. and Yao, X. H.: Air pollution in mega cities in China, Atmos. Environ., 42, 1–42, 2008. Charron, A. and Harrison, R. M.: Primary particle formation from vehicle emissions during exhaust dilution in the roadside atmosphere, Atmos. Environ., 37, 4109–4119, 2003. Chen, Y. J., Zheng, M., Edgerton, E. S., Ke, L., Sheng, G. Y., and Fu, J. M.: PM2.5 source apportionment in the southeastern US: Spatial and seasonal variations during 2001–2005, J. Geophys. Res., 117, D08304, doi:10.1029/2011JD016572, 2012. ¨ Costabile, F., Birmili, W., Klose, S., Tuch, T., Wehner, B., Wiedensohler, A., Franck, U., Konig, K., and Sonntag, A.: Spatio-temporal variability and principal components of the particle number size distribution in an urban atmosphere, Atmos. Chem. Phys., 9, 3163–3195, doi:10.5194/acp-9-3163-2009, 2009. Dall’Osto, M., Beddows, D. C. S., Pey, J., Rodriguez, S., Alastuey, A., Harrison, Roy M., and Querol, X.: Urban aerosol size distributions over the Mediterranean city of Barcelona, NE Spain, Atmos. Chem. Phys., 12, 10693–10707, doi:10.5194/acp-12-10693-2012, 2012. DeCarlo, P. F., Kimmel, J. R., Trimborn, A., Northway, M. J., Jayne, J. T., Aiken, A. C., Gonin, M., Fuhrer, K., Horvath, T., Docherty, K. S., Worsnop, D. R., and Jimenez, J. L.: Field-Deployable, High-Resolution, Time-of-Flight Aerosol Mass Spectrometer, Anal. Chem., 78, 8281–8289, 2006. Delfino, R. J., Sioutas, C., and Malik, S.: Potential role of ultrafine particles in associations between airborne particle mass and cardiovascular health, Environ. Health Perspect., 113, 934–946, 2005. Dominici, F., McDermott, A., Daniels, M., Zeger, S. L., and Samet, J. M.: Revised analyses of the national morbidity, mortality, and air pollution study: mortality among residents of 90 cities, J. Toxicol. Environ. Health -Part A-Current Issues, 68, 1071–1092, 2005. Drewnick, F., Hings, S. S., DeCarlo, P. F., Jayne, J. T., Gonin, M., Fuhrer, K., Weimer, S., Jimenez, J. L., Demerjian, K. L., Borrmann, S., and Worsnop, D. R.: A new Time-of-Flight
Full Screen / Esc
Printer-friendly Version Interactive Discussion
1386
|
| Discussion Paper
30
Discussion Paper
25
ACPD 13, 1367–1397, 2013
Source apportionment of ambient fine particle Z. R. Liu et al.
Title Page Abstract
Introduction
Conclusions
References
Tables
Figures
J
I
J
I
Back
Close
|
20
Discussion Paper
15
|
10
Discussion Paper
5
Aerosol Mass Spectrometer (ToF-AMS) – Instrument description and first field deployment, Aerosol Sci. Tech., 39, 637–658, 2005. Gu, J. W., Pitz, M., Schnelle-Kreis, J., Diemer, J., Reller, A., Zimmermann, R., Soentgen, J., Stoelzel, M., Wichmann, H. E., Peters, A., and Cyrys, J.: Source apportionment of ambient particles: Comparison of positive matrix factorization analysis applied to particle size distribution and chemical composition data, Atmos. Environ., 45, 1849–1857, 2011. Guo, J. P., Zhang, X. Y., Che, H. Z., Gong, S. L., An, X. Q., Cao, C. X., Guang, J., Zhang, H., Wang, Y. Q., Zhang, X. C., Xue, M., Li, X. W.: Correlation between PM concentrations and aerosol optical depth in eastern China, Atmos. Environ., 43, 5876–5886, 2009. Guo, S., Hu, M., Wang, Z. B., Slanina, J., and Zhao, Y. L.: Size-resolved aerosol water-soluble ionic compositions in the summer of Beijing: implication of regional secondary formation, Atmos. Chem. Phys., 10, 947–959, doi:10.5194/acp-10-947-2010, 2010. Guo, S., Hu, M., Guo, Q. F., Zhang, X., Zheng, M., Zheng, J., Chang, C. C., Schauer, J. J., and Zhang, R. Y.: Primary Sources and Secondary Formation of Organic Aerosols in Beijing, China, Environ. Sci. Technol., doi:10.1021/es2042564, 2012. Hallquist, M., Wenger, J. C., Baltensperger, U., Rudich, Y., Simpson, D., Claeys, M., Dommen, J., Donahue, N. M., George, C., Goldstein, A. H., Hamilton, J. F., Herrmann, H., Hoffmann, T., Iinuma, Y., Jang, M., Jenkin, M. E., Jimenez, J. L., Kiendler-Scharr, A., Maenhaut, W., ´ ot, ˆ A. S. H., Seinfeld, J. H., Surratt, J. D., McFiggans, G., Mentel, Th. F., Monod, A., Prev Szmigielski, R., and Wildt, J.: The formation, properties and impact of secondary organic aerosol: current and emerging issues, Atmos. Chem. Phys., 9, 5155–5236, doi:10.5194/acp9-5155-2009, 2009. Han, L. H., Zhuang, G. S., Cheng, S. Y., Wang, Y., and Li J.: Characteristics of re-suspended road dust and its impact on the atmospheric environment in Beijing, Atmos. Environ., 41, 7485–7499, 2007. Harrison, R. M., Beddows, D. C. S., and Dall’Osto, M.: PMF analysis of wide-range particle size spectra collected on a major highway, Environ. Sci. Technol., 45, 5522–5528, 2011. He, L. Y., Hu, M., Huang, X. F., Yu, B. D., Zhang, Y. H., and Liu, D. Q.: Measurement of emissions of fine particulate organic matter from Chinese cooking, Atmos. Environ., 38, 6557–6564, 2004. Hildebrandt, L., Kostenidou, E., Mihalopoulos, N., Worsnop, D. R., Donahue, N. M., and Pandis, S. N.: Formation of highly oxygenated organic aerosol in the atmosphere: Insights
Full Screen / Esc
Printer-friendly Version Interactive Discussion
1387
|
| Discussion Paper
30
Discussion Paper
25
ACPD 13, 1367–1397, 2013
Source apportionment of ambient fine particle Z. R. Liu et al.
Title Page Abstract
Introduction
Conclusions
References
Tables
Figures
J
I
J
I
Back
Close
|
20
Discussion Paper
15
|
10
Discussion Paper
5
from the Finokalia Aerosol Measurement Experiments, Geophys. Res. Lett., 37, L23801, doi:10.1029/2010GL045193, 2010. Huang, X.-F., He, L.-Y., Xue, L., Sun, T.-L., Zeng, L.-W., Gong, Z.-H., Hu, M., and Zhu, T.: Highly time-resolved chemical characterization of atmospheric fine particles during 2010 Shanghai World Expo, Atmos. Chem. Phys., 12, 4897–4907, doi:10.5194/acp-12-4897-2012, 2012. ˚ ¨ S., Jonsson, Asa. ´ P., Svensson, E. A., and Hallquist, M.: Size resolved Janhall, M., Molnar, traffic emission factors of submicrometer particles, Atmos. Environ., 38, 4331–4340, 2004. Jimenez, J. L., Jayne, J. T., Shi, Q., Kolb, C. E., Worsnop, D. R., Yourshaw, I., Seinfeld, J. H., Flagan, R. C., Zhang, X. F., Smith, K. A., Morris, J. W., and Davidovits, P.: Ambient aerosol sampling with an Aerosol Mass Spectrometer, J. Geophys. Res.-Atmos., 108, 8425, doi:10.1029/2001JD001213, 2003. Jimenez, J. L., Canagaratna, M. R., Donahue, N. M., Prevot, A. S. H., Zhang, Q., Kroll, J. H., DeCarlo, P. F., Allan, J. D., Coe, H., Ng, N. L., Aiken, A. C., Docherty, K. S., Ulbrich, I. M., Grieshop, A. P., Robinson, A. L., Duplissy, J., Smith, J. D., Wilson, K. R., Lanz, V. A., Hueglin, C., Sun, Y. L., Tian, J., Laaksonen, A., Raatikainen, T., Rautiainen, J., Vaattovaara, P., Ehn, M., Kulmala, M., Tomlinson, J. M., Collins, D. R., Cubison, M. J., Dunlea, E. J., Huffman, J. A., Onasch, T. B., Alfarra, M. R., Williams, P. I., Bower, K., Kondo, Y., Schneider, J., Drewnick, F., Borrmann, S., Weimer, S., Demerjian, K., Salcedo, D., Cottrell, L., Griffin, R., Takami,A., Miyoshi, T., Hatakeyama, S., Shimono, A., Sun, J. Y., Zhang, Y. M., Dzepina, K., Kimmel, J. R., Sueper, D., Jayne, J. T., Herndon, S. C., Trimborn, A. M., Williams, L. R., Wood, E. C., Middlebrook, A. M., Kolb, C. E., Baltensperger, U., and Worsnop, D. R.: Evolution of Organic Aerosols in the Atmosphere, Science, 326, 1525, doi:10.1126/science.1180353, 2009. ¨ K., Laakso, L., Asmi, A., Hienola, J., Kerminen, V. M., Pirjola, L., Boy, M., Eskola, A., Teinnila, Lauri, A., Vainio, V., Lehtinen, K., and Kulmala, M.: Interaction between SO2 and submicron atmospheric particles, Atmos. Res., 54, 41–57, 2000. Kim, E. and Hopke, P. K.: Comparison between conditional probability function and nonparametric regression for fine particle source directions, Atmos. Environ., 38, 4667–4673, 2004. Kittelson, D. B.: Engines and Nano-particles: A Review, J. Aerosol Sci., 29, 575–588, 1998. Kroll, J. H. and Seinfeld, J. H.: Chemistry of secondary organic aerosol: Formation and evolution of low-volatility organics in the atmosphere, Atmos. Environ., 42, 3593–3624, 2008. Li, C. S., Lin, W. H., and Jenq, F. T.: Size distributions of submicrometer aerosols from cooking, Environ. Int., 19, 147–154, 1993.
Full Screen / Esc
Printer-friendly Version Interactive Discussion
1388
|
| Discussion Paper
30
Discussion Paper
25
ACPD 13, 1367–1397, 2013
Source apportionment of ambient fine particle Z. R. Liu et al.
Title Page Abstract
Introduction
Conclusions
References
Tables
Figures
J
I
J
I
Back
Close
|
20
Discussion Paper
15
|
10
Discussion Paper
5
Liu, Q., Sun, Y., Hu B., Liu, Z. R., Akio S., and Wang, Y. S.: In situ measurement of PM1 organic aerosol in Beijing winter using a high-resolution aerosol mass spectrometer, Chin. Sci. Bull., 57, 819–826, 2012. Norris, G., Vedantham, R., Wade, K., Brown, S., Prouty, J., and Foley C.: EPA Positive Matrix Factorization (PMF)3.0, Fundamentals User Guide US Environmental Protection Agency, Office of Research and Development Washington DC, 20460, USA, 2008. Ogulei, D., Hopke, P. K., Zhou, L. M., Pancras, J. P., Nair, N., and Ondov, J. M.: Source apportionment of Baltimore aerosol from combined size distribution and chemical composition data, Atmos. Environ., 40, 396–410, 2006. Ondov, J. M. and Wexler, A. S.: Where do particulate toxins reside? An improved paradigm for the structure and dynamics of the urban mid-Atlantic aerosol, Environ. Sci. Technol., 32, 2547–2555, 1998. Paatero, P.: Least squares formulation of robust nonnegative factor analysis, Chemom. Intell. Lab. Syst., 37, 23–35, 1997. Paatero, P. and Tapper, U.: Positive matrix factorization: a non-negative factor model with optimal utilization of error estimates of data values, Environmetrics, 5, 111–126, 1994. Park, S. S., Ondov, J. M., Harrison, D., and Nair, N. P.: Seasonal and shorter-term variations in particulate atmospheric nitrate in Baltimore, Atmos. Environ., 39, 2011–2020, 2005. Peters, A., Skorkovsky, J., Kotesovec, F., Brynda, J., Spix, C., Wichmann, H. E., and Heinrich, J.: Associations between mortality and air pollution in Central Europe, Environ. Health Perspect., 108, 283–287, 2000. Pey, J., Querol, X., Alastuey, A., Rodr´ıguez, S., Putaud, J. P., and Dingenen, R. V.: Source apportionment of urban fine and ultra-fine particle number concentration in a Western Mediterranean city, Atmos. Environ., 43, 4407–4415, 2009. Polissar, A. V., Hopke, P. K., and Poirot, R. L.: Atmospheric aerosol over Vermont: chemical composition and sources. Environ. Sci. Technol., 35, 4604–4621, 2001. Rollins, A. W., Browne, E. C., Min, K. E., Pusede, S. E., Wooldridge, P. J., Gentner, D. R., Goldstein, A. H., Liu, S., Day, D. A., Russell, L. M., and Cohen R. C.: Evidence for NOx control over nighttime SOA formation, Science, 337, 1210–1212, 2012. Seinfeld, J. H. and Pandis, S. N.: Atmospheric Chemistry and Physics: From air Pollution to climate change, Wiley, New York, USA, 267 pp., 2006.
Full Screen / Esc
Printer-friendly Version Interactive Discussion
1389
|
| Discussion Paper
30
Discussion Paper
25
ACPD 13, 1367–1397, 2013
Source apportionment of ambient fine particle Z. R. Liu et al.
Title Page Abstract
Introduction
Conclusions
References
Tables
Figures
J
I
J
I
Back
Close
|
20
Discussion Paper
15
|
10
Discussion Paper
5
Song, Y., Zhang, Y. H., Xie, S. D., Zeng, L. M., Zheng, M., Salmon, L. G.,Shao, M., and Slanina, S.: Source apportionment of PM2.5 in Beijing by positive matrix factorization, Atmos. Environ., 40, 1526–1537, 2006. Song, Y., Tang, X. Y., Xie, S. D, Zhang, Y. H.,Wei, Y. J., Zhang, M. S., Zeng, L. M., and Lu, S. H.: Source apportionment of PM2.5 in Beijing in 2004, J. Haz. Mater., 146, 124–130, 2007. Sun, Y. L., Zhang, Q., Schwab, J. J., Chen, W. N., Bae, M. S., Lin, Y. C., Hung, H. M., and Demerjian, K. L.: A case study of aerosol processing and evolution in summer in New York City, Atmos. Chem. Phys., 11, 12737–12750, doi:10.5194/acp-11-12737-2011, 2011a. Sun, Y.-L., Zhang, Q., Schwab, J. J., Demerjian, K. L., Chen, W.-N., Bae, M.-S., Hung, H.-M., Hogrefe, O., Frank, B., Rattigan, O. V., and Lin, Y.-C.: Characterization of the sources and processes of organic and inorganic aerosols in New York city with a high-resolution time-offlight aerosol mass apectrometer, Atmos. Chem. Phys., 11, 1581–1602, doi:10.5194/acp-111581-2011, 2011b. ¨ Wichmann, H. E., Spix, C., Tuch, T., Woelke, G., Peters, A., Heinrich, J., Kreyling, W. G., and Heyder, J.: Daily mortality and fine and ultrafine particles in Erfurt, Germany, Part A: Role of particle number and particle mass, Health Effects Institute Research Report, 98, 5–86, 2000. Willeke, K. and Baron, P. A.: Aerosol Measurement Principles, Techniques, and Applications, Van Nostrand Reinhold, Hoboken, NJ, 1993. ¨ a, ¨ T., Wu, Z. J., Hu, M., Liu, S., Wehner, B., Bauer, S., ßling, A. M., Wiedensohler, A., Petaj Maso, M. D., and Kulmala M.: New particle formation in Beijing, China: Statistical analysis of a 1-year data set, J. Geophys. Res., 112, D09209, doi:10.1029/2006JD007406, 2007. Xie, S. D., Liu, Z., Chen, T., and Hua, L.: Spatiotemporal variations of ambient PM10 source contributions in Beijing in 2004 using positive matrix factorization, Atmos. Chem. Phys., 8, 2701–2716, doi:10.5194/acp-8-2701-2008, 2008. ¨ Yue, W., Stolzel, M., Cyrys J., Pitz, M., Heinrich, J., Kreyling, W. G., Wichmann, H. E., Peters, A., Wang, S., and Hopke, P. K.: Source apportionment of ambient fine particle size distribution using positive matrix factorization in Erfurt, Germany, Sci. Total Environ, 39, 133–144, 2008. Zhang, K., Wang, Y. S., Wen, T. X., Meslmani, Y., and Murray, F.: Properties of nitrate, sulfate and ammonium in typical polluted atmospheric aerosols (PM10 ) in Beijing, Atmos. Res., 84, 67–77, 2007.
Full Screen / Esc
Printer-friendly Version Interactive Discussion
| Discussion Paper |
1390
Discussion Paper
25
ACPD 13, 1367–1397, 2013
Source apportionment of ambient fine particle Z. R. Liu et al.
Title Page Abstract
Introduction
Conclusions
References
Tables
Figures
J
I
J
I
Back
Close
|
20
Discussion Paper
15
|
10
Discussion Paper
5
Zhang, Q. F., Gangupomu, R. H., Ramirez, D., and Zhu, Y. F.: Measurement of ultrafine particles and other air pollutants emitted by cooking activities, Int. J. Environ. Res., Public Health, 7, 1744–1759, doi:10.3390/ijerph7041744, 2010. Zhang, Q., Canagaratna, M. R., Jayne, J. T., Worsnop, D. R., and Jimenez, J. L.: Time and sizeresolved chemical composition of submicron particles in Pittsburgh – Implications for aerosol sources and processes, J. Geophys. Res., 110, D07S09, doi:10.1029/2004JD004649, 2005. Zhang, Q., Streets, D. G., Carmichael, G. R., He, K. B., Huo, H., Kannari, A., Klimont, Z., Park, I. S., Reddy, S., Fu, J. S., Chen, D., Duan, L., Lei, Y., Wang, L. T., and Yao, Z. L.: Asian emissions in 2006 for the NASA INTEX-B mission, Atmos. Chem. Phys., 9, 5131–5153, doi:10.5194/acp-9-5131-2009, 2009. Zhao, Y. L., Hu, M., Slanina, S., and Zhang Y. H.: Chemical Compositions of Fine Particulate Organic Matter Emitted from Chinese Cooking, Environ. Sci. Technol., 41, 99–105, 2007. Zhou, L. M., Kim, E., Hopke, P. K., Stanier, C. O., and Pandis, S.: Advanced factor analysis on Pittsburgh particle size-distribution data special issue of aerosol science and technology on findings from the Fine Particulate Matter Supersites Program, Aerosol Sci. Technol., 38, 118–132, 2004. Zhou, L. M., Hopke, P. K., Stanier, C. O., Pandis, S. N., Ondov, J. M., and Pancras, J. P.: Investigation of the relationship between chemical composition and size distribution of airborne particles by partial least squares (PLS) and positive matrix factorization (PMF), J. Geophys. Res., 110, D07S18, doi:10.1029/2004JD005050, 2005. Zhu, C. S., Chen, C. C., Cao, J. J., Tsai, C. J., Chou, C. C. K., Liu, S. C., and Roam, G. D.: Characterization of carbon fractions for atmospheric fine particles and nanoparticles in a highway tunnel, Atmos. Environ., 44, 2668–2673, 2010. Zhu, L., Huang, X., Shi, H., Cai, X. H., and Song, Y.: Transport pathways and potential sources of PM10 in Beijing, Atmos. Environ., 45, 594–604, 2011. Zhu, Y. F., Hinds, W. C., Kim, S., and Sioutas, C.: Concentration and Size Distribution of Ultrafine Particles Near a Major Highway, J. Air Waste Manage. Assoc., 52, 1032–1042, 2002.
Full Screen / Esc
Printer-friendly Version Interactive Discussion
Discussion Paper |
Factors
mean concentration (s.d.) (%)
3.8(5.9) 8.7(8.1) 2.4(3.9) 5.6(4.9) 10.5(11.6) 21.3(19.1) 15.5(9.5) 67.8
13.8(10.5) 13.8
32.2(17.5) 32.2
|
22.8(16.6) 18.8(13.8) 18.7(14.1) 8.9(7.5) 7.9(9.1) 6.8(8.3) 2.3(1.8) 86.2
Discussion Paper
volume
Discussion Paper |
1391
13, 1367–1397, 2013
Source apportionment of ambient fine particle Z. R. Liu et al.
Title Page Abstract
Introduction
Conclusions
References
Tables
Figures
J
I
J
I
Back
Close
|
Local sources cooking (factor 1) exhaust, solid mode (factor 2) exhaust, nucleation mode (factor 3) secondary nitrate (factor 5) secondary sulfate (factor 6) coal-fired power plant (factor 7) road dust (factor 8) subtotal Regional sources accumulation mode (factor 4) subtotal
number
Discussion Paper
Table 1. Attribution of mean particle number and volume to tentatively assigned sources.
ACPD
Full Screen / Esc
Printer-friendly Version Interactive Discussion
Discussion Paper
Table 2. Percent of each chemical species attributed to each factor. Factor 2
Factor 3
Factor 4
Factor 5
Factor 6
Factor 7
Factor 8
org AtM org CoM org DrM NO3 AtM NO3 CoM NO3 DrM SO4 AtM SO4 CoM SO4 DrM NH4 AtM NH4 CoM NH4 DrM Cl AtM Cl CoM Cl DrM NO NO2 O3 SO2 CO
15.1 34.7 11.9 5.2 6.0 0.0 2.2 2.1 0.0 4.5 4.7 2.3 0.0 0.5 0.0 0.0 7.3 7.1 0.0 4.4
4.6 21.7 17.8 6.1 22.7 3.5 4.9 15.3 0.0 12.0 17.1 4.3 4.6 4.8 3.9 0.0 6.5 0.0 1.4 1.6
7.8 0.0 0.0 5.9 2.7 0.0 3.8 3.5 0.0 13.7 10.2 3.7 8.2 8.1 7.0 16.7 9.9 0.7 0.0 2.7
9.8 6.1 21.2 0.0 8.1 42.1 15.6 17.9 37.3 0.0 0.0 23.8 6.3 7.6 10.6 13.9 11.3 10.1 5.3 18.2
30.6 17.0 22.0 47.8 39.7 44.7 33.2 27.6 24.0 35.4 33.7 36.3 47.8 48.4 50.5 56.3 35.8 0.0 50.1 44.2
24.2 13.5 15.6 30.9 15.7 0.0 28.8 25.4 28.2 30.3 26.3 24.3 23.0 21.8 17.7 0.0 15.2 82.1 31.9 15.5
5.6 3.3 0.0 4.1 1.5 0.0 11.1 8.3 10.5 0.0 2.9 3.1 5.1 4.7 5.0 13.0 0.5 0.0 11.4 12.3
2.2 3.7 11.5 0.0 3.6 9.7 0.4 0.0 0.0 4.0 5.0 2.2 4.9 4.0 5.4 0.0 13.4 0.0 0.0 1.0
| Discussion Paper |
1392
Discussion Paper
AtM: Aitken mode, CoM: condensation mode, DrM: droplet mode.
13, 1367–1397, 2013
Source apportionment of ambient fine particle Z. R. Liu et al.
Title Page Abstract
Introduction
Conclusions
References
Tables
Figures
J
I
J
I
Back
Close
|
Factor 1
Discussion Paper
∗
Species
|
∗
ACPD
Full Screen / Esc
Printer-friendly Version Interactive Discussion
Discussion Paper |
c
Song et al. (2007) 2004, August Beijing a mass
Chen et al. (2012) 2001–2005 North Birmingham a mass
Pey et al. (2009) 2003–2004 Barcelona c number
Harrison, et al. (2011) 2007, October-November London b c volume number
This Study 2011, August Beijing b c volume number
Motor vehicle Secondary sulfate Secondary nitrate Coal consumption Road dust Regional Cooking Others
5.9 17.0 16.0 16.8 7.5
14.9 24.1 8.0 11.3 8.4
15.6 24.0 5.3
64.2 3.3
22.4
65.4
8.4
2.0
3.1
1.4 24.2
18.1 29.3 6.7 15.1
6.5 5.7 6.6 13.8
11.1 10.5 5.6 21.3 15.5 32.2 3.8
36.9
33.1
2.0 50.0
6.9
Mass concentration contribution (%) of each factor to PM2.5 . Volume concentration contribution (%) of each factor to PM2.5 . Number concentration contribution (%) of each factor to PM2.5 .
37.5 7.9 8.9 6.8 2.3 13.8 22.8
Discussion Paper
b
Song et al. (2006) 2000, annual Beijing a mass
| Discussion Paper |
1393
13, 1367–1397, 2013
Source apportionment of ambient fine particle Z. R. Liu et al.
Title Page Abstract
Introduction
Conclusions
References
Tables
Figures
J
I
J
I
Back
Close
|
a
Sources
Discussion Paper
Table 3. Comparison of source contribution (%) to ambient PM2.5 in Beijing and other mega cities by different studies.
ACPD
Full Screen / Esc
Printer-friendly Version Interactive Discussion
Discussion Paper
ACPD 13, 1367–1397, 2013
| Discussion Paper
Source apportionment of ambient fine particle Z. R. Liu et al.
Title Page Introduction
Conclusions
References
Tables
Figures
J
I
J
I
Back
Close
|
Abstract
Discussion Paper |
1394
|
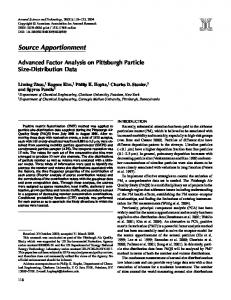
size distribution information for the first four sources. Chemical species were divided in Aitken mode (AtM), condensation mode (CoM) and droplet mode (DrM).
Discussion Paper
Fig.1 Profiles of the resolved sources including particle composition, gaseous species, and size distribution information for the first four sources. Chemical Fig. 1. Profiles of the sources particle composition, species, and speciesresolved were divided in Aitken modeincluding (AtM), condensation mode (CoM) and droplet modegaseous (DrM).
Full Screen / Esc
Printer-friendly Version Interactive Discussion
Discussion Paper
ACPD 13, 1367–1397, 2013
| Discussion Paper
Source apportionment of ambient fine particle Z. R. Liu et al.
Title Page Introduction
Conclusions
References
Tables
Figures
J
I
J
I
Back
Close
|
Abstract
| Discussion Paper |
1395
Discussion Paper
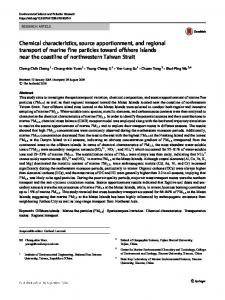
Fig.2 Profiles of the resolved sources including particle composition, gaseous species, and size distribution information for sources 5-8 Chemical species divided in Aitken mode (AtM), condensationparticle mode (CoM) composition, and droplet mode (DrM). Fig. 2. Profiles of thewere resolved sources including gaseous species, and size distribution information for sources 5–8 Chemical species were divided in Aitken mode (AtM), condensation mode (CoM) and droplet mode (DrM).
Full Screen / Esc
Printer-friendly Version Interactive Discussion
Discussion Paper
ACPD 13, 1367–1397, 2013
| Discussion Paper
Source apportionment of ambient fine particle Z. R. Liu et al.
Title Page Introduction
Conclusions
References
Tables
Figures
J
I
J
I
Back
Close
|
Abstract
Discussion Paper |
a 75th percentile criterion.
|
1396
Discussion Paper
Fig. 3 Conditional probability function (CPF) plots for the resolved source contributions using a 75th percentile criterion. Fig. 3. Conditional probability function (CPF) plots for the resolved source contributions using
Full Screen / Esc
Printer-friendly Version Interactive Discussion
Discussion Paper
ACPD 13, 1367–1397, 2013
| Discussion Paper
Source apportionment of ambient fine particle Z. R. Liu et al.
Title Page Introduction
Conclusions
References
Tables
Figures
J
I
J
I
Back
Close
|
Abstract
Discussion Paper | Discussion Paper
Full Screen / Esc
Fig. 4 Plot of the particle size distributions as a function of time-of-day for 31 July 2011
Fig. 4. Plot of the particle size distributions as a function of time-of-day for 31 July 2011 showing showing a nucleation and growth event. a nucleation and growth event.
|
1397
Printer-friendly Version Interactive Discussion