Pustek Akselerator dan Proses Bahan - BATAN ... laju fisi sangat berfluktuasi, suhu bahan bakar maksimum masih di bawah batas maksimum yang diizinkan.
Alexander Agung
63
ISSN 0216 - 3128
SPACE-DEPENDENT DYNAMIC SIMULATION FLUIDIZED BED NUCLEAR REACTOR
OF
A
Alexander Agung Jurusan Teknik Fisika, Universitas Gadjah Mada, Jl. Grafika 2, Yogyakarta 55281
ABSTRACT Modeling of the space-dependent dynamics of a fluidized bed nuclear reactor has been performed. The model consists of coupled neutronics, heat transfer as well as fluid dynamics/fluidization. The granular kinetic energy theory is also incorporated to model the phenomena of gas-solid interaction. A computational scheme for the neutronics comprises the even-parity finite element method while the two fluid model is used for the fluid dynamics. Simulation to the dynamics of the reactor has been performed for an uranium inventory of 120 kg and a coolant inlet velocity of 120 cm/s. The results shows that the fission rate is highly fluctuative but the gas temperature is modest. This issue is quite encouraging as the power production in the turbogenerator line depends on the evolution of gas temperature. Furthermore, despite a highly fluctuating fission rate, the maximum fuel temperature is below the maximum permissible limit Keywords: Space-dependent dynamics, Fluidized Bed Nuclear Reactor, even-parity transport equation, finite element methods.
ABSTRAK Pemodelan dinamika gayut waktu untuk reaktor nuklir fluidisasi telah dilakukan. Model tersebut terdiri dari kopelan neutronika, perpindahan kalor serta dinamika fluida/fluidisasi. Teori energi kinetik granular juga disertakan untuk memodelkan fenomena interaksi gas-padatan. Skema komputasi untuk neutronika meliputi metode elemen hingga even-parity sedangkan untuk dinamika fluida digunakan model dua fluida. Simulasi terhadap dinamika reaktor telah dilakukan untuk kandungan uranium dalam reaktor sebesar 120 kg dan kecepatan masukan pendingin sebesar 120 cm/s. Hasil yang diperoleh menunjukkan bahwa laju fisi sangat berfluktuasi akan tetapi fluktuasi suhu gas hanya sedang-sedang saja. Hal ini cukup menggembirakan karena produksi daya pada turbogenerator tergantung kepada evolusi suhu gas. Lebih lanjut lagi, meskipun laju fisi sangat berfluktuasi, suhu bahan bakar maksimum masih di bawah batas maksimum yang diizinkan. Kata kunci: Dinamika gayut ruang, Reaktor Nuklir Fluidisasi, persamaan transport even-parity, metode elemen hingga.
I. INTRODUCTION
T
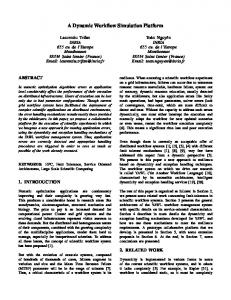
he fluidized bed nuclear reactor (FLUBER) is an innovative design of gas-cooled reactor. It consists of a graphite-walled tube partially filled with TRISO-coated fuel particles. In contrast with other HTGRs where the TRISO particles are encased within a graphite pebble or rods, the particles in FLUBER are laid in the bottom part of the cavity of the tube, forming a packed bed. Helium is used as a coolant that flows from bottom to top through the tube, thereby fluidizing the particle bed. During the fluidization process, the bed of solid particles is transformed into something closely resembling a liquid. Fig 1 shows a schematic view of FLUBER in a packed bed and in a fluidized state. When the flow is absent or at low rate, the bed remains packed as indicated in Fig. 1 (left).
When the flow rate is increased, the bed expands and forms a fluidized state; see Fig. 1 (right). Only when the coolant flow is large enough does the reactor become critical because of the surrounding graphite that moderates and reflects the neutrons. Fluidized beds have several features that are advantageous for a nuclear reactor, such as a uniform temperature distribution due to rapid particle mixing and a high transfer rate between particles and fluid. The high heat transfer rate between particles and fluid yields a high temperature of fluid without leading to an excessive fuel temperature. This offers the advantages of a high core outlet temperature and the use of a highly efficient direct-cycle gas turbine. The excellent mixing properties guarantee a uniform power distribution and consequently a uniform fuel burnup.
Prosiding PPI - PDIPTN 2007 Pustek Akselerator dan Proses Bahan - BATAN Yogyakarta, 10 Juli 2007
64
ISSN 0216 - 3128
Alexander Agung
Figure 1. A schematic view of FLUBER at collapsed/packed condition (left) and at fluidized state when the gas flows into the reactor (right). The size of fuel particles is not to scale.
Another possible advantage of using a fluidized bed for nuclear reactors is that the bed height increases when the gas flow increases. The change in geometry of the bed affects the neutronics of the reactor and consequently the power produced will change as well. In this manner the power generation can be controlled by altering the inlet flow rate, thus reducing dependencies on control rod mechanisms. In reality, particles in fluidized beds are not distributed uniformly and even move rather chaotically. The hydrodynamics of gas-solid fluidized beds are a complex phenomenon, determined by the combined effects of formation, motion and interactions of bubbles as well as by the solids behavior. The time dependent behavior of a fluidized bed is thus important. The neutronic behavior of FLUBER is strongly affected by spatial changes in void fraction. Movement of particles from one region to another region having different importance value will give fluctuations in the reactivity, which in turn affect the power generated. This situation differs from “conventional” reactors such as BWRs and PWRs, where fuel elements remain in their fixed position. The time-dependent neutronics of FLUBER is also
different from “conventional” as the delayed neutron precursors in FLUBER are also advected with the particles. This problem combined with the nature of fluidization poses a demanding task in terms of computation. This paper presents the space-dependent dynamics with coupled neutronic and fluid dynamic of FLUBER. Section II describes related codes for simulating the behavior of the reactor while the governing equations implemented in those codes are presented in Section III. The implementation of the codes is further discussed in Section IV and the results in simulating the dynamics of the reactor are presented in Section V. Final conclusions are drawn in Section VI.
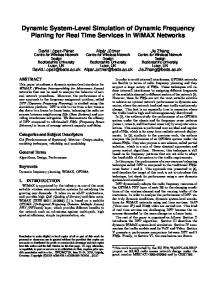
II. DESCRIPTION OF THE CODES The simulation of time- and space-dependent dynamics have been performed by using the FETCH code. The code is comprised of three modules: (i) a radiation transport code EVENT[4], (ii) a computational fluid dynamics code FLUIDITY[8] and (iii) an interface module which couples the neutronics and fluid dynamics code. A pictorial representation of the flow of information in the
Prosiding PPI - PDIPTN 2007 Pustek Akselerator dan Proses Bahan - BATAN Yogyakarta, 10 Juli 2007
Alexander Agung
ISSN 0216 - 3128
FETCH code is shown in Fig. 2. The radiation transport calculation will yield the spatial dependence of energy and delayed neutron source fields, which are input to the fluids module. The fluids module solves the advection/diffusion equations. Delayed neutron precursors are also advected with the fluid and the information regarding the concentration of delayed neutron precursors is returned to the neutronics module. The feedback from the fluids module, in terms of temperature, density and void fraction, is processed by the interface module to obtain the spatial distribution of multi-group neutron cross-sections which are fed back to the neutronics module. For a given element of the finite element mesh, a crosssection set is obtained by interpolating a crosssection database in temperature and void fraction. The EVENT code solves the Boltzman transport equation using a second order even-parity variational principle. The discretization of the phase space is finite elements in space, spherical harmonics in angle, multi-group in energy and implicit two level discretization in time. Formulations for applying finite elements to steadystate and time dependent radiation transport problems have been quite extensively explored see e.g.[1,2]. The finite element method of solving the Boltzman transport equation in the EVENT code is described by De Oliveira[4].
Figure 2.
65
In the CFD code FLUIDITY, the momentum equations are discretized using a nonlinear PetrovGalerkin method to reduce oscillations in the velocity fields. Other conservation equations are solved using an implicit high resolution method which is second-order accurate in space and time. The interphase coupling is treated implicitly through pressure[9]. The FLUIDITY code also incorporates an automatic time-stepping method to improve efficiency of the code. This method produces time step sizes that are dictated by acoustic waves in the particle phase, resulting in time steps between 10-5 – 10-3 seconds. Some validations of the criticality models have been extensively performed and compared to the experimental results. For example, FETCH has been used to simulate the transient criticality of the SILENE reactor and the results have predicted the fission rates for prompt supercritical step reactivity insertion within acceptable accuracy[10]. The robustness of the fluidization model incorporated in FLUIDITY has been investigated for example in bubbling and slugging fluidized beds. The behavior of particles and a number of phenomenon such as formation, elongation and eruption of bubbles obtained from the simulations are consistent with the results of experiments[5]. These studies have given enough confidence to investigate the dynamics of FLUBER using the FETCH code.
An outline of the FETCH code, representing the flow information among different modules.
Prosiding PPI - PDIPTN 2007 Pustek Akselerator dan Proses Bahan - BATAN Yogyakarta, 10 Juli 2007
66
Alexander Agung
ISSN 0216 - 3128
III. GOVERNING EQUATIONS
r,
1. Neutronics Model
r,
The time-dependent transport equation of neutrons having energy E can be written as r, , E , t t r, , E , t
1 v
r, , E , t
(1)
S r, , E , t
where r, , E, t is the neutron angular flux, H is the interaction operator and S is the effective source. The operator, H, is defined in terms of the total cross-section, t r, E and the scattering crosssection, s r, ' , E ' E , and is given by the following form t
r,
s
r, E
, E'
r, , E, t
E, t
G
C
S
GS
(7)
where the even- and odd-parity component of the interaction operator, H, can be written as C G
r' , ', E', t dE' d '
(6)
r,
By expanding the differential scattering cross-section into a series of Legendre polynomials and incorporating the even- and odd-parity flux into the transport equation, a second order or evenparity form of the transport equation is obtained as follows
r, l even
H r, , E, t
r,
1
r, l odd
(2)
2l 1 4π
t
Pl
sl
r, E', ' d ' dE'
0
0 4π
2l 1 4π
t
Pl
sl
(8)
r, E', ' d ' dE'
0
0 4π
4π 0
2. Continuity equation The effective source, S, has contributions from external sources, fission neutron within energy E to E+dE and delayed neutrons. It can be written as
E'
f
t
1 β 4π
S S ext r, , E, t
p
(3) n
d n
E Cn
n
4π 0
The source term includes the contribution of delayed neutrons. The equation for the nth delayed neutron group precursor concentration is written as
βn
v s C n r, t
k
vk
0
(9)
where k is the density of phase k, α k is the volume fraction of phase k and vk is the velocity vector of phase k.
3. Momentum equation
(4) f
r, E , t dE
t
αk
k
αk
, the Instead of using the angular flux, neutron transport equation can be cast in the evenparity component of the angular flux. The even- and odd-parity component can be written as
r,
αk
k
The corresponding momentum equation is given as,
n C n r, t
0
r,
αk
E
r, ' , E' , t d ' dE'
C n r, t t
The continuity equation for phase k, where k = g denotes gas and k = p denotes solid particles, is
1 2 1 2
r,
r, (5)
r,
r,
and they satisfy the following identities
vk
αk
β v k' kg
k
αk
vk vk
vk
pg I
(10)
k
where g is the gravitational acceleration vector, I is the unit tensor, k’ is the opposite phase, pg is the shared pressure, β is the gas-solid friction coefficient and is obtained from a modified form of Ergun equation[11].
4. Energy equation The thermal energy equations for gas and solid phases are respectively,
Prosiding PPI - PDIPTN 2007 Pustek Akselerator dan Proses Bahan - BATAN Yogyakarta, 10 Juli 2007
Alexander Agung
αg
g
C p, g
αg αp
p
C p, p
DT p Dt
ISSN 0216 - 3128
DT g g
Dt Tg
αp
p
h pg T p Tp
IV. IMPLEMENTATION
αgvg
pg
(11)
Tg
h pg Tg
Tp
Sf
(12)
where Tg and Tp are the gas solid phase temperature, respectively, and are the conductive g p coefficient, hpg is the interphase volumetric heat transfer coefficient, and Sf is the heat source from fission. The granular energy equation can be written as 3 2
αp
p
αp
t
p
vp
: vp
67
q
(13)
γ 3β
where the term 3β represents the loss of particle kinetic energy to the gas phase due to particle-gas drag forces, γ is the collisional energy dissipation and q is the flux of fluctuating energy.
The geometry of the reactor used in subsequent calculations is shown in Fig. 3(a). The reactor is modeled as a 2D axisymmetrical cylinder and discretized using quadrilateral finite elements. Fig. 3(b) shows the finite element mesh of the reactor. The computational domain consists of 2800 volume elements with 2961 nodes. The geometry is divided into two zones: (i) a solid region (graphite reflector) and (ii) a fluid region (the cavity enclosed by the reflector). Neutronic calculations performed by EVENT consider both the solid and fluid regions while for fluid dynamics calculations (FLUIDITY code) only the fluid region is of interest. The material cross-section libraries are processed using the WIMS8A code[13] and the resulting cross-section libraries are subsequently converted into a special FETCH-readable format using the WIMS8AFETCH code. Taking into account the temperature and resonance selfshielding, the database is condensed from the original 69 energy groups into 6 energy groups.
Figure 3. (a) The 2D schematic and (b) the finite element mesh for FLUBER used for the time-dependent simulation, the left boundary is the central axis.
Prosiding PPI - PDIPTN 2007 Pustek Akselerator dan Proses Bahan - BATAN Yogyakarta, 10 Juli 2007
68
For the purpose of transient calculations, several sets of cross-sections corresponding to diffe-rent temperatures are written in one library file. The fuel temperature is set at various values (i.e. 500, 550, 600, 650, 700, 750, 800, 850, 900, 950, 1200, 1600, 2200 K), while the gas and reflector temperature are set at 1000 K and 500 K respectively. A drawback of using WIMS8A library is that it does not provide helium cross-section data, which is very essential in the FLUBER design. Hence, for the purpose of providing nuclear cross-section data of the fluidization gas, nitrogen is used instead. In terms of the angular flux of neutron, a low order of expansion (P1) is applied for both the static calculations and the time-dependent simulations. In the neutronic calculation, 6 groups of delayed neutrons[7] are incorporated but only in the solid phase. Fission product poisoning is neglected. The data obtained from FLUIDITY in terms of temperature, density and void fraction are forwarded to EVENT through an interface code which is used to interpolate temperature and gas content in the cross-section database and then updates the spatial distribution of multigroup neutron cross-sections. A neutron source of 1000 neutrons/(cm3 s) is applied for the time-dependent simulations. Several detectors are located in various positions in the bed to monitor calculated data such as volume fraction and temperature of the gas and particles. For our simulations, fourteen detectors are implemented in the bed. The simulations were performed for 120 kg of uranium inventories. An important parameter to determine how much power can be generated is the superficial velocity (ug). As a first estimation, the superficial velocity is predicted from the minimum fluidization velocity (umf). Several correlations have been established, but for our purpose the following correlations are used[3]. Re p,mf
Alexander Agung
ISSN 0216 - 3128
33.7 2
0.0408Ar
33.7, for fine particles
28.7 2
0.0494Ar
28.7, for coarse particles
where Rep,mf is the Reynolds number of the particles at minimum fluidization condition and Ar is the Archimedes number. Based on Eq. (14) the minimum fluidization spans from 23.7 cm/s for fine particles 28.7 cm/s for coarse particles. For our simulation, superficial velocity of 120 cm/s is used.
V. RESULTS A step input in gas velocity of 120 cm/s, corresponding to a coolant mass flow rate of 6.9 kg/s, is given. The time evolution of several variables is shown in Fig. 4 and the time-averaged as well as the minimum and maximum values of power, mean gas temperature and maximum particle temperature are given in Table 1. Here it is shown that the time-averaged power is 4.4 MW. Fig. 4 (a) shows the power generated in the fuel (calculated from the fission rate with a conversion factor of 3.2 10-11 J/fission). Although the static calculations show that the reactor is always subcritical, this is not the case in the dynamic simulation. The reactor produces power of the order of megawatts and the average gas temperature increases to about 333 ºC. This happens because inhomogeneities in fuel particles distribution influence the reactivity. Within less than 10 seconds after the initial transient, the reactor produces power up to 7 MW and increases the temperature to ~270 ºC (Fig. 4(b)) As the temperature coefficient of reactivity is negative, the power goes down and inhibits further increase in temperature. A strong relation between power and temperature can be found in several occasions. For example at ~35 seconds after the initial transient, the power level increases from 2.5 MW to 27 MW, causing the temperature to increase from 320 ºC to 410 ºC. Such a large temperature surge reduces the power back to ~12 MW.
(14)
Table 1. Time-averaged, minimum and maximum values of power and temperature, excluding the first 20 seconds after initial transient, for a uranium inventory of 120 kg and an input gas velocity of 120 cm/s. Power (MW)
Mean Gas Temp. (ºC)
Max. Gas Temp. (ºC)
Time-averaged
4.4
333.3
544.8
Min
0.7
296.8
393.9
Max
26.8
410.9
838.6
Prosiding PPI - PDIPTN 2007 Pustek Akselerator dan Proses Bahan - BATAN Yogyakarta, 10 Juli 2007
Alexander Agung
69
ISSN 0216 - 3128
Figure 4. Power, mean gas temperature, maximum particle temperature, concentration of the longest, 3rd longest and shortest living delayed neutron precursors for a uranium inventory of 120 kg and an input gas velocity of 120 cm/s.
The mean gas temperature in Fig. 4(b) is obtained by averaging the gas temperature over the whole fluid domain. The mean particle temperature (not shown) is very close to the gas temperature due to the good heat transfer between the particles and the gas. This figure is also a good representation of the gas power output. In fact, the gas power output should be calculated as Pgas g u z C p , g Tg dA Aout
where Aout is the area of the reactor outlet,
g
is
the density of the gas, u z is the normal velocity of the gas at the reactor outlet, C p , g is the specific heat capacity of the gas and
Tg is the gas
temperature difference between outlet and inlet of the reactor. As the fluidization process tends to homogenize the temperature, the mean value of the gas temperature may be a good estimator for the gas
Prosiding PPI - PDIPTN 2007 Pustek Akselerator dan Proses Bahan - BATAN Yogyakarta, 10 Juli 2007
70
ISSN 0216 - 3128
power output. Comparing Fig. 4(a) and 4(b) we may say that the gas power output is less oscillatory, meaning that the thermal energy to be converted to the turbogenerator for electricity production is more steady than the reactor power despite large oscillations in the fission rate. Assuming that the mass flow rate of the gas is constant and taking the data interval between 50 seconds and 160 seconds after the initial transient to represent a quasi-steady situation, the gas power output may vary between 1.3 MW and 3.3 MW. An estimate of the maximum particle temperature that may be achieved during the operation time is shown in Fig. 4(c). These data are important as the fuel temperature should be limited below 1600 ºC for a safe operation[6]. As shown in the figure, the particle temperature during the operation time is still far below the maximum permissible limit. The result shown in Fig. 4(c) does not belong to a single particle and is not at a specific location, but it is representing the maximum value occurring in the domain in a specific time. For example, at 50 seconds after the initial transient, the hottest particle can be found at the lower part of the bed close to the reflector wall (see Fig. 6(b)). Figs. 4(d), 4(e) and 4(f) present, respectively, the maximum concentration of the longest (half life = 55 seconds), the third longest (half life = 6.2 seconds) and the shortest (half life = 0.22 seconds) living delayed neutron precursors. Until the end of the simulation time, the concentration of the longest living neutron precursors is still increasing, while the third longest and the shortest living delayed precursors are already quasi-stationary. We may expect a slight increase in power as the concen-
Alexander Agung
tration of the delayed neutron precursor is approximately proportional to the fission rate. Fig. 5(a) shows the gas temperature at the bottom right of the cavity. The time-averaged value does not deviate much from the initial condition, implying the influence of the “cold” inlet gas. The temperature at the top center of the cavity is shown in Fig. 5(b) with a time-averaged value of 326.3 ºC. By examining these data and the time-averaged temperature at the top left of the cavity (Detector 06, data are not presented) of 320 ºC, the use of the mean gas temperature (Table 1) to calculate the gas power output can be justified. Furthermore, by comparing to Fig. 4(c) Fig 5(b) shows that the upper part of the cavity (outlet of the reactor) is not the hottest part of the reactor. Figure 6 shows several fields at 50 seconds after the initial transient. Particles are accumulated mostly around the central axis (see Fig. 6(a)) and large bubbles have developed. The experimental results obtained by Van der Hagen et al.[12] using a gamma tomography technique show a large particle accumulation close to the wall. The use of an axisymmetric model in the simulation causes this contrast, which can be eliminated by the use of a 3D model or a 2D cartesian coordinate system to break the symmetry. The inhomogeneous “bed height” is slightly less than half of the cavity height. The effective multiplication factor of the corresponding homogeneous bed height lies in the peak of the curve and movements of the particles within the bed from low-importance zone to high-importance zone (and vice versa) keep the reactor critical at several occasions.
Figure 5. Gas temperature at bottom right and top center of the cavity for a uranium inventory of 120 kg and an input gas velocity of 120 cm/s.
Prosiding PPI - PDIPTN 2007 Pustek Akselerator dan Proses Bahan - BATAN Yogyakarta, 10 Juli 2007
Alexander Agung
ISSN 0216 - 3128
Figure 6. (a) Particle volume fraction, (b) gas temperature (ºC), (c) the longest living delayed neutron precursor concentration (cm-3), (d) the shortest living delayed neutron precursor concentration (cm-3), for a uranium inventory of 120 kg and an input gas velocity of 120 cm/s at 50 seconds after the initial transient. The left boundary in these figures is the central axis. Prosiding PPI - PDIPTN 2007 Pustek Akselerator dan Proses Bahan - BATAN Yogyakarta, 10 Juli 2007
71
72
ISSN 0216 - 3128
The gas temperature is presented in Fig. 6(b). The temperature at the lower part of the bed is low due to the incoming cold gas. As heat is transfered from the particles to the gas, the gas becomes hotter along its way to the outlet. Observe that the maximum gas temperature lies in the lower part of the cavity close to the wall. Fig. 6(d) shows the concentration of the shortest living delayed neutron precursors. It gives an indication of the time-averaged heat source. As the half life of this precursor group is about 0.22 seconds, it is quite a good approximation of the instantaneous power distribution from fission. The maximum value can be found in the region near the graphite wall. Significant amounts of thermal neutrons can be found in this region, producing a large thermal fission rate.
Alexander Agung
REFERENCES 1. ACKROYD, R.T., The Why and How of Finite Elements, Annals of Nuclear Energy, 8:539 – 566, 1981. 2. ACKROYD, R.T., Foundations of Finite Elements Applications to Neutron Transport, Progress in Nuclear Energy, 29:43 – 56, 1995. 3. CHITESTER, D.C., KORNOSKY, R.M., FAN, L.S., and DANKOO, J.P., Characteristics of Fluidization at High Pressure, Chemical Engineering Science, 39:253 – 261, 1984. 4. De OLIVEIRA, C.R.E., An Arbitrary Geometry Finite Element Method for Multigroup Neutron Transport with Anisotropic Scattering, Progress in Nuclear Energy, 17:227 – 236, 1986.
The concentration of the longest living delayed neutron precursors with half time of 55 seconds (Fig. 6(c)) is distributed very similar to the concentration of particles. This similarity indicates that the particles, thanks to the good mixing, have been subject to the same heat source from fission over a time scale of 55 seconds.
5. GOMES, J.L.M.A., Modelling Heat and Mass Transfer in Gas-Solid Fluidized Beds Using the Two-Fluid Granular Temperature Approach, PhD thesis, Imperial College London and University of London, U.K., 2004.
VI. CONCLUSIONS
6. IAEA, Fuel Performance and Fission Product Behaviour in Gas-Cooled Reactors, IAEATECDOC-978, International Atomic Energy Agency, Vienna, Austria, 1997.
Simulations using time- and space-dependent dynamics with a coupled neutronics and multiphase flow have been performed. The following findings are reported: 1. The fission power fluctuations gas temperature is relatively initial transient. Moreover, tends to be uniform due to particles.
are large, but the steady after the the temperature rapid mixing of
2. Although the temperature is relatively steady, the initial temperature rise in some cases is quite high due to the use of a step input of the coolant flow rate. Thorough investigations should be performed especially for the startup of the reactor. One example is by introducing a ramp input instead of a step input. In such a case, a high peak of temperature after startup may be prevented. 3. The use of the 2D axisymmetric model gives a discrepancy from experimental results in terms of particle distribution in the bed. This may be resolved by using a 3D model where the particles may move across the center axis.
7. HETRICK, D.L, Dynamics of Nuclear Reactors, American Nuclear Society, Inc., La Grange Park, Illinois, 1993. 8. MANSOORZADEH, S., PAIN, C.C., de OLIVEIRA, C.R.E., and GODDARD, A.J.H., Finite Element Simulations of Incompressible Flow Past a Heated/Cooled Sphere, International Journal of Numerical Methods in Fluids, 28:903 – 915, 1998. 9. PAIN, C.C., MANSOORZADEH, S., de OLIVEIRA, C.R.E., and GODDARD, A.J.H., 2001a, Numerical Modelling of Gas-Solid Fluidized Beds Using the Two-Fluid Approach, International Journal of Numerical Methods in Fluids, 36:91 – 124. 10. PAIN, C.C., de OLIVEIRA, C.R.E., and GODDARDS, A.J.H., Non-Linear Space-Dependent Kinetics for Criticality Assessment of Fissile Solutions, Progress in Nuclear Energy, 39:53 – 114. 11. PAIN, C.C., MANSOORZADEH, S., GOMES, J.L.M.A., and OLIVEIRA, C.R.E., A Numerical Investigation of Bubbling Gas-Solid Fluidized Bed Dynamics in 2-D Geometries, Powder Technology, 128:56 – 77, 2002.
Prosiding PPI - PDIPTN 2007 Pustek Akselerator dan Proses Bahan - BATAN Yogyakarta, 10 Juli 2007
Alexander Agung
ISSN 0216 - 3128
12. VAN DER HAGEN, T.H.J.J., VAN DAM, H., HARTEVELD, W., HOOGENBOOM, J.E., Neutronics and Thermal Aspects of a Fluidized Bed Fission Reactor, Proceeding ICENES, pp. 196, Obninsk, Russia, 1996. 13. WIMS8A, User Guide for Version 8, Technical Report ANSWERS/WIMS (99)9, AEA Technology, 1999.
73
Alexander Agung
Banyak faktor yang mempengaruhi baik dari segi pemodelan maupun fisis antara lain kecepatan gas masuk yang berbeda akan menyebabkan regime fluidisasi berubah dan dapat menyebabkan fluktuasi suhu yang besar. Dari segi pemodelan penggunaan model 2 dimensi aksisimetris menyebabkan partikel terlalu terkonsentrasi di bagian tengah dan gerakan partikel terlalu acak. Hal ini dapat diatasi dengan penggunaan model 3D.
TANYA JAWAB Tri Mardji Atmono Rippel yang diperoleh dari hasil pengamatan/ (komputasi) temperatur terlalu besar, dari mana saja sumber kesalahannya.
Prosiding PPI - PDIPTN 2007 Pustek Akselerator dan Proses Bahan - BATAN Yogyakarta, 10 Juli 2007