The maps are combined using MultiResponse Sparse Regres- sion and the ... In order to create the linear system, we have to remove a calibration set from the ... calibration data are used as the variables of the linear equations and the removed ... When the α is solved, it can be used to estimate the originally missing values.
Sparse Linear Combination of SOMs for Data Imputation: Application to Financial Database Antti Sorjamaa1, Francesco Corona1, Yoan Miche1 , Paul Merlin2 , Bertrand Maillet2 , Eric S´everin3 , and Amaury Lendasse2 1
2
Department of Information and Computer Science Helsinki University of Technology, Finland A.A. Advisors-QCG (ABN AMRO) – Variances, CES/CNRS and EIF, University of Paris-1, France 3 Department GEA, University of Lille 1, France
Abstract. This paper presents a new methodology for missing value imputation in a database. The methodology combines the outputs of several Self-Organizing Maps in order to obtain an accurate filling for the missing values. The maps are combined using MultiResponse Sparse Regression and the Hannan-Quinn Information Criterion. The new combination methodology removes the need for any lengthy cross-validation procedure, thus speeding up the computation significantly. Furthermore, the accuracy of the filling is improved, as demonstrated in the experiments.
1
Introduction
The presence of missing values in the underlying time series is a recurrent problem when dealing with databases [1]. Number of methods have been developed to solve the problem and fill the missing values. Self-Organizing Maps [2] (SOM) aim to ideally group homogeneous individuals, highlighting a neighborhood structure between classes in a chosen lattice. The SOM algorithm is based on unsupervised learning principle where the training is entirely stochastic, data-driven. No information about the input data is required. Recent approaches propose to take advantage of the homogeneity of the underlying classes for data completion purposes [3]. Furthermore, the SOM algorithm allows projection of high-dimensional data to a low-dimensional grid. Through this projection and focusing on its property of topology preservation, SOM allows nonlinear interpolation for missing values. This paper describes a new method, which combines several SOMs in order to enhance the accuracy of the nonlinear interpolation. The combination is achieved with a simple linear regression performed on an extracted sample from the data. The maps to be combined are selected first using a ranking of the maps by Multiresponse Sparse Regression (MRSR) and then choosing the best SOMs using the Hannan-Quinn Information Criterion. The combination improves the accuracy of the imputation as well as speeds up the process by removing the cross-validation scheme [4]. J.C. Pr´ıncipe and R. Miikkulainen (Eds.): WSOM 2009, LNCS 5629, pp. 290–297, 2009. c Springer-Verlag Berlin Heidelberg 2009 �
Sparse Linear Combination of SOMs for Data Imputation
291
The global methodology is presented in the next section, including all the methods combined in the global methodology. The Section 3 demonstrates the accuracy of the methodology.
2
Global Methodology
The global methodology is summarized in Figure 1.
Fig. 1. Global methodology summarized
The core of the methodology is the Self-Organizing Map (SOM). Several SOMs are trained using different number of nodes and the imputation results of the best SOMs are linearly combined. In order to create the linear system, we have to remove a calibration set from the data before any processing. Then, the SOM estimations of the removed calibration data are used as the variables of the linear equations and the removed data itself as the outputs of the equations. The linear system is summarized in the following formula: ⎤ ⎡ ⎤ ⎡ ⎤ ⎡ α1 s1 sˆ1,1 sˆ1,2 · · · sˆ1,Q ⎢ sˆ2,1 sˆ2,2 · · · sˆ2,Q ⎥ ⎢ α2 ⎥ ⎢ s2 ⎥ ⎥ ⎢ ⎥ ⎢ ⎥ ⎢ (1) ⎢ .. .. ⎥ × ⎢ .. ⎥ = ⎢ .. ⎥ , .. . . ⎦ ⎣ ⎣ . . . . . ⎦ ⎣ . ⎦ sˆL,1 sˆL,2 · · · sˆL,Q
αQ
sL
where si denotes the ith removed calibration sample, sˆi,j denotes the ith calibration data sample estimated by jth SOM, L denotes the number of calibration data points, Q the number of the best SOMs used and, finally, the vector α denotes the linear system parameters. The number of SOMs Q is determined by the MultiResponse Sparse Regression and the Hannan-Quinn Information Criterion. When the α is solved, it can be used to estimate the originally missing values of the dataset from the best SOM estimations selected. In the following subsections, each of the methods is explained more deeply. 2.1
Imputation Using SOM
The SOM algorithm is based on an unsupervised learning principle, where training is entirely data-driven and no information about the input data is required [2]. Here we use a 2-dimensional network, composed of c units (or code vectors) shaped as a square lattice. Each unit of a network has as many weights as the
292
A. Sorjamaa et al.
length T of the learning data samples, xn , n = 1, 2, ..., N . All units of a network can be collected to a weight matrix m (t) = [m1 (t) , m2 (t) , ..., mc (t)] where mi (t) is the T -dimensional weight vector of the unit i at time t and t represents the steps of the learning process. Each unit is connected to its neighboring units through a neighborhood function λ(mi , mj , t), which defines the shape and the size of the neighborhood at time t. The neighborhood can be constant through the entire learning process or it can change in the course of learning. The learning starts by initializing the network node weights randomly. Then, for a randomly selected sample xt+1 , we calculate the Best Matching Unit (BMU), which is the neuron whose weights are closest to the sample. The BMU calculation is defined as mBMU (xt+1 ) = arg min {�xt+1 − mi (t)�} , mi ,i∈I
(2)
where I = [1, 2, ..., c] is the set of network node indices, the BM U denotes the index of the best matching node and �.� is a standard Euclidean norm. If the randomly selected sample includes missing values, the BMU cannot be solved outright. Instead, an adapted SOM algorithm, proposed by Cottrell and Letr´emy [5], is used. The randomly drawn sample xt+1 having missing value(s) is split into two subsets xTt+1 = NMxt+1 ∪ Mxt+1 , where NMxt+1 is the subset where the values of xt+1 are not missing and Mxt+1 is the subset, where the values of xt+1 are missing. We define a norm on the subset NMxt+1 as � 2 �xt+1 − mi (t)�NMx = (xt+1,k − mi,k (t)) , (3) t+1
k∈NMxt+1
where xt+1,k for k = [1, ..., T ] denotes the k th value of the chosen vector and mi,k (t) for k = [1, ..., T ] and for i = [1, ..., c] is the k th value of the ith code vector. Then the BMU is calculated with
. (4) mBMU (xt+1 ) = arg min �xt+1 − mi (t)�NMx mi ,i∈I
t+1
When the BMU is found the network weights corresponding to the nonmissing values of xt+1 are updated as � mi (t + 1) = mi (t) − ε(t)λ mBMU (xt+1 ) , mi , t [mi (t) − xt+1 ] , ∀i ∈ I, (5) where ε(t) is the adaptation gain parameter, which is ]0, 1[-valued, decreasing gradually with time. The number of neurons taken into account during the weight update depends on the neighborhood function λ(mi , mj , t). The number of neurons, which need the weight update, usually decreases with time. After the weight update the next sample is randomly drawn from the data matrix and the procedure is started again by finding the BMU of the sample. The learning procedure is stopped when the SOM algorithm has converged. Once the SOM algorithm has converged, we obtain some clusters containing our data. Cottrell and Letr´emy proposed to fill the missing values of the dataset
Sparse Linear Combination of SOMs for Data Imputation
293
by the coordinates of the code vectors of each BMU as natural first candidates for the missing value completion: � π(Mx ) (x) = π(Mx ) mBMU (x) , (6) where π(Mx ) (.) replaces the missing values Mx of sample x with the corresponding values of the BMU of the sample. The replacement is done for every data sample and then the SOM has finished filling the missing values in the data. The procedure is summarized in Table 1. There is a toolbox available for performing the SOM algorithm in [6]. Table 1. Summary of the SOM algorithm for finding the missing values
1. SOM node weights are initialized randomly 2. SOM learning process begins (a) Input x is drawn from the learning data set X i. If x does not contain missing values, BMU is found according to Equation 2 ii. If x contains missing values, BMU is found according to Equation 4 (b) Neuron weights are updated according to Equation 6 3. Once the learning process is done, for each observation containing missing values, the weights of the BMU of the observation are substituted for the missing values
2.2
MultiResponse Sparse Regression
Multiresponse Sparse Regression, proposed by Timo Simil¨ a and Jarkko Tikka in [7] is a variable ranking technique and an extension of the Least Angle Regression (LARS) algorithm [8]. The main idea of the algorithm is the following: Denote by X = [x1 . . . xm ] the n × m regressor matrix. MRSR adds each column of the regressor matrix ˆ k = [ˆ ˆ k = XWk , where Y ˆ pk ] is the target y1k . . . y one by one to the model Y k approximation of the model. The W weight matrix has k nonzero rows at kth step of the MRSR. With each new step a new nonzero row, and a new column of the regressor matrix is added to the model. More specific details of the MRSR algorithm can be found from the original paper [7]. An important detail shared by the MRSR and the LARS is that the ranking obtained is exact, if the problem is linear. Here, in this paper, we linearly combine the SOM estimations of the missing values and, therefore, we have an exact ranking of the estimations.
294
2.3
A. Sorjamaa et al.
Hannan-Quinn Information Criterion
Because the MRSR only ranks the SOM estimations, we need a method to actually select the optimal number of input variables. This kind of selection can be considered as a complexity selection or input variable selection. There are many possible criteria for complexity selection used in machine learning. Typical examples are Akaike’s information criterion (AIC) [9] or the Bayesian Information Criterion (BIC) [10]. Their expression is usually based on the residual sum of squares (Res) of the considered model (first term of the criterion) plus a penalty term (second term of the criterion). Differences between criteria mostly occur on the penalty term. The AIC penalizes only according to the number of parameters p of the model, shown in Equation 7, whereas the BIC takes into account also the number of samples N used for the model training, Equation 8. �
Res + p × log N, (7) BIC = N × log N
� Res AIC = N × log + 2 × p. (8) N The AIC is known to have consistency problems: while minimizing the AIC, it is not guaranteed that the complexity selection will converge toward an optima, if the number of samples goes to infinity [11]. The main idea raised by this observation is about trying to balance the underfitting and the overfitting when using such a criterion. This is achieved through the penalty term, for example, by having a log N based term in the penalty, which the BIC has. Unfortunately, in our previous experiments, the BIC criterion failed to give proper results in terms of complexity. The Hannan-Quinn Information Criterion (HQ) [12] is very close to the other two criteria. The HQ is defined as �
Res + 2 × p × log(log N ). (9) HQ = N × log N The idea behind the design of this criterion is to provide a consistent criterion, unlike the AIC, and in which the penalty term 2 × p × log(log N ) grows with a very slow rate regarding the number of samples. In this paper, the HQ criterion is used to select an optimal number of already ranked SOM estimations to be combined. The number of samples corresponds to the number of selected training points from the training dataset and the number of parameters to the number of SOM estimations to be combined.
3
Experiments
In the following experiments, we use a financial fund dataset. The dataset is classified and, therefore, our possibilities to mention any specifics are very limited. The dataset can be downloaded from [13].
Sparse Linear Combination of SOMs for Data Imputation
295
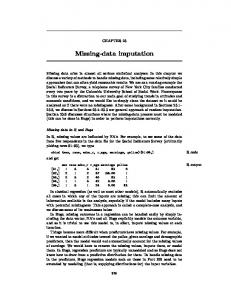
The dataset contains 120 time series of funds from a total of 121 months each. The data has been normalized and rescaled. The series are correlated in time and between series and there are no missing values originally present in the dataset. Figure 2 shows 15 example series of the original 120 rescaled fund values.
Scaled Fund Values
1500
1000
500
0 Dec−1995
Aug−1997
Apr−1999
Dec−2000 Dates
Aug−2002
Apr−2004
Dec−2005
Fig. 2. Rescaled and normalized fund values of 15 funds present in the database
Before running any experiments, we randomly remove 20 percent of the data as a test set. The test set contains roughly 2900 values. In our methodology, there is no need for actual validation set, but in order to calculate the linear model parameters for the SOMs, we have to remove a set of data that will be used as output of the linear model. For that purpose, 20 percent of the remaining data are removed, which corresponds to roughly 2300 values, and the set is called calibration set. According to the methodology, several SOMs are trained using different amount of nodes. Figure 3 shows the training evaluation error with respect to the SOM size. In this paper, the SOM size is actually the length of the dimension of the square lattice. So, for example, size 10 means a square SOM grid of size 10×10, a total of 100 nodes. From Figure 3 we can see that the best SOM size, according to this simple calibration evaluation, is 6. It means that the som with only 36 nodes is the most optimal to fill in the missing training evaluation values. Of course, if we would use a standard SOM for the filling, we should use a lengthy Cross-Validation scheme to validate the SOM size. But even that lengthy process does not guarantee that the SOM to be used to fill the test set values is properly validated. Figure 4 shows the Hannan-Quinn Information Criterion values with respect to the number of SOMs in the combination. From Figure 4 we can see that the most optimal value is reached with 12 SOMs. The selected SOM sizes are 7, 9, 12, 16, 18, 20, 21, 22, 23, 24, 25 and 26. Here the maximum SOM grid size was 26. From the previous list we can clearly see that the small SOM grids are not accurate enough to be included in
296
A. Sorjamaa et al. −3
Training Evaluation Error
x 10 2.4 2.3 2.2 2.1 2 1.9 1.8
5
10
15 SOM Size
20
25
Fig. 3. SOM training evaluation errors with respect to the SOM size −3
HQ Value
1.75
x 10
1.7
1.65
1.6 5
10 15 20 Number of SOMs in the Combination
25
Fig. 4. Hanna-Quinn Information Criterion values for the selection of SOMs in the combination
the combination, but several larger sizes are. Comparing this to Figure 4 it is also clear that after the 12 selected SOMs the HQ value starts to increase, which means that the rest of the SOMs do not improve the results. After the calibration, the obtained models are used to fill in the test set. In Table 2 the errors are summarized. From Table 2 we can see that the Combination of the SOMs clearly outperforms the single SOM decreasing the test error by 18 percent. Table 2. Test Errors for the SOM and the Combined SOMs 10−3 SOM Combined SOMs
Training Evaluation Error Test Error 1.8
1.6 1.3
Sparse Linear Combination of SOMs for Data Imputation
4
297
Conclusions
As the experiments demonstrate, the new methodology combining several SelfOrganizing Maps is at least as accurate in filling of the missing values than single SOM alone. At the same time, the calculation time is reduced significantly (almost divided by 10), because of the removal of the cross-validation phase from the SOM. Further work consists of finding other ways to combine the SOMs and compare the achieved performance to other popular imputation methods. Acknowledgment. Part of the work of Antti Sorjamaa is supported by a grant from Nokia Foundation, Finland. Part of the work of Amaury Lendasse is supported by Pattern Analysis, Statistical Modelling and Computational Learning (PASCAL2) Network of Excellence funded by the European Union.
References 1. Sorjamaa, A., Lendasse, A., Cornet, Y., Deleersnijder, E.: An improved methodology for filling missing values in spatiotemporal climate data set. Computational Geosciences (February 2009) (online publication), doi:10.1007/s10596-009-9132-3 2. Kohonen, T.: Self-Organizing Maps. Springer, Berlin (1995) 3. Wang, S.: Application of self-organising maps for data mining with incomplete data sets. Neural Computing and Applications 12(1), 42–48 (2003) 4. Sorjamaa, A., Liiti¨ ainen, E., Lendasse, A.: Time series prediction as a problem of missing values: Application to estsp2007 and nn3 competition benchmarks. In: IJCNN, International Joint Conference on Neural Networks, Documation LLC, Eau Claire, Wisconsin, USA, August 12-17, pp. 1770–1775 (2007), doi:10.1109/IJCNN.2007.4371429 5. Cottrell, M., Letr´emy, P.: Missing values: Processing with the kohonen algorithm. In: Applied Stochastic Models and Data Analysis, Brest, France, May 17-20, pp. 489–496 (2005) 6. SOM Toolbox, http://www.cis.hut.fi/projects/somtoolbox/ 7. Simil¨ a, T., Tikka, J.: Multiresponse sparse regression with application to multidimensional scaling. In: Duch, W., Kacprzyk, J., Oja, E., Zadro˙zny, S. (eds.) ICANN 2005. LNCS, vol. 3697, pp. 97–102. Springer, Heidelberg (2005) 8. Efron, B., Hastie, T., Johnstone, I., Tibshirani, R.: Least angle regression. In: Annals of Statistics, vol. 32, pp. 407–499 (2004) 9. Akaike, H.: A new look at the statistical model identification. IEEE Transactions on Automatic Control 19(6), 716–723 (1974) 10. Schwarz, G.: Estimating the dimension of a model. Annals of Statistics 6, 461–464 (1978) 11. Bhansali, R.J., Downham, D.Y.: Some properties of the order of an autoregressive model selected by a generalization of akaike’s epf criterion. Biometrika 64(3), 547– 551 (1977) 12. Hannan, E.J., Quinn, B.G.: The determination of the order of an autoregression. Journal of the Royal Statistical Society, B 41, 190–195 (1979) 13. TSPCi Group Downloads, http://www.cis.hut.fi/projects/tsp/?page=Downloads