Atmos. Chem. Phys., 5, 2593–2602, 2005 www.atmos-chem-phys.org/acp/5/2593/ SRef-ID: 1680-7324/acp/2005-5-2593 European Geosciences Union
Atmospheric Chemistry and Physics
Spatial and temporal characterization of SCIAMACHY limb pointing errors during the first three years of the mission C. von Savigny1 , J. W. Kaiser2 , H. Bovensmann1 , J. P. Burrows1 , I. S. McDermid3 , and T. Leblanc3 1 Institute
of Environmental Physics (IUP/IFE), University of Bremen, Otto-Hahn-Allee 1, 28334 Bremen, Germany Sensing Laboratories, University of Zurich, Winterthurerstrasse 190, 8057 Zurich, Switzerland 3 Jet Propulsion Laboratory, California Institute of Technology, Table Mountain Facility, Wrightwood, CA 92397–0367, USA 2 Remote
Received: 8 April 2005 – Published in Atmos. Chem. Phys. Discuss.: 7 June 2005 Revised: 5 September 2005 – Accepted: 19 September 2005 – Published: 29 September 2005
Abstract. Limb scattering retrievals of atmospheric minor constituent profiles require highly accurate knowledge of the tangent heights during the measurements. The limb scattering measurements of the Scanning Imaging Absorption spectroMeter for Atmospheric CartograpHY (SCIAMACHY) on Envisat are affected by tangent height errors of up to 2 km. This contribution provides a summary of the temporal and spatial variation of the SCIAMACHY limb pointing errors during the first three years of the SCIAMACHY mission. The tangent height errors are retrieved from the limb measurements in the UV-B spectral range. A seasonal modulation of the monthly mean tangent height offsets is identified with amplitudes of 800 m (220 m) before (after) the improvement of the Envisat orbit propagator model in December 2003. Even after the December 2003 orbit model improvement a constant offset component of about 1 km is present. Furthermore, pointing discontinuities are identified that coincide with the daily updates of the on-board orbit propagator model. In order to reduce the errors in ozone profile retrievals caused by pointing errors to less than 5%, the tangent heights have to be known to within 250 m.
1 Introduction UV/visible limb scattering is a powerful technique to remotely sense the chemical composition of the terrestrial atmosphere. It combines global coverage – typical of nadir backscatter measurements (e.g., with TOMS (Total Ozone Mapping Spectrometer) (Heath et al., 1975) or GOME (Global Ozone Monitoring Experiment) (Burrows et al., 1999) – with a high vertical resolution on the order of 2–3 km – typical of solar occultation measurements (e.g., with SAGE (Stratospheric Aerosol and Gas Experiment) (McCormick Correspondence to: C. von Savigny (
[email protected])
et al., 1989) or POAM (Polar Ozone and Aerosol Measurement) (Lucke et al., 1999)). In the past few years a series of new atmospheric remote sensing instruments applying the limb scattering method was launched: SOLSE/LORE (Shuttle Ozone Limb Sounding Experiment/Limb Ozone Retrieval Experiment) flying on NASA’s space shuttle in 1997 and again in 2003 (McPeters et al., 2000; Flittner et al., 2000), OSIRIS (Optical Spectrograph and InfraRed Imager System) on Odin (Llewellyn et al., 2004), SAGE III (Rault, 2005) on a Meteor-3M spacecraft, and SCIAMACHY on the European environmental satellite Envisat (Bovensmann et al., 1999). Furthermore, the limb scattering technique will also be employed by the future OMPS (Ozone Mapping and Profiling Suite) mission on a NPOESS (National Polar-Orbiting Operational Environmental Satellite) satellite, scheduled for launch in 2008. Satellite-based limb scattering measurements were used already more than 2 decades ago for observations of mesospheric ozone profiles (Rusch et al., 1984) and upper stratospheric NO2 profiles (Mount et al., 1984) using the UV spectrometer on SME (Solar Mesosphere Explorer). Yet, the greatly enhanced computing power now makes profile retrievals possible for extended altitude ranges (and also other constituents), since spherical radiative transfer (RT) models can be run online in full multiple scattering mode. One of the main issues for all existing limb scattering instruments is the accuracy with which the tangent heights (THs) can be reconstructed (von Savigny et al., 2004a). The requirements on the knowledge of orientation and position of the spacecraft are particularly strict for limb viewing instruments, because of the large distance between the satellite and the sampled air volume (about 3000 km). For instance, an angular difference of only 1 min of arc translates to a TH difference of about 1 km. Furthermore, tangent errors of only a few hundred meters can lead to significant errors in the retrieved trace gas profiles: 500 m TH error leads to errors in the retrieved ozone concentrations of up to 10%
© 2005 Author(s). This work is licensed under a Creative Commons License.
2594 in the stratosphere (von Savigny et al., 2005b) and up to 20% in the mesosphere (Rohen et al., 2005). The reason for the larger errors in the mesosphere is the larger vertical gradient, i.e. smaller scale height, of mesospheric ozone number density, at least up to the middle mesosphere. Near the secondary ozone maximum in the upper mesosphere, the ozone scale height will of course become larger again. The retrieval errors associated with pointing errors strongly depend on the shape of the minor constituent profile and will differ to a certain extent from species to species. It has been recognized early during the SCIAMACHY mission that the TH information provided in the data files is affected by errors of up to 3 km (von Savigny et al., 2003; Kaiser et al., 2004). Several different pieces of evidence indicated that the TH information in the data files was erroneous: (a) The stratospheric ozone concentration peak in SCIAMACHY ozone profile retrievals appeared at unrealistically high altitudes (near 30 km) in many cases and ozone profile comparisons with independent methods showed a fairly systematic altitude offset; (b) the noctilucent cloud (NLC) signatures apparent in the limb radiance profiles (von Savigny et al., 2004b) near the summer-mesopause at high latitudes occurred at altitudes that were higher than the present knowledge (NLCs occur at a remarkably constant altitude of about 82–84 km in the northern hemisphere); (c) elevation mirror discontinuities during solar occultation measurements coinciding with the switch-on of the sun tracker showed systematic differences between the predicted and the actual sun position (S. No¨el, pers. comm.); (d) CO2 (near 1560 nm) and O2 (b-band) retrievals from solar occultation measurements also showed systematic TH offsets (Meyer et al., 2005). Although the pointing offsets present in the solar occultation measurements are in good agreement with the offsets observed in limb mode in terms of sign and seasonal variation, there may be different pointing error contributions from sources specific for each observation geometry. For example, there may be different misalignments of the optical axes with respect to the platform reference system. Furthermore, the MIPAS (Michelson Interferometer for Passive Atmospheric Sounding, another limb-viewing instrument on Envisat (Fischer and Oelhaf, 1996)) team identified pointing errors and pointing discontinuities in the MIPAS limb measurements and von Clarmann et al. (2003) published the first evidence for problems with the Envisat attitude. As MIPAS is located on the other side of the spacecraft its viewing direction is opposite to the SCIAMACHY limb viewing direction. Limb pointing errors may be a consequence of several different problems and combinations thereof: (a) incorrect knowledge of the orientation as well as the position of the satellite platform; (b) misalignments between the instrument optical axis and the satellite platform; (c) thermal drifts of the optical bench and/or individual optical components; (d) erroneous positioning of the scanning mirrors. Schwab et al. (1996) presented a pre-launch limb pointing error budget for Atmos. Chem. Phys., 5, 2593–2602, 2005
C. von Savigny et al.: SCIAMACHY limb pointing SCIAMACHY that included all relevant sources of pointing error including thermal distortions, scanner alignment, effects of launch vibrations, ageing, misalignments between the different structural spacecraft and instrument components, as well as spacecraft attitude errors. The estimated total limb pointing error in elevation direction including systematic, harmonic and random errors originating from the spacecraft and the instrument is 0.061◦ corresponding to a TH error of about 3.4 km. The total systematic error estimate is 0.035◦ , the total harmonic error estimate is 0.021◦ , and the total random error is estimated to be 0.005◦ . The spacecraft and instrument portions of the total elevation pointing error estimates are 0.048◦ , and 0.034◦ , respectively. To investigate the apparent pointing errors a pointing retrieval from the limb measurements themselves was implemented based on the well established “knee” technique (Sioris et al., 2003; Kaiser et al., 2004) in the UV spectral range. The main purpose of this paper is to complement the special issue of Atmospheric Chemistry and Physics on SCIAMACHY calibration, validation and first results with a detailed description of the retrieved spatial and temporal characteristics of the SCIAMACHY limb pointing errors. High pointing accuracy is a crucial prerequisite not only for all scientific applications – e.g., studying polar chemical ozone loss in both hemispheres – but also for algorithm diagnostics/improvements and all validation activities. The paper is structured as follows: Sect. 2 provides a brief overview of the numerical method to retrieve pointing information from limb scattering observations in the UV-B spectral range. In Sect. 3 a detailed description of the temporal and spatial pointing variability is given. Section 4 illustrates with sample stratospheric O3 profile retrievals how the retrieval accuracy can be improved by performing a pointing retrieval prior to the minor constituent profile retrieval. Conclusions are presented in Sect. 5.
2
Method and data set
The method used to perform limb pointing retrievals from SCIAMACHY limb scattering observations is based on the now well established knee-technique (Janz et al., 1996; Merkel et al., 2001; Sioris et al., 2003; Kaiser et al., 2004). Basically, the maximum (i.e., the “knee”) in the UV limb radiance profiles caused by absorption in the Huggins/Hartley bands of O3 (Sioris et al., 2003; Kaiser et al., 2004) or Rayleigh extinction (Janz et al., 1996; Merkel et al., 2001) provides a suitable signature for pointing retrievals. For the present analysis the TRUE (Tangent height Retrieval by UVB Exploitation) (Kaiser et al., 2004) code (Version 1.4) is employed. It uses the SCIAMACHY UV limb scattering measurements in the 295 nm to 305 nm spectral range and THs ranging from about 35 km to 50 km. This TH range includes the knees of the wavelengths considered. The TH retrieval is based on SCIAMACHY Level 1 data. An optimal www.atmos-chem-phys.org/acp/5/2593/
C. von Savigny et al.: SCIAMACHY limb pointing
2595
estimation scheme is used together with the radiative transfer code SCIARAYS (Kaiser and Burrows, 2003) to adjust a constant TH offset:
Modification of orbit model
Dec 2004
Sep 2004
Jun 2004
Mar 2004
Dec 2003
Sep 2003
Apr 2003
Jan 2003
3
Oct 2002
Jul 2002
4
TH offset = engineering TH – retrieved TH
www.atmos-chem-phys.org/acp/5/2593/
Data gap (see text)
The engineering THs are the ones provided in the Level 1 data sets. For all TH retrievals shown here, the background atmosphere climatology in Nagatani and Rosenfield (1993) and the UGAMP (Universities Global Atmospheric Modeling Programme) (Li and Shine, 1995) O3 profile climatology – based on 5 years of SME, SAGE II, and SBUV O3 measurements – are used. A more detailed description of the TRUE method itself is given in Kaiser et al. (2004) and will not be repeated here. In the used spectral window (295 nm to 305 nm) the knee in the limb radiance profiles is solely due to absorption by O3 . Thus, the pointing retrieval is only possible if the atmospheric O3 profile is known or can be estimated with high accuracy. Conversely, the most important source of error of the retrieved THs is an inaccurate O3 profile. Particularly the altitude range between about 40 and 55 km is crucial for the spectral range considered here. Sensitivity studies showed (see Kaiser et al. (2004)) that scaling the O3 profile by factors of 0.8 and 1.2 leads to differences in the retrieved THs of up to 1 km. Scaling the O3 profile by factors of 0.5 and 2.0 leads to differences of up to 3 km. Therefore, the absolute accuracy of the retrieval technique is generally not better than about 1–2 km if mid-latitudes – with significant latitudinal and zonal variability in the O3 field, particularly in the winter hemisphere with its enhanced planetary wave activity – are considered. But, if the stratospheric O3 field is horizontally relatively homogeneous, then a relative retrieval precision of 300 m or better can be achieved. Since stratospheric and lower mesospheric O3 is particularly variable at mid- and high latitudes, but generally less in the tropics, only SCIAMACHY limb measurements between 20◦ N and 20◦ S are used. For all orbits analyzed a mean TH offset for this latitude range was determined. Thus, for each orbit a single TH offset was derived and is shown in the following figures. It must be noted that by looking at the TH offsets only at tropical latitudes a possible latitudinal dependence of the TH offset cannot be investigated. It was also tested how errors in the O3 absorption cross sections affect the TH retrievals. If the absorption cross sections are changed by ±2% then the TH retrievals differ by about 60 m on average. The retrieved THs are smaller (larger) if the cross sections are reduced (increased). Another important error source are differences between the actual atmospheric density profile and the used climatological density profile. This is because the Rayleighscattering cross section is proportional to atmospheric density. A sensitivity analysis using several orbits showed that perturbing the density profile by 5% leads to a mean difference in the retrieved TH offsets of 20 m with a standard
TH offset [km]
2
1
0
Pointing tests Dec 11-13, 2002
-1
Pointing anomaly June 21, 2004
-2 0
2000
4000
6000
8000
10000
12000
14000
16000
Orbit
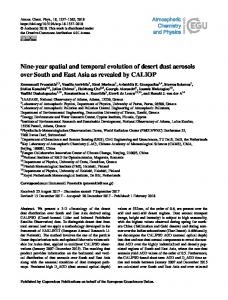
Fig. 1. Tangent height (TH) offset retrievals for all available orbits averaged over the tropical limb measurements between 20◦ S and 20◦ N between July 2002 and February 2005. In December 2003 an improvement of the Envisat orbit model took place. Before December 2003 a strong seasonal variation with an amplitude of about 800 m is present. After the update the amplitude is reduced to less than 250 m, but an offset of about 1 km remains.
deviation of about 120 m. The maximum difference for an individual limb measurement was about 400 m. Spatial straylight, i.e., radiation entering the instrument from outside its nominal field of view, could not be identified in the spectral range and the tangent height range used here. For further information on the error budget of the pointing retrievals see Kaiser et al. (2004).
3 3.1
Results General overview
Figure 1 shows the retrieved TH offsets for all orbits – between July 2002 and February 2005 – available at IUP/IFE Bremen and averaged over the tropical limb measurements as described in Sect. 2. The derived TH errors cover the range between about −0.5 km and 2.5 km, and there is (a) significant scatter in every month (about ±0.5 km), and (b) an apparent seasonal variation in the TH offsets. Summer 2003 shows a gap in the coverage lasting from 26 May 2003 until 12 September 2003. Due to a software error, the Level 0 data taken during this period was not processed by the Level 0–1b processor, and therefore the SCIAMACHY Level 1 files did not contain any limb data. However, this gap will be closed after the next reprocessing of the Level 1b data set is completed. The amplitude of the seasonal variation is suddenly reduced in December 2003. This is due to an improvement Atmos. Chem. Phys., 5, 2593–2602, 2005
2596
C. von Savigny et al.: SCIAMACHY limb pointing an overview of the monthly mean TH offsets, their standard deviations and the number of orbits used in this study.
July 2002 - November 2003
3
f(x) = c1 + c2x + c3sin(π(x - c4)/c5) Data gap (see text)
TH offset [km]
2 constant term c1 = 0.48 km
3.2 Seasonal variation between July 2002–November 2003
1
0
-1
linear term c2 = 30 m / month
sinusoidal term c3 = 0.79 km c5 = 5.84 months
-2 09/02
12/02
03/03
06/03
09/03
Month / Year
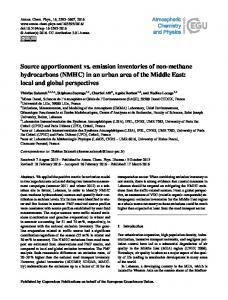
Fig. 2. The blue solid circles show the monthly mean TH offsets for the July 2002–November 2003 period. The error bars indicate the standard deviations about the monthly mean values. The TH offset variation was modeled with a superposition of a linear and a sinusoidal function. The amplitude of the sinusoidal function is c3 ≈800 m, and its period is T =2×c5 ≈12 months.
of the orbit propagator model onboard the Envisat spacecraft, that was implemented on 13 December 2003 (Duesmann et al., 2004). The on-board orbit propagator model is used to determine attitude and position of the spacecraft on-board Envisat, and its output is employed to control the limb elevation and azimuth mirror position. The on-board orbit propagator model is re-initialized twice per day, when the so-called orbit state vector (a 38 parameter vector) is uploaded to the spacecraft. An inconsistency of coordinate systems between the software used to calculate the state vectors on-ground and the software controlling the SCIAMACHY scan-mirror position based on the output of the on-board orbit model led to the pronounced seasonal variation in the platform attitude errors and consequently in the SCIAMACHY TH errors. On-board the True of Date (TOD) coordinate system was used, whereas the state vector was calculated in the Mean of 2000 (MO2K) coordinate system. Apart from the seasonal variation and the usual variability of the retrieved TH offsets there are also several additional pointing anomalies. On 21/22 June 2004 during the orbits 12071 to 12086 negative TH offsets between −1 and −2 km were retrieved. This anomaly was due to a star tracker failure. On 11–13 December tests were carried out to investigate the performance of the improved on-board orbit model. These tests also led to significant TH errors. More variability than usually was also observed in November 2003, May 2003, and several months in 2002. It is important to note in this context, that in 2003 and particularly 2002 the number of available orbits was significantly smaller than in 2004 and 2005. This can also be seen in Table 1, that presents Atmos. Chem. Phys., 5, 2593–2602, 2005
The seasonal variation of the monthly mean TH offsets for the period before the December 2003 improvement of the Envisat orbit model is shown in Fig. 2, together with a model fit composed of a linear and a sinusoidal term. Note that the shown error bars correspond to the standard deviations of the retrieved TH offsets about the monthly mean value. The variability mainly originates from the longitudinal variation discussed in Sect. 3.4. All parameters (i.e., c1 , c2 , c3 , c4 , c5 ) were fitted for. The derived constant offset (black dotted line), the linear increase (blue solid line) and the sinusoidal variation (red dashed line) are shown separately and superimposed (black solid line). The amplitude (c3 ) of the sinusoidal variation is about 800 m, the fitted period (2×c5 ) is 11.7 months – consistent with an annual variation within the error bars – and the phase (c4 ) is about 7 months with respect to the beginning of year 2002. Amplitude, period and phase of the sinusoidal variation are in very good agreement with pointing retrievals from the two other atmospheric chemistry sensors on Envisat (Saavedra et al., 2005): GOMOS (Global Ozone Monitoring by Occultation of Stars) and MIPAS (Michelson Interferometer for Passive Atmospheric Sounding). The reported annual variation in pitch pointing errors derived from both instruments is between 3×10⁻² and 4×10⁻² degrees, corresponding to about 1.5–2 km, in excellent quantitative agreement with the annual variation of about 1.6 km (two times the amplitude of 800 m) found in this study. Note that the pointing information from MIPAS and GOMOS is derived using entirely different techniques. GOMOS is a stellar occultation instrument and the difference between the predicted and the actual position of stars on the CCD detector can be used to accurately determine pointing information. The MIPAS pointing measurements used by Saavedra et al. (2005) are the weekly star passage measurements. The good agreement between SCIAMACHY, GOMOS and MIPAS pointing retrievals is a confirmation of the validity of the results presented here. The apparent annual variation in the TH offsets was caused by the coordinate system inconsistency mentioned above. This coordinate system inconsistency was eliminated with the December 2003 orbit propagator model update. 3.3
Seasonal variation between December 2003–January 2005
As mentioned before the amplitude of the seasonal variation of the TH offset after December 2003 is markedly smaller than before. The monthly mean TH offsets together with the model fit is shown in Fig. 3. The linear term (c2 ) is about a factor of 3 smaller than before December 2003. The amplitude of the sinusoidal component was found to be about www.atmos-chem-phys.org/acp/5/2593/
C. von Savigny et al.: SCIAMACHY limb pointing
2597
Table 1. Monthly tangent height offset statistics. Year
mean TH offset/km
Std. dev. /km
Number of orbits
Jul Aug Sep Oct Nov Dec Jan Feb Mar Apr May Jun Jul Aug Sep Oct
2002 2002 2002 2002 2002 2002 2003 2003 2003 2003 2003 2003 2003 2003 2003 2003
0.57 0.89 1.40 1.38 1.43 0.84 0.44 0.25 0.03 0.06 0.21 — — — 1.67 1.68
0.45 0.40 0.30 0.21 0.21 0.37 0.40 0.37 0.19 0.26 0.52 — — — 0.25 0.23
17 71 26 34 34 31 132 136 158 166 94 0 0 0 91 184
220 m. The fitted period (2×c5 ) of the sinusoidal variation is only about 9 months. However, within the error bars the derived variation of the mean TH offsets is also in agreement with a period of 12 months. At present, we cannot state with certainty that the 9 month period is real. An important question is, whether the remaining seasonal variation after the December 2003 orbit model update is real or a consequence of possible seasonally varying differences between the used ozone climatology and the actual ozone profiles. In principle, it is conceivable that the seasonal variation is at least partly due to the ozone climatology used. A 5% difference in the upper stratospheric and lower mesospheric ozone concentrations is sufficient to cause a 250 m difference in the retrieved TH offsets. However, the sunacquisition observations during solar occultation (see (c) in Sect. 1) also yield a remaining seasonal variation after December 2003 with an amplitude of about 250 m, in agreement with the amplitude derived from the TRUE retrievals within the scatter of both data sets. In summary, we think that the remaining seasonal variation after December 2003 is to a large extent real. Moreover, a constant component (c1 ) of about 1 km is present. This offset may be due to a misalignment of the limb optical axis with respect to the platform, or due to a remaining problem with the orbit propagator model. It is also conceivable that temporal inconsistencies in the data processing cause the offset. Considering that the entire spacecraft performs a pitch-rotation by 360◦ in about 100 min (one orbit period), a TH offset of 1 km translates to a temporal error of only about 0.25 s. The origin of this offset is further investigated and a correction will be implemented in a future version of the SCIAMACHY Level-0-to-1 processor. Important in this context is the comparison of SCIAMACHY limb www.atmos-chem-phys.org/acp/5/2593/
Month
Year
mean TH offset/km
Std. dev. /km
Number of orbits
Nov Dec Jan Feb Mar Apr May Jun Jul Aug Sep Oct Nov Dec Jan
2003 2003 2004 2004 2004 2004 2004 2004 2004 2004 2004 2004 2004 2004 2005
1.57 0.90 1.04 1.04 1.20 1.22 1.12 0.92 0.73 0.68 0.83 0.83 1.03 1.06 1.12
0.33 0.50 0.24 0.23 0.24 0.22 0.17 0.43 0.24 0.24 0.27 0.23 0.20 0.21 0.24
163 166 294 261 375 391 405 361 307 334 399 199 302 247 326
3
December 2003 - January 2005 f(x) = c1 + c2x + c3sin(π(x - c4)/c5)
2
TH offset [km]
Month
constant term c1 = 1.04 km
1
0
-1
sinusoidal term c3 = 0.22 km c5 = 4.5 months
linear term c2 = - 12 m / month
-2 02/04
05/04
08/04
11/04
Month / Year
Fig. 3. Retrieved and modeled monthly mean TH offsets for the December 2003–January 2005 period. The amplitude of the sinusoidal modulations is reduced to about 1/4 of the value during the July 2002–November 2003 period (Fig. 2). However, a nearly constant offset of approximately 1 km remains.
O3 profile measurements in 2004 with an extensive set of independent measurements (Brinskma et al., 2005) that also yielded an altitude offset of about 1–1.5 km. In summary, the pointing retrievals suggest that the December 2003 improvement of the orbit propagator model led to (a) a reduced seasonal variation, (b) a reduced linear change, and (c) an increased constant offset component of the TH offsets. Atmos. Chem. Phys., 5, 2593–2602, 2005
2598 3.4
C. von Savigny et al.: SCIAMACHY limb pointing Longitudinal variation of the TH offsets
Kaiser et al. (2004) report sudden limb pointing discontinuities of up to 2.5 km that occur within a few limb measurements, i.e. within a few minutes. Furthermore, Kaiser et al. (2004) find that the discontinuities are in very good agreement in terms of magnitude and sign – considering that MIPAS and SCIAMACHY look in opposite directions – with pointing discontinuities derived from MIPAS limb-emission measurements in September 2002 using the method of von Clarmann et al. (2003). These discontinuities coincide in time with updates of the on-board orbit model that occur twice per day, always approximately at the same geographical locations: (a) around 60◦ –70◦ W between about 20◦ N and the equator – corresponding to the Caribbean and/or the northern part of South America – and (b) around 100◦ E and 45◦ S, i.e., south-west of Australia. For easier reference the updates are called Caribbean and Australian updates in the following sections. To check if pointing discontinuities occur systematically at these locations, the longitudinal variation of the 20◦ S to 20◦ N mean TH offset is shown in Fig. 4 for several months before and after the orbit model improvement in December 2003. A closer inspection of Fig. 4 shows that for the months before December 2003 (left column) the Caribbean update (near 60◦ W) is in many cases associated with considerable pointing discontinuities, reaching values of about 2 km for example in May 2003. However, the magnitude of the discontinuities differs significantly from day to day. The impact of the Australian update on the TH offsets is not as obvious, but manifests itself in many cases in a bump around 100◦ E. Its magnitude is also highly variable but generally less than about 0.5 km. After the Australian update the retrieved TH errors increase almost linearly from orbit to orbit (the longitudes of the equator crossings move from east to west), until the Caribbean update takes place, and the THs are corrected again. Although this appears to be a repeating pattern a simple parametrization that would allow for an analytical TH correction is not possible due to the apparent random variability of the magnitude of the discontinuities. Interestingly the months after December 2003 exhibit a distinctly different longitudinal variation of the mean tropical TH offsets. The large pointing discontinuities previously associated with the Caribbean updates are not present any more. However, the Australian update now shows a more pronounced TH jump with values of up to about 800 m, and even more in a few cases. It is important to realize that some of the features present in the retrieved longitudinal variation of the TH offsets may in part be retrieval artifacts originating from differences between the actual middle atmospheric O3 profile and the assumed climatological and zonally averaged UGAMP O3 profile. Any zonal variation in the true atmospheric O3 field will introduce a zonal variation in the TH retrievals to a certain extent. However, there is no doubt that the retrieved pointing Atmos. Chem. Phys., 5, 2593–2602, 2005
discontinuities, that coincide exactly with the daily updates of the on-board orbit propagator model are real and not spuriously introduced by differences between the O3 climatology and the actual O3 profile. Furthermore, the panels a) – e) of Fig. 4 show for many days a nearly linear increase of the TH offset between the Australian and the Caribbean update. This behavior is consistent with a slow pointing drift from orbit to orbit, until the pointing is corrected again, and indicates that the pointing retrieval is precise to within a few hundred meters.
4
Improvement of O3 profile retrievals by pointing correction
In this section the improvement of the stratospheric O3 profile retrievals applying the derived TH offsets is investigated with a sample coincident measurement with the LIDAR (McDermid et al., 1995; Leblanc and McDermid, 2000) at Table mountain (California, USA). The SCIAMACHY stratospheric O3 profiles are retrieved exploiting the Chappuis absorption bands of O3 using the technique (Stratozone version 1.61) described in von Savigny et al. (2005a). With this method stratospheric O3 profiles can be retrieved in the 15– 40 km altitude range with a vertical resolution of about 4 km and a theoretical accuracy of about 5–10% (von Savigny et al., 2005b). We use a limb measurement on 20 September 2004 (Orbit 13379) with a mean tangent point location of 35.8◦ N/−122.2◦ E made at 18:10:55 UTC. The location of the LIDAR instrument is 34.4◦ N/−117.7◦ E, and the measurement was made at 06:14:00 UTC. The time difference between the measurements is therefore 12:05 h. This fairly large difference in time may in principle cause differences in the sampled O3 profiles. However, at the relatively low latitude considered here the longitudinal variation of the stratospheric O3 field are fairly small. The TRUE pointing retrieval for orbit 13379 yielded a TH offset of 1.13 km. The comparison between the LIDAR profile and the SCIAMACHY retrievals is shown in Fig. 5. Since the LIDAR profile has a significantly higher vertical resolution, it was convolved with the SCIAMACHY averaging kernels. Apparently, the SCIAMACHY O3 profile with corrected THs is in much better agreement than the uncorrected profile. In Fig. 6 the relative differences between SCIAMACHY and the LIDAR profiles as well as the relative difference between the pointing corrected and uncorrected SCIAMACHY profiles are shown. For this comparison the SCIAMACHY retrievals as well as the convolved LIDAR profiles were interpolated onto a regular 2 km altitude grid. The pointing corrected SCIAMACHY profile agrees to within about 10% with the collocated LIDAR measurement, whereas the uncorrected retrieval differs by up to 33%, and it shows a systematic high bias above the O3 concentration peak and a systematic low bias below the peak. This is indicative of a vertical displacement of the retrieved profile. www.atmos-chem-phys.org/acp/5/2593/
C. von Savigny et al.: SCIAMACHY limb pointing
2599 (f) January 2004
(a) February 2003 2
TH offset [km]
TH offset [km]
2 1 0 -1 -2
-150
-100
-50
0
50
100
1 0 -1 -2
150
-150
-100
-50
Longitude
TH offset [km]
TH offset [km]
0 -1
-150
-100
-50
0
50
100
-150
-100
-50
50
100
150
100
150
100
150
(h) June 2004 2
TH offset [km]
TH offset [km]
0
Longitude
1 0 -1
-150
-100
-50
0
50
100
1 0 -1 -2
150
-150
-100
Longitude
-50
0
50
Longitude
(d) May 2003
(i) September 2004 2
TH offset [km]
2
TH offset [km]
150
-1
(c) April 2003
1 0 -1
-150
-100
-50
0
50
100
1 0 -1 -2
150
-150
-100
Longitude
-50
0
50
Longitude (j) January 2005
(e) October 2003 2
TH offset [km]
2
TH offset [km]
100
0
-2
150
2
1 0 -1 -2
150
1
Longitude
-2
100
2
1
-2
50
(g) March 2004
(b) March 2003 2
-2
0
Longitude
-150
-100
-50
0
Longitude
50
100
150
1 0 -1 -2
-150
-100
-50
0
50
Longitude
Fig. 4. Longitudinal variation of the retrieved mean tropical TH offsets for several months before (left column) and after (right column) the orbit model update in December 2003. For the months before December 2003 the repeating discontinuity at about 60◦ W – where the updates of the on-board orbit model take place – is clearly visible. After December 2003, the longitudinal variation of the pointing offsets is different. Although the Caribbean discontinuity is gone, the signature at around 100◦ E is more pronounced. The outliers in June 2004 are due to the previously mentioned pointing anomaly on 21/22 June.
www.atmos-chem-phys.org/acp/5/2593/
Atmos. Chem. Phys., 5, 2593–2602, 2005
2600
C. von Savigny et al.: SCIAMACHY limb pointing September 20, 2004 - Orbit 13379
(SCIA_shift - SCIA_noshift) / SCIA_shift 50000
50000 SCIAMACHY pointing corrected SCIAMACHY not pointing corrected LIDAR profile convolved LIDAR profile
40000
Retrieved TH offset: 1.130 km
Altitude [m]
Altitude [m]
40000
SCIA shifted vs. not shifted (top axis) SCIA shifted vs. LIDAR (bottom axis) SCIA unshifted vs. LIDAR (bottom axis)
30000
20000
30000
20000
o
o
o
o
LIDAR: 34.4 N / -117.7 E / 06:14:00 UTC 10000
SCIA: 18
-1x10
0
35.8 N / -122.2 E / 18:10:55 UTC 18
1x10
18
2x10
18
3x10
18
4x10
18
5x10
10000 -0.6
-0.4
-0.2
0.0
0.2
0.4
0.6
(SCIA - LIDAR) / LIDAR
-3
O3 concentration [molecules m ]
Fig. 5. Comparison between SCIAMACHY O3 profile retrievals with collocated LIDAR measurement on 20 September 2004. SCIAMACHY retrievals were performed with and without the retrieved TH correction of 1.13 km. The red solid line shows the LIDAR profile convolved with the SCIAMACHY averaging kernels. The pointing correction significantly improves the agreement between the LIDAR and SCIAMACHY.
The retrieved TH offset of 1.13 km leads to relative differences between the corrected and the uncorrected O3 profiles of up to 25% above the O3 concentration peak and up to 20% below the peak. In order to reduce the retrieval error due to pointing errors to less than 5%, the TH accuracy has to be better than about 250 m. Note, that sensitivity tests showed that if the TH offset is less than about 3 km, then the O3 profile retrieved without prior TH correction may just be shifted vertically. The difference in O3 concentrations between prior TH correction and TH correction after the O3 profile retrieval is only a few percent within the 15–40 km altitude range. Only an individual comparison with an independent method is shown here and one may argue that this is not representative for the majority of the O3 profile retrievals. However, Brinskma et al. (2005) presented a comprehensive comparison of stratospheric O3 profiles (Stratozone version 1.61) retrieved with the retrieval scheme used here with O3 profiles measured with several different ground-based and satellite-based instruments. The SCIAMACHY limb data used in the Brinskma et al. (2005) study was not corrected Atmos. Chem. Phys., 5, 2593–2602, 2005
Fig. 6. Relative differences between the SCIAMACHY retrievals and the LIDAR measurement and between the pointing corrected and uncorrected SCIAMACHY profiles. The grey shaded area indicates the ±10% range.
for pointing errors using the TRUE TH offset retrievals, but a constant TH offset of 1.5 km was subtracted from all tangent heights. It was found that the applied tangent height offset — although less accurate than an orbit-per-orbit correction using the TRUE pointing retrievals – leads to a significant improvement of the profile comparisons. The offsetcorrected O3 concentrations were on average 3–6% lower than SAGE II (about 900 coincident measurements in January, March, May, September and November 2004) between 16 and 40 km with standard deviations of the differences of about 10% between 20 and 35 km. Although the absolute value of the constant TH offset correction of 1.5 km used in Brinskma et al. (2005) differs from the constant offset component c1 =1.04 km obtained for 2004 by several hundred meters, the validation results can be considered as a confirmation that the SCIAMACHY engineering TH are systematically wrong in 2004. Note, that a 1.5 km TH shift leads to differences in the O3 concentrations between 15 and 40 km of up to 25%. From a general point of view one may criticize our approach of using an ozone climatology for pointing retrievals that are then used to improve the SCIAMACHY ozone profile retrievals. However, the approach taken here – to use pointing retrievals at low latitudes, where the stratospheric www.atmos-chem-phys.org/acp/5/2593/
C. von Savigny et al.: SCIAMACHY limb pointing ozone field is not that variable – has shown to significantly improve the comparisons with independent ozone profile measurements, and is at present the best tangent height correction we can provide. Furthermore, the TRUE retrievals may help to identify further reasons for the remaining pointing errors including both software errors in the calculation of the engineering tangent heights and instrumental problems, e.g., misalignments. The correction of these possible errors may eventually lead to a further improvement of the engineering tangent height accuracy. 5 Conclusions Pointing errors are the main source of error for trace gas retrievals from limb scattering observations. Without accurate TH (tangent height) information the retrieved profiles cannot be fully validated, and not be used for most scientific applications. An overview of the spatial and temporal behavior of the pointing errors of SCIAMACHY limb scattering observations during the first 3 years of the mission has been presented. The TRUE method was applied to derive a mean TH offset – averaged over the tropical limb measurements – for each orbit. The main conclusions are: 1) The retrieved TH offsets exhibit a seasonal variation, both before and after the December 2003 improvement of the orbit propagator model. Before December 2003 the amplitude of the seasonal variation was about 800 m, and it is significantly reduced to about 220 m after December 2003. 2) The constant offset component increased from about 0.5 km before December 2003 to about 1 km after December 2003. The presence of a tangent offset of about 1 km after the December 2003 orbit model improvement is in good agreement with comprehensive validation results for the year 2004 (Brinskma et al., 2005). 3) The retrieved TH offsets show discontinuities of up to 2 km that coincide in time with updates of the on-board orbit propagator model. These updates occur two times per day. Before December 2003 the Caribbean update was associated with more pronounced discontinuities, whereas the Australian update manifested itself in bumps of generally less than 0.5 km. After December 2003 the longitudinal variation of the TH offsets differs from the period before. The pointing discontinuity associated with the Australian update is now more pronounced, and the Caribbean discontinuity has almost vanished. 4) A pointing correction performed prior to the trace gas profile retrievals significantly improves the accuracy of the profile retrievals. A TH error of only 500 m leads to errors in the derived O3 concentration of 10% and more at certain altitudes. In order to reduce the profile www.atmos-chem-phys.org/acp/5/2593/
2601 retrieval errors due to TH errors to less than 5%, the TH accuracy has to be better than about 250 m. The pointing retrievals presented here are not used for a correction of the operational SCIAMACHY limb data products. Instead, the historic data set will be reprocessed with an updated version of the Level-0-to-1 processor that includes a correction for the coordinate system inconsistency that led to the strong seasonal variation before the December 2003 orbit model update. The cause of the constant offset component of about 1 km after December 2003 is presently being investigated and will be corrected for in a future version of the Level-0-to-1 processor. Acknowledgements. We are indebted to all members of the SCIAMACHY team whose efforts made this analysis possible. We particularly thank Drs. S. No¨el (IUP/IFE), M. Gottwald (DLR), E. Krieg (DLR), B. Duesmann (ESA), J. Frerick (ESA) and C. Sioris (SAO) for helpful discussions. This study was in part funded by the University of Bremen, the German Ministry of Education and Research BMBF (grant 07UFE12/8) and the German Aerospace Center DLR (grant 50EE0027). Some of the retrievals were performed at the HLRN (High Performance Computing Center North). The HLRN service and support is gratefully acknowledged. Edited by: H. Kelder
References Bovensmann, H., Burrows, J. P., Buchwitz, M., Frerick, J., No¨el, S., Rozanov, V. V., Chance, K. V., and Goede, A. P. H.: SCIAMACHY: Mission Objectives and Measurement Modes, J. Atmos. Sci., 56, 127–150, 1999. Brinksma, E. J., Bracher, A., Lolkema, D. E., Segers, A. J., Boyd, I. S., Bramstedt, K., Claude, H., Godin-Beekmann, S., Hansen, G. Kopp, G., Leblanc, T., McDermid, I. S., Meijer, Y. J., Nakane, H., Parish, A., von Savigny, C., Swart, D. P. J., Taha, G., and Piters, A. J. M.: Geophysical Validation of SCIAMACHY Limb Ozone Profiles, Atmos. Chem. Phys. Discuss., 5, 4893–4928, 2005. Burrows, J. P., Weber, M., Buchwitz, M., Ladst¨atter-Weissenmayer, A., Eisinger, M., and Perner, D.: The Global Ozone Monitoring Experiment (GOME): Mission Concept and First Scientific Results, J. Atmos. Sci., 56, 151–175, 1999. Duesmann, B., Koopman, R., and Ventimiglia, L.: Envisat Attitude & Product Geolocation, presented at the Envisat Symposium, 6– 10 September, Salzburg, Austria, 2004. Fischer, H. and Oelhaf, H.: Remote sensing of vertical profiles of atmospheric trace constituents with MIPAS limb-emission spectrometers, Appl. Opt., 35(16), 2787–2796, 1996. Flittner, D. E., Bhartia, P. K., and Herman, B. M.: O3 profiles retrieved from limb scatter measurements: Theory, Geophys. Res. Lett., 27, 2601–2604, 2000. Heath, D. F., Krueger, A. J., Roeder, H. R., and Henderson, B. D.: The Solar Backscatter Ultraviolet and Ozone Mapping Spectrometer (SBUV/TOMS) for Nimbus G, Opt. Eng., 14, 323–331, 1975. Janz, S. J., Hilsenrath, E., Flittner, D., and Heath, D.: Rayleigh scattering attitude sensor, Proc. SPIE, 2831, 146–153, 1996.
Atmos. Chem. Phys., 5, 2593–2602, 2005
2602 Kaiser, J. W. and Burrows, J. P.: Fast Weighting Functions for Retrievals from Limb Scattering Measurements, J. Quant. Spectrosc. Radiat. Transfer, 77(3), 273–283, 2003. Kaiser, J. W., von Savigny, C., Eichmann, K.-U., No¨el, S., Bovensmann, H., and Burrows, J. P.: Satellite Pointing Retrieval from Atmospheric Limb Scattering of Solar UV-B Radiation, Can. J. Phys., 82, 1041–1052, 2004. Leblanc, T. and McDermid, I. S., Stratospheric Ozone Climatology From Lidar Measurements at Table Mountain (34.4◦ N, 117.7◦ W) and Mauna Loa (19.5◦ N, 155.6◦ W), J. Geophys. Res., 105, 14 613–14 623, 2000. Li, D. and Shine, K. P.: A 4-dimensional ozone climatology for UGAMP models, UGAMP Internal Report, 35, 1995. Llewellyn, E. J., Lloyd, N. D., Degenstein, D. A., Gattinger, R. L., Petelina, S. V., Bourassa, A. E., Wiensz, J. T., Ivanov, E. V., McDade, I. C., Solheim, B. S., McConnell, J. C., Haley, C. S., von Savigny, C., Sioris, C. E., McLinden, C. A., Griffioen, E., Kaminski, J., Evans, W. F. J., Puckrin, E., Strong, K., Wehrle, V., Hum, R. H., Kendall, D. J. W., Matsushita, J., Murtagh, D. P., Brohede, S., Stegman, J., Witt, G., Barnes, G., Payne, W. F., Piche, L., Smith, K., Warshaw, G., Deslauniers, D.-L., Marchand, P., Richardson, E. H., King, R. A., Wevers, I., McCreath, W., Kyr¨ol¨a, E., Oikarinen, L., Leppelmeier, G. W., Auvinen, H., M´egie, G., Hauchecorne, A., Lef`evre, F., de La N¨oe, J., Ricaud, P., Frisk, U., Sjoberg, F., von Scheele, F., and Nordh, L.: The OSIRIS instrument on the Odin satellite, Can. J. Phys., 82, 411– 422, doi:10.1139/P04-005, 2004. Lucke, R. L., Korwan, D., Bevilaqua, R. M., Hornstein, J. S., Shettle, E. P., Chen, D. T., Daehler, M., Lumpe, J. D., Fromm, M. D. Debrestian, D., Neff, B., Squire, M., K¨onig-Langlo, D., and Davies, J.: The Polar Ozone and Aerosol Measurement (POAM) II instrument and early validation results, J. Geophys. Res., 104, 18 785–18 799, 1999. McCormick, M. P., Zawodny, J. M., Veiga, R. E., Larsen, J. C., and Wang, P. H.: An Overview of SAGE I and II Ozone Measurements, Planet. Space Sci., 37, 1567–1586, 1989. McDermid, I. S., Walsh, T. D., Deslis, A., and White, M. L.: Optical Systems Design for a Stratospheric Lidar, Applied Optics, 34, 6201–6210, 1995. McPeters, R. D., Janz, S. J., Hilsenrath, E., Brown, T. L., Flittner, D. E., and Heath, D. F.: The retrieval of O3 profiles from limb scatter measurements: Results from the Shuttle Ozone Limb Sounding Experiment, Geophys. Res. Lett., 27, 2597–2600, 2000. Merkel, A. W., Barth, C. A., and Bailey, S. M.: Altitude determination of ultraviolet measurements made by the student nitric oxide explorer, J. Geophys. Res., 106(A12), 30 283–30 290, 2001. Meyer, J., Bracher, A., Rozanov, A., Schlesier, A. C., Bovensmann, H., and Burrows, J. P.: Solar occultation with SCIAMACHY: algorithm description and first validation, Atmos. Chem. Phys., 5, 1589–1604, 2005, SRef-ID: 1680-7324/acp/2005-5-1589. Mount, G. H., Rusch, D. F., Noxon, J. F., Zawodny, J. M., and Barth, C. A.: Measurements of stratospheric NO2 from the SME satellite, J. Geophys. Res., 89, 1327–1340, 1984. Nagatani, R. M. and Rosenfield, J. E.: Temperature, net heating and circulation, in: The atmospheric effects of stratospheric aircraft: report of the 1992 models and measurements workshop, edited by: Prather, M. J. and Remsberg, E. E., NASA Ref. Publ. 1292, A1–A47, 1993.
Atmos. Chem. Phys., 5, 2593–2602, 2005
C. von Savigny et al.: SCIAMACHY limb pointing Rault., D. F.: Ozone profile retrieval from SAGE III limb scattering measurements, J. Geophys. Res., 110, D09309, doi:10.1029/2004JD004970, 2005. Rohen, G. J., von Savigny, C., Llewellyn, E. J., Kaiser, J. W., Eichmann, K.-U., Bracher, A., Bovensmann, H., and Burrows, J. P.: Ozone Profiles Retrieved from SCIAMACHY Limb Spectra from 35 to 65 km and Ozone Depletion During the Oct./Nov. Solar Proton Event, Adv. Space Res., accepted, 2005. Rusch, D. W., Mount, G. H., Barth, C. A., Thomas, R. J., and Callan, M. T.: Solar mesosphere explorer ultraviolet spectrometer: measurements of ozone in the 1.0–0.1 mb region, J. Geophys. Res., 89, 11 677–11 678, 1984. Saavedra, L., Mantovani, R., and Dehn, A.: Envisat restituted pitch assessment, Document-No. ENVI-SPPA-EOPG-TN-050011, available upon request from
[email protected], 2005. Schwab, A., Mager, R., and. Fricke, W.: SCIAMACHY pointing error budget, Dornier technical note TN-SCIA-0000DO/06, issue A, 1996. Sioris, C. E., Haley, C. S., McLinden, C. A., von Savigny, C., McDade, I. C., McConnell, J. C., Evans, W. F. J., Lloyd, N. D., Llewellyn, E. J., Chance, K. V., Kurosu, T. P., Murtagh, D. P., Frisk, U., Pfeilsticker, K., B¨osch, H., Weidner, F., Strong, K., Stegman, J., and M´egie, G.: Stratospheric profiles of nitrogen dioxide observed by optical spectrograph and infrared imager system on the Odin satellite, J. Geophys. Res., 108(D7), 4215, doi:10.1029/2002JD002672, 2003. von Clarmann, T., Glatthor, N., Grabowski, U., H¨opfner, M., Kellmann, S., Kiefer, M., Linden, A., Tsidu, G. M., Milz, M., Stiller, G. P., Wang, D. Y., Fischer, H., Funke, B., Gil-L´opez, S., L´opez-Puertas, M.: Retrieval of temperature and tangent altitude pointing from limb emission spectra recorede from space by the Michelson Interferometer for Passive Atmospheric Sounding (MIPAS), J. Geophys. Res., 108, 4736, 2003. von Savigny, C., Rozanov, A., Bovensmann, H., No¨el, S., and Kaiser, J. W.: SCIAMACHY Limb Pointing Analysis Report, SCIAMACHY Technical Report, University of Bremen, available upon request from
[email protected], 2003. von Savigny, C., Eichmann, K.-U., Bovensmann, H., and Burrows, J. P.: Report on the 1st international workshop on limb scattering, SPARC Newsletter, 22, 2004a. von Savigny, C., Kokhanovsky, A., Bovensmann, H., Eichmann, K.U., Kaiser, J. W., No¨el, S., Rozanov, A. V., Skupin, J., and Burrows, J. P.: NLC Detection and Particle Size Determination: First Results from SCIAMACHY on ENVISAT, Adv. Space Res., 34(4), 851–856, 2004b. von Savigny, C., Rozanov, A., Bovensmann, H., Eichmann, K.-U., No¨el, S., Rozanov, V. V., Sinnhuber, B.-M., Weber, M., and Burrows, J. P.: The ozone hole break-up in September 2002 as seen by SCIAMACHY on Envisat, J. Atmosp. Sci., 62(3), 721–734, 2005a. von Savigny, C., McDade, I. C., Griffioen, E., Haley, C. S., Sioris, C. E., and Llewellyn, E. J.: Sensitivity Studies and First Validation of Stratospheric Ozone Profile Retrievals from Odin/OSIRIS Observations of Limb Scattered Solar Radiation, Can. J. Phys., 83(9), 957–972, 2005b.
www.atmos-chem-phys.org/acp/5/2593/