Aug 25, 1983 - southeastern Bering Sea by Sharon L. Smith] and Julio Vidal'. ABSTRACT. Analyses of 402 samples collected from late March through early ...
Journal of Marine Research. 42. 221-257,1984
Spatial and temporal effects of salinity, temperature and chlorophyll on the communities of zooplankton in the southeastern Bering Sea by Sharon L. Smith] and Julio Vidal'
ABSTRACT Analyses of 402 samples collected from late March through early June in 1980 have shown that the two communities of zooplankton over the southeastern shelf of the Bering Sea are kept separate spatially by the lack of advection and frontal characteristics of the salinity distributions. The abundance of copepods over the middle shelf, between 50 and 100 m isobaths approximately, was highly correlated with seasonal warming of the surface layer, while abundances of copepods over the outer shelf and slope were not. The spring bloom of phytoplankton influenced abundances over the middle shelf more profoundly than the outer shelf; of the twelve taxa which composed most of the biomass of copepods over the middle shelf, eleven were significantly more abundant during the bloom than they were prior to the bloom. Over the outer shelf, only six of eighteen taxa were significantly more abundant during the bloom, and over the slope, three of eighteen. Differences in abundance of copepods between domains and among stations within each domain were greatest early in the study. During the study, stations of each domain became more similar in the abundance of their characteristic taxa.
l. Introduction The basic organization of the southeastern Bering Sea shelf into domains separated by fronts has been defined; the outer shelf domain lies between a front located near the 200 m isobath (Kinder and Coachman, 1978) and a front located near the 100 m isobath (Coachman and Charnell, 1979), while the middle shelf domain lies between that front (100 m) and a front at the 50 m isobath (Schumacher et al., 1979). The inner shelf domain lies between the coast and the 50 m isobath. Numerous studies have examined the implications of that organization for the physics (Coachman and Charnell, 1979; Kinder and Coachman, 1978; Coachman, 1982; Schumacher et al., 1979), the nutrients (Iverson et al., 1979b; Coachman and Walsh, 1981; Hattori and Goering, 1981; Codispoti et al., 1982), the phytoplankton community (Goering and Iverson, 1981; Iverson et al., 1979a), the benthos (Haflinger, 1981), the birds (Hunt et 1. Oceanographic Sciences Division, Brookhaven National Laboratory, Upton, New York, 11973, U.S.A.
221
222
al., 1981; Schneider
Journal of Marine Research
[42, I
and Hunt, 1982), and the zooplankton (Iverson et al., I 979a; Cooney, 1981; Cooney and Coyle, 1982; Dagg et al .• 1982). Analysis of the planktonic communities of the southeastern Bering Sea is simplified by the lack of advection over the shelf (Coachman and Charnell, 1979; Schumacher et al., 1979). Currents of only 1-5 cm/s flow northwestward, paralleling the bathymetry from Unimak Pass to the Pribilof Islands in the outer shelf domain (> 100 m; Coachman and Charnell, 1979). A net flow from the slope onto the shelf should occur in the southeastern Bering Sea in order to maintain salt balance and account for the Bering Strait outflow (Kinder and Coachman, 1978), but there is also convergence and some discontinuity in the cross-shelf flux in the middle of the shelf (-100 m isobath; Coachman, 1982). This constitutes the basic division between middle and outer shelf domains and is called the middle front. Tidal currents are the main source of water movement, and they are more energetic (20-50 cm/s) than the slow drift of the mean flow (Schumacher and Kinder, 1983). It has been suggested that the seasonal cycle in biomass of zooplankton over the outer shelf and slope of the Bering Sea, like that of the subarctic North Pacific Ocean, has a peak in May and June (Heinrich, 1962; Cooney, 1981; Vidal and Smith, 1984), while over the middle shelf where a neritic, coastal community dominates the peak is in late summer (Cooney, 1981; Vidal and Smith, 1984). The causes of observed cycles in the biomass of phytoplankton, the balance between increments due to growth and losses due to grazing or sinking, have been widely discussed (Heinrich, 1961; Heinrich, 1962; Iverson et al., 1979a; Steele and Frost, 1977; Parsons et al., 1966; Walsh, 1982). A theoretical model containing many attributes of the Bering Sea shelf between the 50 and 100 m isobaths in spring predicted a lag of approximately 6 days between the peak in biomass achieved by the phytoplankton and the peak in the biomass of the herbivores Calanus and Pseudocalanus (Steele and Frost, 1977). If the biomass of zooplankton is a reproductive response to the accumulation of biomass of plants, as Steele and Frost (1977) suggest, the lag between the two is very brief. In their model, the peak in chlorophyll is approximately 8 mg/m3, whereas the peak of the bloom measured over the middle shelf of the Bering Sea was approximately 20 mg/m3 (Vidal and Smith, 1984). The peak in biomass of Pseudocalanus in the Bering Sea was 0.1 gC/m2 compared with approximately 2.3 gCjm2 in Steele and Frost's model, and while their Calanus achieved 1.8 gC/m2, Calanus marsha//ae in the Bering Sea reached 1.4 gC/m2 (Vidal and Smith, 1984). Although previous studies addressed the general concept that communities of zooplankton were distributed in accordance with major frontal characteristics in the southeastern Bering Sea (Cooney, 1981; Cooney and Coyle, 1982; Dagg et al., 1982), relatively few samples were collected, and they lacked any resolution of variations with depth. In 1980 an improved sampling design, which provided 400 samples between March 24 and June 6 and included vertical resolution, allowed us to examine details of
Smith & Vidal: Plankton of the Bering Sea
1984]
223
0
58'
! :z: •...
100
... Q.
0
200
113'
171'
169'
167'
165'
161
0
159'
157'
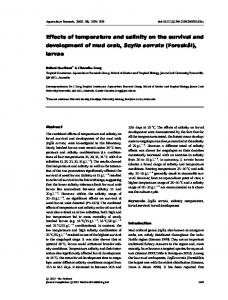
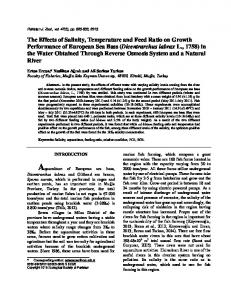
Figure I. Location of stations at which zooplankton were collected in 1980. Hatched area indicates observed spatial range in which the 32.2%0 isohaline intersected the bottom. Cross-hatched area indicates observed spatial range in which 32.2%0 isohaline intersected the surface in 1980. Inset shows generalized position of the 32.2%0 isohaline at two different times in 1980. the life histories and growth of the zooplankton in the southeastern Bering Sea (Vidal and Smith, 1984). Our study, which began well in advance of the spring bloom of phytoplankton in 1980 and continued through the bloom, allows us to examine the relationship between the bloom and the abundance and development of the communities of zooplankton in the southeastern Bering Sea. The influence of salinity, temperature, and chlorophyll a, as a function of time on the distribution of zooplankton and the development of the communities of the middle shelf and outer shelf (including the slope), is the subject of this paper. 2. Methods Data used in this study were collected during the 1980 field season of PROBES (Processes and Resources of the Bering Sea Shelf), from March 24 through June 6.
224
Journal of Marine Research
[42, 1
The standard PROBES' transect consisted of 19 stations spaced 22 km apart, extending from the slope (-1500 m) to the inner shelf (-50 m isobath). Stratified samples of zooplankton were collected at five standard stations (Fig. 1) using a multiple opening-closing net system (MOCNESS; Wiebe et al., 1976) fitted with 149 ILm mesh nets. The sampling intervals were 1200-600, 600-300, 300-120, 120-80, 80-60, 60-40, 40-20, 20-10, and 10-0 m. Collections were split at sea with 50% preserved in 5% neutral formalin, and returned to the laboratory for analysis of species composition and age-structure. Remaining fractions were washed onto filters for dry weight (20%) or given to collaborating investigators (20% and 10%). All copepodid stages of the major herbivorous copepods that were captured quantitatively were counted (Neocalanus plumchrus. Neocalanus cristatus, Pseudocalanus spp., and Calanus marshallae); for other copepod species (Eucalanus bungii. Metridia pacifica. Acartia spp.), copepodid, adult males, and adult females were counted. Additional details as well as the results of the quantitative analyses of the samples have been reported elsewhere (Smith et al., 1982; Vidal and Smith, 1984). Approximately once each three weeks we occupied a 24-hour station at each of the five main locations of sampling. Full sets of stratified samples were collected five times in a 24-hour period, and each set was preceded and followed by a C.T.D. cast. The local times of the collections were 0300, 0900, 1500, 1900, and 2300 h. Because sampling extended to within a few meters of the bottom, we use these sets of samples as replicates in estimating the mean abundance in the water column of various taxa of zooplankton. Statistical comparisons among abundances were made with log-transformed data, while mean abundances given are arithmetic (Cassie, 1968). Many analyses compare the means for the upper 20 m with the water column. The upper 20 m was chosen because it was an interval sampled regularly for zooplankton, and a stratum in which many taxa reached their maximum abundance, and because after stratification it was approximately equivalent to the mixed layer at most stations. Profiles of salinity and temperature were obtained at all stations using a Neil Brown Mark III C.T.D. surrounded by a small rosette sampler, and the data were processed according to Coachman and Charnell (1979) and reported by Niebauer et al. (1982a). Chlorophyll a was measured by extracted fluorescence (Strickland and Parsons, 1972) on samples collected by the small rosette during the upcast of the C.T.D.; samples were filtered through Gelman G F / AEI glass fiber filters and processed immediately. The results have been reported elsewhere (Niebauer et al., 1982b). Samples for analyses of nutrients were collected by the rosette also and taken from the same bottles as for chlorophyIl a. Methods (Whitledge et al., 1981) and results (Niebauer et al.. 1982a) have been reported.
3. Results a. Salinity. temperature and chlorophyll a. Eight sections of the main PROBES line were completed
as synopticaIly
as possible and included
the five stations at which
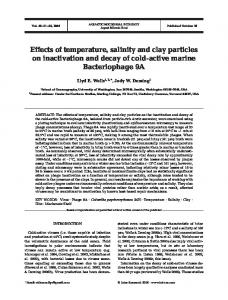
Figure 2. Mean salinity (± 1 standard deviation) at the surface and 75 m of the five stations in the Bering Sea which were sampled for zooplankton in 1980.
zooplankton were routinely collected (Fig. I). Surface water at stations 8, 12, and 16 was relatively fresh, with no significant (P .:5 0.05) differences in mean surface salinity among these three stations during the period of March 24-June 6 (Fig. 2). A seasonal change in surface salinity was observed offshore of station 8. In late March the 32.2 isohaline intersected the surface near station 7, while in late May it was located near station 4 or approximately 66 km seaward of its late March position (Fig. I). The spatial range in which th~ 32.2 isohaline intersected the bottom was more restricted than the range observed at the surface (Fig. I), and its position did not appear to move seasonally. The 32.2 isohaline intersected the bottom in the vicinity of station 10 (± 10 km) in all sections. The difference in mean salinity between surface (31.998%0) and bottom (32.0180/00) at station 12 was small (Fig. 2), while differences in mean salinity between the surface and 75 m at stations I, 5, and 8 were larger. The greatest difference between salinities at the surface and at 75 m was observed at station 8 where mean surface salinity was 31.998%0 and mean salinity at 75 m was 32.493°/00 (Fig. 2). Of the five stations sampled for zooplankton, the greatest vertical contrast in the flux of salt onshore at the bottom and freshwater offshore at the surface was observed at station 8.
[42, I
Journal of Marine Research
226
5 4
3 2
•• 0
~ W
D:: :;)
..... '""
0 a:
i"""c41l5--
...'"
0
'" ~ :::> ~ :::>
100
:>
Pseudocalanus
spp.
.J
80
u
60
40
20
0
STATION
12
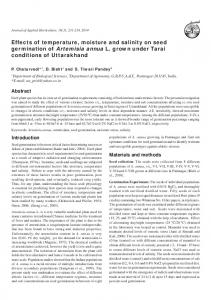
Figure 10. Age-structure of populations of Acartia spp., Calanus marsha/lae, and Pseudocalanus spp. at station 12 in 1980. The timing of the spring bloom of phytoplankton is shown for reference.
Smith & Vidal: Plankton of the Bering Sea
1984]
239
500 o Metridia
pacifica
• Pseudocalanus
400
a::
spp.
x Eucalanus
bung.!.!
'" Neocalanus
plumchrus
* Neocolonus
cristotus
300
w
co
~
::)
z Z -
of station 5 in 1980.
80
u
z W
::l
[;3
60
'"
u. w
> 40
~ ...J
::l
~ 20 u
o STATION
I
STATION
5
STATION
8
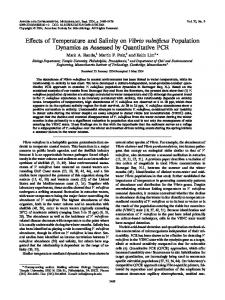
Figure 12. Age-structure of Neocalanus plumchrus in the upper 120 m over the outer shelf (stations 5 and 8) and slope (station 1) in 1980. Note faster development at station 8.
Journal of Marine Research
240
[42, 1
100
~
~ 80 u
z
.... => ~
60
ll: LL
.... ~
40
J:)M----('I"') _
------------.---------.----------------------------
~~~~=~~~~~~~~~$==~=~ MMMMMMMMMMM('I"')MMMMMMMM('I"')MMM('I"')
co
~c
'"c
.S
'" ••• C. Vi
N-
('1"')-
N
>.C M
•......••.....••......••......••......••......••......••......••......••......••......••......••......••......••......••......••......••......••......••......••......••......••......••......••......•
00
o
Cl:lCl:lCl:lCl:lCl:lCl:lCl:lCl:lCl:lCl:lCl:lCl:lCl:lCl:lCl:lOOOCl:lCl:lOOCl:lCl:lCl:l II II 1\ II II II 1\ 1\ 1\ 1\ II II II 1\ II 1\ 1\ II 1\ 1\ 1\ 1\ 1\ 1\ II
>.
..c
0.
'-o
E
- - ----C;NO'N
8
~
00
_
c ";:
'"
M
OOCl:lCl:l
0.
'"
1\ 1\ •
Q)
II
------------.--. --------------------------Q;Q:'v)v)==Mr::'MC;c;;;;C;~ ~ ~ NNNt"-INNNNNNNNNN
Cl:lCl:lCl:lCl:lOOOOCl:lOOCl:lCl:lO 1\ 1\ 1\ 1\ 1\ 1\ 1\ 1\ 1\ 1\ 1\ n
•..•.. Q)
1\ 1\
u
E
==O~~~r::'=~~O\NV)N Ol"'t'lt-\O\O-.::t-.::t V) ~ ~
-5 .9
..
•......••......•
---~~~~
C,) Q)
0.
•..'"
•....•.......•.......•.......•
Q)
M
N
lr'l
~, N
-5 .~
f"t')
N
•.......••......••......••......••......••......••......••......••......••......•
OOOOCl:lCl:lCl:lCl:lOCl:lCl:lOOCl:l
--------------. -------------N::;'o;'N::;'~OONN::;'Nl5:'l5:'oo
v
lr)lr'lV)lr)V)V)tr!V)V)V)V)V)V)r--..
OON
NM
•......••......••......••.......••......••......••......••......••......••......••......••.......••......•
'-'
>.
v•.. •..'" >. •..
t""'I
.::::..
E o
Q)
N
•.. 0. Q.
•......••.......•....•.........•
•......••......••......••......••......••......••......••......••......••......••......••.......••......••......•
0000
OOOOCl:lCl:lCl:lCl:lCl:lCl:lCl:lOOCl:l
::3 M
U
U
-5
+
c
•...•"