MJ Robertson1, O'Connor MH1, Dawes W2, George RJ3, Lewis FM4, Oliver YM1 ... This study was conducted in the Wallatin and O'Brien catchments in the ... catchments are generally thought to be thin (10-20 m) acting at localâscale with ...
Temporal and spatial patterns of salinity as they relate to farm management in the Central Wheatbelt of Western Australia MJ Robertson1, O’Connor MH1, Dawes W 2, George RJ3, Lewis FM4, Oliver YM1 1
CSIRO Sustainable Ecosystems, Floreat WA, 2CSIRO Land and Water, Floreat WA, 3 Department of Agriculture and Food WA, Bunbury WA, 4Lewis Consulting
Introduction Various estimates have been made of the future likely extent of salinity at regional and national scales in Australia, however there has been little analysis of the implications of temporal and spatial patterns of salinity for farm management. Temporal patterns of salineaffected land inform estimates of the rates of expansion and the urgency of the problem. Spatial patterns describe where in the landscape new salinity is occurring and it’s associations with landscape attributes and past and current land use. Both spatial and temporal patterns will dictate the choice of the most appropriate salinity management response. Small and isolated patches, while potentially easy to treat and containable within farm boundaries, may not be compatible with farm layout and operations, particularly in cropdominant farming systems. On the other hand, spread of salinity adjacent to large outbreaks in the valley floor may require substantial responses such as deep drainage. This study was conducted in the Wallatin and O’Brien catchments in the low-medium rainfall zone of the Central wheatbelt of Western Australia. The catchments have a comprehensive set of soil-landscape mapping, history of vegetation clearing, groundwater trends, and recent farmer records of new salinity that supplement scientific estimates, that pre-disposed them to address the following aims of this study: (1) What have been the spatial and temporal trends in saline-affected land over the last 18 years and how does this relate to “at risk” estimates, soil-landscape patterns, and underlying geohydrology?, (2) What is the among-farm variation in such trends and what are the implications for the range of salinity management responses required within a catchment?, and (3) What is the relationship between groundwater rise and time since clearing and landscape position? Method The Wallatin, O’Brien Creek and Woolundra Lakes catchments (64,000 ha) are located in the Shire of Kellerberrin 240km east of Perth. The location represents the transition from the central to the eastern wheatbelt of Western Australia in the broad landscape described as the Zone of Ancient Drainage. The long-term (1900-2005) average rainfall is 330 mm/year and annual evaporation is approximately 2100 mm/year. Mean monthly evaporation exceeds rainfall in all months of the year except in June and July. The dryland farming systems are based on grain production. Over 70% of natural vegetation was cleared for agriculture by the 1940’s and now about 11% remains in scattered and generally small patches. Significant revegetation has occurred in the catchment in the last 15 years, however the number and area of the rate of tree plantings has reduced during the last 5 years. Aquifers in the catchments are generally thought to be thin (10-20 m) acting at local–scale with effective circulation systems of less than 2 km in length, and all recharge within a sub–catchment becoming discharge within the same sub–catchment. Salinity is generally expressed where there is a reduction in flow capacity, as a result of shallow bedrock, convergent valleys, changes in surface slope, or the presence of dykes (George et al 1997). Farm land affected by salinity ranges from 1 to 30% of, with two-thirds of farms having less than 5% salineaffected land. In WA, LandMonitor provides land managers and administrators with baseline salinity data for monitoring changes over time and estimates of areas at risk from secondary or future salinisation. The LandMonitor dataset for area of consistently low productivity (AOCLP) in the catchments was available for 1989 and 1998 (Cacceta and Beetson 2000). The regional
errors of omission and commission are 3-13%. LandMonitor estimates of saline-affected land were updated using farmer estimates in 2006-7 drawn on to a 2004 aerial photo. The area of each saline outbreak was calculated, and the location classified as being in the valley floor or not. An estimate of saline-affected land, independent of LandMonitor, was conducted via a catchment-wide soil survey (1:50 000 scale) in 2003. Soil sampling and analysis of soil for electrical conductivity at 197 points was extrapolated to an areal estimate, by assigning salinity risk or an average value to an entire soil landscape unit. Estimates were made of the likely size of groundwater compartments underlying saline outbreaks on each farm in the catchments. Outbreaks were assessed in the field by a hydrologist, supported by air photos, LandMonitor, groundwater records, and maps of the main soil types, airborne radiometrics and magnetic intensity. Minimum rates of groundwater rise were calculated for the period between installation in the late 1980s, when a large number of observations were made, and 2005 when piezometer readings were resumed. These rates of rise were correlated with (a) the year of clearing at the location of the piezometers, inferred from land alienation records and farmer interviews (bores adjacent to uncleared land had their values halved to imply a level of protection afforded by such vegetation), and (b) landscape position, where a value of 1 represented a position on the upper slope scaling down to 5 for positions on the lower slope. Results The existing salinity identified by LandMonitor in 1998 for the combined area of Wallatin and O’Brien Creek catchments is 1045 ha (2.6% of the catchments area) (Table 1).The Woolundra Lakes area has an estimated 2210 ha currently affected by salinity, and was in part salt-affected prior to clearing for agriculture. Net increase in salinity between 1989 and 1998 over the three catchments has been close to zero and within the error of estimation from Land Monitor. The estimates of surface soil salinity derived from soil survey conducted in 2003 were close to those estimated from LandMonitor (Table 1), implying that soil type and it’s position in the landscape as defined by a soil survey gives close estimates of actual salinity. Table 1: Estimate of saline affect land for the Wallatin, O’Brien and Woolundra Lakes catchments. Subcatchment
Catchment Area (ha)
Valley Floor Area (ha)
Saltaffected Area 1 1989 (ha)
Salt affected Area 1 1998 (ha)
Wallatin Creek O’Brien Creek Woolundra Lakes
24,681
6,237 (25%) 3407 (30%) 10,587 (38%)
421 (1.7%) 503 (4.4%) 2361 (8.6%)
550 (2.2%) 495 (4.3%) 2,210 (8%)
Total catchment
63,748
20,231 (32%)
3285 (5.2%)
3,255 (5.2%)
1
11,478 27,589
Change in salt affected Area 891 98 (ha) 129
-151
Farmer estimates of salinity increase (1998–06) (ha) 537 (2.1%) 119 (1.0%) 34
-30
690
-8
Surface soil 2 Salinity Area (ha)
550 (2.2%) 736 (6.4%) 3 NA
2
As assessed by LandMonitor area of consistently low productivity, As assessed by catchment-wide 3 soil survey in 2003, Not available
Land Monitor also maps out the valley floor. It classifies the area below the ‘2m height above valley floor (26% of the catchment area) and describes this as the area of “valley hazard”. This area is low lying land with potential for high water tables and salinity. The actual area of
risk can only be defined following local assessment and hydrologic measurement. Wallatin and O’Brien, 89% of the saline area identified in 1998 occurred within this area.
At
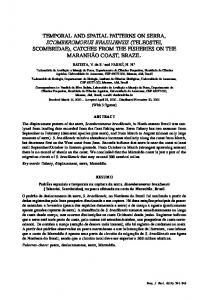
Overall, farmers verified the accuracy of the 1998 LandMonitor estimates. However in addition, they estimated that between 1998 and 2006 the area of saline-affected land doubled in Wallatin, and increased by about 20% in O’Brien, while remaining stable in Woolundra. In 1998 there were 131 identifiable patches of saline-affected land on the hill slopes of the Wallatin-O’Brien (mean = 0.8 ha, median = 0.3 ha). In the valley floor there were 274 patches (mean = 3.2 ha, median of 0.4 ha, indicating that a few large patches were dominating the mean patch size). Since 1998 there have been 52 new outbreaks of salineaffected land in the valley floor of Wallatin-O’Brien. The mean size was 10.7 ha, but the median was 3.6 ha indicating that a few large patches were dominating new outbreaks. Outside the valley floor, there were 37 new outbreaks, which were smaller and more uniform in area (mean=2.8 ha, median=2.3 ha). Analysis of salinity hotspots on 22 farms in the catchment involved identifying 85 groundwater flow compartments. The frequency distribution of these compartments shows that 75% are smaller than 150 ha, 50% less than 80 ha and none greater than 500 ha (Fig. 1). In addition we found few cases where the groundwater compartment on a farm, associated with a saline outbreak, straddled property boundaries. Figure 1: Frequency of area of groundwater compartments associated with saline outbreaks in the Wallatin and O’Brien catchments. Number of groundwater compartments
12 10 8 6 4
Of the 62 groundwater bores examined (i) 16 had declining trends from -0.005 to -0.147 m/year, (ii) 17 were stable with trends from -0.007 to +0.004 m/year, and (iii) 29 were rising at rates from +0.007 to +0.397 m/year.
2
The graph of years since clearing versus minimum rate of change 0 0 40 80 120 160 200 240 280 320 360 400 440 480 520 560 of groundwater level shows an Groundwater compartment area (ha) expected negative trend (Fig. 2); the longer time since clearing the lower the average rate of rise as groundwater levels come to equilibrium. It is notable that for land cleared more recently than 40-60 years, all piezometers are rising, whereas for land cleared earlier than this all piezometers were stable or falling. The graph showing landscape position versus minimum rate of change (Fig. 2) is much less reliable, less subject to direct quantitative interpretation, and it is heavily influenced by the wide variation of the majority of bores in lower landscape positions. Discussion The increase in saline land since 1998, both in the valley floor and on adjacent slopes, indicates that salinity is an ongoing land degradation problem even in a catchment that had been largely cleared for agriculture by the 1940’s and where groundwater levels in the valley floor have stabilised. New saline outbreaks are continuing to occur in the valley floor and the adjacent slopes, and are larger in the valley floor. The mapping of the size and location of salinity outbreaks and the inferred groundwater compartments systems revealed the highly localised nature of the geo-hydrology of the region. Saline outbreaks that are a current focus of concern for farmers, often are
0.5
0.5 y = -0.0033x + 0.2512 R2 = 0.4475
y = 0.0216x - 0.0403 R2 = 0.0662
0.4 Minimum Rate of Rise (m/yr)
Minimum Rate of Rise (m/yr)
0.4 0.3 0.2 0.1 0.0 -0.1
0.3 0.2 0.1 0.0 -0.1
-0.2
-0.2 0
20
40
60
Years since Clearing
80
100
0
1
2
3
4
5
6
Landscape Position (1=High -> 5=Low)
Figure 2: Scatter plot of annual rate of groundwater rise against (a) years since clearing of the native vegetation for agriculture, and (b) landscape position. disconnected from existing saline outbreaks, and have underlying groundwater compartments that are also small, mostly less than 150 ha. The localised nature of groundwater compartments and salinity outbreaks has a number of implications for managing salinity. The presence of a few small areas requiring treatment means that options can be deployed at manageable scales and do not require large capital outlay or disruptive changes to farm layout. Benefits will accrue largely within the farm boundaries of where they are treated and hence will not be diluted by benefits accruing to neighbours. This acts as an incentive for farmers to invest their own funds combating problems on their own farms (Pannell et al. 2001). A further implication is that there will be limits to which coordinated action by groups of farmers will have an aggregate impact at the catchment scale that is greater than the sum of its parts. Farmers clearly see salinity as a small-scale problem able to be managed within the boundaries of their farms. On the other hand, small treatment areas may be difficult to deal within the constraints of farm operations, layout and management. For instance, small areas of lucerne will be difficult to manage with large cropping paddocks and small mobs of sheep. Engineering options such as deep open drains or slotted pipes may not be effective along their full length if the characteristics of groundwater flow systems change over short distances. Options that deal with discrete seeps on slopes, like siphons, maybe a better choice. Acknowledgements This work was funded by the Grains Research and Development Corporation and the CSIRO Water for Healthy Country Flagship. References Caccetta PA, Beetson B (2000) Mapping and Monitoring Salinity: the Kellerberrin Landsat TM scene (111-082). A report from the NHT-funded Land Monitor Project. CSIRO Mathematical and Information Sciences. Report Number: CMIS 2000/202. Dawes W, Robertson MJ, George R, Lewis F, Hodgson G, O’Connor MH, Wilkes P, Oliver Y (2007) Salinity Risk Assessment: Methods and Case Studies from the Wallatin and O’Brien catchments in the Central Wheatbelt of Western Australia. Unpublished report. George RJ, Nulsen RA, Ferdowsian R, Raper GP (1997) Interactions between trees and groundwaters in recharge and discharge areas – A survey of Western Australian sites. Agricultural Water Management 39: 91-113 Pannell DJ, MacFarlane DJ, Ferdowsian R (2001). Rethinking the externality issue for dryland salinity in Western Australia. Australian Journal of Agricultural and Resource Economics 45, 459-475.