Author's Personal Copy Environ Monit Assess DOI 10.1007/s10661-014-3648-2
Spatial variability and temporal changes in the trace metal content of soils: implications for mine restoration plan Rachna Chandra & B. Anjan Kumar Prusty & P. A. Azeez
Received: 2 August 2013 / Accepted: 20 January 2014 # Springer International Publishing Switzerland 2014
Abstract Trace metals in soils may be inherited from the parent materials or added to the system due to anthropogenic activities. In proposed mining areas, trace metals become an integral part of the soil system. Usually, researchers undertake experiments on plant species selection (for the restoration plan) only after the termination of mining activities, i.e. without any pre-mining information about the soil-plant interactions. Though not shown in studies, it is clear that several recovery plans remain unsuccessful while carrying out restoration experiments. Therefore, we hypothesize that to restore the area effectively, it is imperative to consider the premining scenario of metal levels in parent material as well as the vegetation ecology of the region. With these specifics, we examined the concentrations of trace metals in parent soils at three proposed bauxite locations in the Eastern Ghats, India, and compared them at a spatio-temporal scale. Vegetation quantification and R. Chandra : B. A. K. Prusty : P. A. Azeez Environmental Impact Assessment Division, Sálim Ali Centre for Ornithology and Natural History (SACON), Anaikatti (PO), Coimbatore 641108, India B. A. K. Prusty e-mail:
[email protected] P. A. Azeez e-mail:
[email protected] Present Address: R. Chandra (*) Department of Environmental Sciences, Tamil Nadu Agricultural University (TNAU), Coimbatore 641003, India e-mail:
[email protected]
other basic soil parameters accounted for establishing the connection between soil and plants. The study recorded significant spatial heterogeneity in trace metal concentrations and the role of vegetation on metal availability. Oxidation reduction potential (ORP), pH and cation exchange capacity (CEC) directly influenced metal content, and Cu and Ni were lithogenic in origin. It implies that for effective restoration plant species varies for each geological location. Keywords Mines . Nitrogen-fixing species . Soil monitoring . Surface soil . Trace metals
Introduction Mining of minerals, inevitably, leads to the disruption of the soil system. Such destructions result in a permanent reduction of soil productivity and may significantly alter the hydrologic system (Chandra et al. 2011). Metals are present in soil in different chemical forms, which influence their reactivity and hence their mobility, bioavailability and subsequent toxicity. Often, because of mining, the mobility of trace metals changes. Movement of trace metals in soil layers is of major environmental concern as their transport in soil eventually leads to deterioration of other components in the environment (Abolude et al. 2009). Trace metal concentrations in soils remain associated with either biological or geochemical cycles and influenced by anthropogenic activities (Prusty 2008; Prusty and Azeez 2007). Issues related to metal contamination and management are
Author's Personal Copy Environ Monit Assess
common due to human activity and its subsequent impact on the environment (Fernandes and Henriques 1991; Kabata-Pendias and Pendias 1992). Other factors influencing trace metal content in soil are mineralogical and geochemical compositions of the parent rock, organic matter content, particle size distribution, soil horizonation, age, drainage, vegetation and aerosol input (Kabata-Pendias 1993; Prusty and Azeez 2007; Prusty et al. 2008). Trace metals in the soil can cause phytotoxicity and exhibit impaired microbial activities in the rhizosphere region. Largely, metal toxicity does not arise in natural soils with their native vegetation. Ultramafic ecosystem, natural mineral deposits, comprises of metal-enriched soils and high concentrations of Ni, Cr and Co (Brooks 1987). Endemic metallophytes inhabiting this ecosystem thrive well in metal-enriched environments. After some time, the native plants often become adapted to these elevated levels (Brooks et al. 1992; Ouzounidou 1994). Nevertheless, in case of new growth regimes, e.g. agriculture, plants may not be suitable for such soils. Thus, this would lead to either toxicity or absence of colonization of the species (Fergus 1954). The mining industry has several environmental implications and repercussions. Various mining processes release trace metals in unnaturally high amounts (Helmisaari et al. 1995). Thus, stern environmental legislations make reclamation and reforestation of mined areas quintessential for metal cleanup. The damage to the soil and vegetation due to mining, unless carefully prevented, is tremendous, as the original ecosystems by the mining process remain grossly disturbed or buried. Thus, fundamental restoration becomes essential. Literature review reveals that the majority of studies on the soil referring to the metals were undertaken in highly contaminated and industrial areas. There are very few studies on metal distribution in naturally occurring forest ecosystems. Soil properties play an important role in nutrient and trace metal dynamics in the system. Knowledge about plants that help in ameliorating contaminated soils (Chandra 2012) is essential. Thus, we assume that information on soil properties, related metal concentrations and vegetation pattern are obligatory to understand their distribution on a spatio-temporal scale. This will help in strengthening the recovery plan with naturally occurring plant species. Studies on the temporal variation are also important in view of the annual vegetation cycles and their role in the soil nutrient cycling (Prusty et al. 2008). With these specifics, the present study
examined the soil characteristics and assessed levels of select trace metals (Cu, Ni and Zn) on a spatio-temporal scale in proposed bauxite mining locations. The study also focused on the basic soil properties, which tend to affect metal concentrations, and involved changes in vegetation patterns as select plant species may influence soil pH, which in turn affects the metal concentrations. In the present study, we assessed and discussed metal variability in the investigated areas in relation to pH, ORP, organic matter, TAP (total available phophorous), K and vegetation ecology.
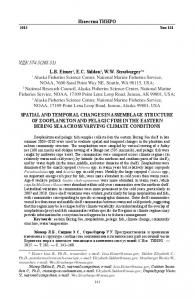
Materials and methods Study area We undertook the study in Araku, Eastern Ghats, India, and selected three bauxite locations (Raktakonda, Galikonda and Chittamgondi, Fig. 1) for examining metal variability in the natural soil system. Lateritic bauxite capping over khondalite covered the hilltops of these three locations. The soil type predominantly was lateritic in the plains and lateritic and rocky in the hilltops. Red ferruginous loam mixed with quartzite was on the higher slopes and sandy loam to clayey on the lower slopes and villages. The forest type, particularly along the slopes of the hillocks and valleys, was secondary in origin (SubbaRao and Kumari 2002). The indigenous tribal community followed the ‘slash and burn’ practice. The plant species common for bauxite-rich deposits were present in the area. The temperature variation was from 10 to 37.8 °C. The annual rainfall varied from 800 to 1,000 mm in the plains and 1,000 to 2,000 mm in the hills. Geological Survey of India (GSI) and Mineral Exploration Corporation Ltd. (MECL) reported 10.8 million tonnes of mineable bauxite reserve in Raktakonda (GEL 2005a). A blanket of laterite bauxite in varying thickness occurred on Galikonda hilltop. Reddish- or brownish-coloured bauxite was present as moderately hard lenses and weathered patches. Occasionally, khondalites were present in the capping. Bauxite was residual in origin and of quaternary age. Galikonda had 13.60 million tonnes of mineable bauxite reserve (GEL 2005b). Outcrops of bauxite capping over khondalite covered the Chittamgondi hilltop. Chittamgondi had 24.57 million tonnes of mineable bauxite reserve (GEL 2005c). Gibbsite was the main aluminous mineral, haematite and goethite were iron ore minerals, and
Author's Personal Copy Environ Monit Assess Fig. 1 Study area map
kaolinite was the clay mineral, in all the three locations. In Raktakonda and Galikonda, alumina varied from 40 to 56 %, iron oxides varied from 7 to 28 %, silica was less than 4 %, titanium was 3 %, and alumina/silica module was less than 16. In Chittamgondi, alumina was between 40 and 58 %, iron oxides varied between 5 and 34 %, and silica was less than 4 %. Soil particle size was in the order sand>silt>clay. Mostly, the rocks of khondalite and charnockite groups of the Archean age, forming a part of the peninsular shield, represented the region (ICFRE 2007). Soil sampling, processing and analyses We undertook the study for two consecutive years and followed random soil sampling protocol for all the three locations, seasonally (February, May, August and November). For spatial variations, we selected three sites from each location, i.e. three sites each from Raktakonda, Galikonda and Chittamgondi. We collected samples in triplicate at each sampling site
(Raktakonda: R1, R2 and R3 sites; Galikonda G1, G2 and G3 sites; Chittamgondi: C1, C2 and C3 sites), from four successive layers, i.e. 0–5 cm, 5–10 cm, 10–15 cm and 15–20 cm in depth using a plastic scoop. In total, we collected 864 soil samples (3 locations×3 sites×3 replicates×4 layers×4 seasons×2 years) during the entire survey. The field sampling involved (1) packing of soil samples in pre-cleaned airtight plastic bags, (2) labelling with appropriate coded number and (3) subsequent transfer to the laboratory for further processing. In laboratory, the samples were (1) air-dried at normal room temperature (Jackson 1958), (2) homogenized using an agate mortar and pestle, (3) sieved through a standard sieve of 2-mm mesh (Tandon 2005) and (4) stored in pre-cleaned plastic containers for further analysis. We processed one portion of the stored samples following standard protocols for soil characterization that included pH, ORP (oxidation reduction potential, millivolts), TOC (total organic carbon, percentage), CEC (cation exchange capacity, milliequivalents/kilogram), TAP (total available phosphorous, milligrams/kilogram)
Author's Personal Copy Environ Monit Assess
and K (milligrams/kilogram) (Allen 1989; Tandon 2005). The pH and ORP were analyzed in soil-water extracts (1:5 w/v) using digital electrodes. TOC (percentage) was estimated following the modified chromic acid wet digestion method of Walkley and Black (1934), wherein the organic matter was oxidized with a mixture of potassium dichromate and concentrated sulphuric acid, utilizing the heat of dilution of the acid to speed up the process. The unspent potassium dichromate was back titrated against ferrous sulphate solution. We extracted soil samples with ammonium acetate at pH 7.0 for CEC estimation (Darmody and Marlin 2002). TAP (milligrams/kilogram) determination in soil was by ammonium fluoride extracting solution as per Bray and Kurtz (1945). Estimation of TAP (milligrams/kilogram) was done spectrophotometrically using Perkin Elmer Spectrophotometer (model Lambda 35). We determined the concentration of TAP in the samples using linear regressions (with zero intercept). Extraction of K was with 1 M neutral ammonium acetate solution (SubbaRao and SammiReddy 2005). The extraction of K was done by shaking 5-g samples of air-dried soil in 25 ml of extractant for 30 min, followed by filtration and subsequent analyses using a Flame Photometer (Systronics 126). We processed the other fraction for estimation of trace metals. Estimation of Cu, Ni and Zn was after digesting the samples following mixed acid digestion technique (Allen 1989). The acid digest was stored in acid-cleaned metal-free polypropylene bottles. Estimation of Cu, Ni and Zn in the digest was by using Atomic Absorption Spectrometer (AAS) (Perkin Elmer AAnalyst 200). We used calibration curves to calculate the concentration of the metals. A reagent blank helped in zeroing the instrument. Later, we aspirated different standard solutions and soil sample digest into the AAS. We verified the precision of the method and accuracy by running blanks and internal standards simultaneously. The precision and bias were usually 10-cm girth at breast height (GBH), as the species growth was not much. In total, we laid 15 quadrats for trees and 60 quadrats each for shrubs and herbs for vegetation composition study (Table 1). This helped in understanding the vegetation ecology and vegetation composition of the study area. We laid additional quadrats of 10×10 m in each season at each soil sampling site (R1, R2, R3, G1, G2, G3, C1, C2 and C3) to relate soil parameters with plant species in the soil sampling stations. We collected soil subsamples (in triplicates) from quadrats of 10×10 m, and recorded the dominant plant species to assess the impact of dominant plant species on soil metal concentrations. Data analyses The Shannon-Wiener’s index of diversity (H′) for plants was calculated using the software Species Diversity and Richness (version 2.65, Colwell 1994–2004). We conducted univariate test, general linear model ANOVA (GLM-ANOVA), to assess the variations in the metal
Table 1 Dominant plant species observed at sampling locations in Araku Location Raktakonda
Galikonda
Chittamgondi
Plant species Ageratina adenophora, Chromolaena odorata, Cipadessa baccifera, Euphorbia hirta, Indigofera sp., Phoenix acaulis, Richardia scabra, Tridax procumbens Chromolaena odorata, Eulalia wightii, Heteropogon contortus, Phoenix acaulis, Richardia scabra Cipadessa baccifera, Crotalaria sp., Indigofera sp., Lantana camara, Mitracarpus villosus, Murraya koenigii, Phoenix acaulis, Tephrosia sp., Tridax procumbens
Author's Personal Copy Environ Monit Assess
levels among the months, locations, sites and layers. Least significant difference (LSD) test was a post hoc analysis for measuring the significant differences. A test of correlation (two-tailed) was also performed among Cu, Ni, Zn, pH, ORP, TOC, CEC, P and K using the software MegaStat (Orris 2000). Principal component analysis (PCA) was done to better quantify the relationships among the variables under study. The first three principal components (PCs), based on the Eigen values >1, were chosen. All differences reported in the text are significant at the alpha=0.05 level. We used SPSS 11.0 (Norušis 1990) for statistical analyses.
Results Physicochemical characteristics The soil pH ranged from 4.2 to 6.4, which is a characteristic of lateritic soil. The redox potential in soil solution of the studied samples was between +25 and + 209 mV. TOC ranged from 0.66 to 4.19 %. TAP varied between 0.000004 and 0.0007 %, and CEC between 41 and 233 meq/kg. Potassium concentrations ranged from 15 to 746 mg/kg and varied among locations, sites and layers (GLM-ANOVA, P