RISCURI ŞI CATASTROFE, NR. XII, VOL. 13, NR. 2/2013
SPATIAL DISTRIBUTION AND TEMPORAL VARIABILITY OF PRECIPITATION IN NORTHEASTERN ROMANIA A. PITICAR1, D. RISTOIU2 ABSTRACT.– Spatial distribution and temporal variability of precipitation in northeastern Romania. In this article, the spatial distribution and temporal variability of precipitation in northeastern Romania are investigated for a period of 50 years (1961-2010) by using monthly data from 10 meteorological stations. Detrended kriging technique was employed for spatial modeling of precipitation amounts, while Mann-Kendall test and Sen’s slope estimator was used to analyze the temporal evolution of precipitation time series. The results show that there exists a well-defined contrast between the more rainy western mountainous region and the drier eastern one. Southeastern regions of the analyzed area are the most exposed to dry conditions especially during the spring and summer seasons. The analysis of annual time series shows increasing trends of precipitation amounts in the analyzed area. Seasonal analysis indicates increasing precipitation in summer and autumn time series and decreasing in winter and spring. However most of the trends are statistically insignificant. Key words: precipitation amount, homogeneity tests, detrended kriging, MannKendall test and Sen’s slope, northeastern Romania.
1. Introduction Precipitation is one of the most important climatic element that directly affects human society (water availability, human consumption, political and social stability), economic activities (location of dams, water planning, irrigation, demand for industry) and natural vegetation and ecosystems (water stress, fires, erosion) and are one of the most persistent, naturally occurring climate-related hazards (Kangas and Brown, 2007). Because of the complexity of factors involved in the genesis and evolution of pluviogenetic processes, spatial and temporal distribution of precipitation shows 1
Babeş-Bolyai University, Faculty of Environmental Science and Engineering, 400294, Cluj-Napoca, Romania, e-mail:
[email protected] 2 Babeş-Bolyai University, Faculty of Environmental Science and Engineering, 400294, Cluj-Napoca, Romania, e-mail:
[email protected]
35
A. PITICAR, D. RISTOIU
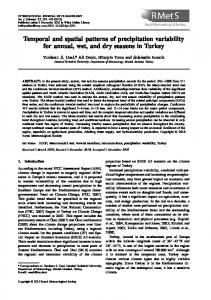
a great variability both in terms of qualitative and quantitative aspects (Tahâş, 2011). Precipitation has a very important influence on all other climatic elements and it continuously modifies the relief and the river systems. It also has a great role in formation and development of natural vegetation, crop, soil and fauna (Tănasă, 2011) and it is the main cause of runoff therefore, understanding their characteristics is very important to agriculture managers, farmers and hydrologists (Dahamsheh and Aksoy, 2007). Studies that investigated the changes in precipitation showed decreasing trend in Central and Southern Europe and increasing trend in Northern Europe (Lupikasza, 2010; Nikolova and Boroneanţ, 2011). For this study, the northeastern Romania was considered (Figure 1). The studied area covers the administrative territory of four counties: Botoşani, Iaşi, Neamţ and Suceava and has an area of 24911 km2. The altitude decreases from west to east from mountainous area of Eastern Carpathians to Eastern part of the Moldavian Tableland. The climate of this region is temperate-continental with a more pronounced continental character in the east and moderate character westward.
Figure 1. The studied area and the location of the weather stations considered
36
SPATIAL DISTRIBUTION AND TEMPORAL VARIABILITY OF PRECIPITATION IN NORTHEASTERN ROMANIA
The importance of precipitation is more considerable in agricultural regions like Moldavian Plane and Suceava Plateau. The aim of this paper is to provide detailed information in the analyzed area about spatial distribution and temporal variability of precipitation.
2. Data and methods 2.1. Data Precipitation analysis is usually based on data from a network of meteorological stations each of which corresponds to a point. A well-distributed network of stations is required to extrapolate point-scale results to the area-scale (Dahamsheh and Aksoy, 2007). Monthly data of precipitation recorded at ten weather stations across northeastern Romania were used for the present study. The stations are uniform distributed: three of them are located in plain area, five in hilly regions and two in mountainous area of Eastern Carpathians. The datasets cover a 50 years period (1961-2010) and they were provided by Romanian National Meteorology Administration (ANM). There were only few data missing and they were filled with the blend series freely downloaded from ECA&D database (Klein Tank et al., 2002). Ceahlău station began recordings in 1964 therefore its data series is only 47 years long. Table 1. Geographical coordinates of the weather stations considered Weather station*
Latitude (N)
Longitude (E)
Height (m)
Botoşani
47°44’
26°39’
161
Ceahlău
46°59’
25°57’
1897
Cotnari
47°22’
26°56’
289
Fălticeni
47°28’
26°18’
348
Iaşi
47°10’
27°38’
102
Piatra-Neamţ
46°55’
26°24’
314
Poiana Stampei
47°20’
25°08’
923
Rădăuţi
47°50’
25°54’
389
Roman
46°58’
26°55’
216
Suceava
47°38’ 26°15’ 350 * Weather stations are ranged in alphabetical order
Digital Elevation Model (DEM) data were provided by geo-spatial project (http://earth.unibuc.ro/download/datele-srtm90-reproiectate-in-stereo70) and is 37
A. PITICAR, D. RISTOIU
based on SRTM model (Shuttle Radar Topography Mission), which represents the best global source of altimetry data. 2.2. Methods 2.2.1. Homogeneity tests As a general rule in testing data for homogeneity the more tests are used, the more accurate are the results. Therefore, the precipitation data have been tested for homogeneity with four tests: Pettitt test – PET (Pettitt, 1979), Standard Normal Homogeneity Test – SNH (Alexandersson, 1986), Buishand Range test – BHR (Buishand, 1982) and Von Neumann Ratio test – VON (Von Neumann, 1941). The first three ones, under the alternative hypothesis, assume that a break in the data series is present and allow identifying the time at which the shift occurs. The VON test assumes, under the alternative hypothesis, the series is not randomly distributed and not allow detecting the time at which the change occurs (it gives no information on the moment of the break). The significance level was set to α = 0.05. 2.2.2. Interpolation Because the long-term average precipitation is usually well correlated with the terrain elevation, the spatial modeling of precipitation quantities for annual and seasonal timescales was made based on detrended kriging method in ArcGIS 9.3 software. This procedure is also called residual kriging because the regression removes the trend attributed to the deterministic effects of climatic and orographic factors, leaving the residual as a near-random variable (Guan and Wilson, 2005). Applying this method to a small area such as northeastern Romania can exclude the effect of changing latitude or longitude (Thomas and Herzfeld, 2004). The only parameter we accounted for was the altitude. First, a precipitation amount-elevation (P-E) regression relationship was computed using observations from the weather stations in the study area. Second, the elevation trend was removed from the observed precipitation values by using the following equation: Pd = Po – (Es * A)
(1)
where Pd is the new precipitation value with the elevation trend removed, Po is the precipitation amount at the weather station, Es is the elevation of the station and A is the slope of the P-E trendline (the lapse rate in mm/m). Thirdly, the residuals (Pd) were interpolated using ordinary kriging. Then, the Digital Elevation Model (DEM) and P-E relationship was used together with the interpolated field of residuals to account for the influence of elevation at every point throughout the area.Similar procedures that include a first step of detrending, a second step of 38
SPATIAL DISTRIBUTION AND TEMPORAL VARIABILITY OF PRECIPITATION IN NORTHEASTERN ROMANIA
kriging and a third one of adding back the elevation effect on the interpolated residuals have been applied successfully in climatological data analysis (Garen and Marks, 2005; Piticar, 2013). 2.2.3. Trend detection To detect and estimate trends in the time series of monthly, seasonal, and annual values of precipitation we used the non-parametric Mann-Kendall test for the trend (Mann 1945; Kendall 1975) and Sen’s non-parametric method for the magnitude of the trend (Gilbert, 1987). The Mann-Kendall test is applicable to the detection of a monotonic trend of a time series. Sen’s method uses a linear model to estimate the slope of the trend, and the variance of the residuals should be constant in time. The procedure offer many advantages: missing values are allowed and data needed are not conferrable to any particular distribution; single data errors or outliers do not significantly affect Sen’s method. In this paper the trends are considered to be statistically significant at α level equal to 0.05. These methods were previously largely used to detect trends in climatic data sets (Croitoru et al., 2013).
3. Results and discussions 3.1. Homogeneity tests The results of the homogeneity tests indicate that the data series of precipitation amounts are homogenous. Only few statistically significant change points have been identified in data from Ceahlău, Rădăuţi, and Suceava stations (Table 2 and Fig. 2a, b, c). Since these stations haven’t been relocated and no changes have been made in the observation program over the analyzed period (1961-2010), we consider that the change points have rather natural causes. Table 2. Results of the homogeneity tests for precipitation in northeastern Romania over the period 1961-2010 Station
PET
SNHT
BHR
Botoşani Ceahlău Cotnari Fălticeni Iaşi Piatra-Neamţ Poiana Stampei Rădăuţi Roman Suceava
1995a 1981* 1968 1967 1981 1968 1981 1981 1968 2004
2004 2009* 1968 1964 1981 2009 2009 2004* 1964 2004*
1995 1981* 1968 2000 1981 2003 2005 2000 1968 2004
39
VON *
A. PITICAR, D. RISTOIU
*Significant at 0.05 level a The year at which the change occurred (break year) Figure 2. The change points detected in precipitation series at Ceahlău, Rădăuţi and Suceava stations over the period 1961-2010.
For the annual time series of Ceahlău station, PET and BHR homogeneity tests identified a significant change point in 1981 (Table 2 and Fig. 2a), when there has been a sudden decrease in precipitation amount. The SNH test indicates a statistically significant change point in 2009 due to heavy rainfall in the next year (1182.5 mm). The VON test also identified a significant change point in the time series of Ceahlău station, but this test does not give information on the moment in which the change occurred. In the time series of Rădăuţi and Suceava stations, SNH test identified a statistically significant change point in 2004 (Table 2 and Fig. 2b, c). This could be due to heavy rains that fell over the summer of next years which generated numerous floods in the area and caused property damage and loss of life. 40
SPATIAL DISTRIBUTION AND TEMPORAL VARIABILITY OF PRECIPITATION IN NORTHEASTERN ROMANIA
3.2. Spatial distribution of the precipitation amounts The mean annual quantity of precipitation in the analyzed area for the period 1961-2010 is 606.1 mm. They slowly decrease from northwestern to southeastern area (Fig. 3) due to altitude decrease on the same direction and a reduction of frequency of moist air masses from the west (Atlantic Ocean) and north (Baltic Sea) which in their movement eastward and southward gradually lose moisture. In addition to this is added a slight effect of föehn. The large open of analyzed area to east and southeast facilitates the movement of continental dry air masses which also contribute to general decrease of precipitation from northwest to southeast. The amount of precipitation has the highest values in summit areas of Carpathians (more than 675 mm), while in the Moldavian Plain and in the South of Suceava Plateau they reach the lowest values (less than 575 mm).
Figure 3. Spatial distribution of annual precipitation in northeastern Romania (1961-2010)
Spatial distribution of seasonal amounts of precipitation allows a more detailed assessment of precipitation regime in the area (Fig. 4a, b, c, d). This emphasizes what has already been noticed in the spatial distribution of annual amount of precipitation, a general decreasing from northwest to southeast with 41
A. PITICAR, D. RISTOIU
certain particularities for each season given by the atmospheric dynamics, relief, presence or absence of evaporation sources and the forest and urban areas.
Figure 4. Spatial distribution of seasonal precipitation in northeastern Romania (1961-2010)
The amount of precipitation changes season by season, depending on the changes that occur in the dynamics of atmospheric circulation, therefore in summer are recorded the highest values (Fig. 4c) ranging from 215 to 315 mm which represents more than 40% of the annual amount, followed by spring and autumn (Fig. 4b, d). In winter, precipitation amounts have the lowest values (Fig. 4a). 42
SPATIAL DISTRIBUTION AND TEMPORAL VARIABILITY OF PRECIPITATION IN NORTHEASTERN ROMANIA
Southern regions of Moldavian Plane and Suceava Plateau are the most exposed to dry conditions especially in spring and summer. 3.3. Changes in the precipitation amounts According to the results of Mann-Kendall test combined with Sen’s slope (Table 3 and Fig. 5a), annual time series indicate an increasing trend of precipitation amounts at 8 weather stations (5.40 – 18.21 mm/decade), but this increase is not statistically significant. Decreasing slopes are specific only at Iaşi and Ceahlău stations, but the trends are significant only at Ceahlău (-27.23 mm/decade). Table 3. Slopes for the precipitation amounts (mm/decade) in northeastern Romania over a Values in bold are statistically significant at α = 0.05 the period 1961-2010 Period J
Piatra- Poiana Rădă- RoSuceBoto- Ceah- Cot- FăltiIaşi Neamţ Stampei uţi man ava şani lău nari ceni a -1.07 -5.05 -0.43 -1.67 -0.50 -0.19 -0.68 -0.94 -0.73 -0.43
F
-0.67
-8.52
-0.71 -0.69 -2.59
0.62
-0.30
0.11
0.14
-0.03
M
-1.18
-2.17
-0.14 0.00 -0.35
1.56
1.42
-1.55
-0.29
-0.25
A
-0.56
-2.91
0.23 0.86 -2.77
0.32
-0.33
-1.10
0.63
0.02
M
-1.18
-4.57
-2.17 -4.82 -3.13 -3.13
-0.54
-2.43
1.18
-3.40
J
-5.31
0.28
3.60 0.76 -4.88 -3.58
-2.73
-0.56
-0.39
-0.85
J
4.58
1.45
0.59 3.42 -1.03
2.85
-3.76
0.52
4.87
6.09
A
1.83
8.14
1.97 2.30
1.07
1.00
2.59
4.00
2.56
4.08
S
5.00
2.16
3.40 2.99
1.67
5.19
5.55
4.43
4.81
3.76
O
5.64
0.33
5.08 4.34
5.43
4.27
1.61
4.00
5.46
5.00
N
-0.36
-4.19
0.46 -1.93 -0.20 -1.38
-1.08
-0.81
0.63
-1.08
D
0.00
-4.86
0.99 0.30
0.43
1.89
-1.63
0.21
1.13
0.56
2.56
-4.45
-1.27
-1.06
-1.26
Winter
-3.43 -20.71
-2.53 -3.08 -5.42
Spring
-3.92 -11.25
-2.33 -4.99 -6.83 -1.37
2.28
-3.59
0.96
-2.00
8.77
11.90
6.00 15.03 -6.47
0.59
-1.65
6.26
10.71
12.30
Autumn 10.68
-1.13
9.56 5.93
6.87
4.51
8.15
10.40
6.42
14.53 11.69 -11.02 11.42
7.26
5.40
14.79
18.21
Summer Annual
12.32 -27.23
7.95
From seasonal point of view, the most important increase in precipitation amount was recorded in summer and autumn, but the trend was statistically significant only in the case of Roman station in autumn (Table 3 and Fig. 5d, e). 43
A. PITICAR, D. RISTOIU
In winter and spring, the decreasing trends are dominant over the analyzed area, but these trends were not statistically significant, excepting Ceahlău station (Table 3 and fig. 5b, c). Monthly trends of precipitation amounts does not show any clear pattern in terms of spatial or temporal distribution except for a significant increase in October and a significant decrease from November to February at the Ceahlău station (Table 3).
Figure 5. Spatial distribution of precipitation amount trends in northeastern Romania (1961-2010); SS – statistically significant at α = 0.05
4. Conclusions The description of spatial distribution of precipitation amount is one of the most important requirements for a wide variety of human activities. Geostatistical techniques were applied to develop updated maps for the prediction of precipitation in annual and seasonal timescales. The mean annual and seasonal amount of precipitation has a normal geographical distribution with the highest values in western and northwestern parts of the analyzed area and the lowest in eastern and southeastern part. The annual mean of precipitation amount has normal values specific to the transitional from temperate to continental climate zone in which the continental influences are felt more pronounced in the east and faded westward, where the interplay of oceanic climate is more obvious. Generally, the amount of precipitation increased in northeastern Romania, however we have to be cautious since most of the trends are not statistically 44
SPATIAL DISTRIBUTION AND TEMPORAL VARIABILITY OF PRECIPITATION IN NORTHEASTERN ROMANIA
significant. Only Ceahlău station recorded significant decreasing trends. Other authors (Micu, 2009; Dragotă and Kucsicsa, 2011) have also identified a significant decrease in precipitation in the mountainous regions of Romania. REFERENCES 1. 2. 3.
4. 5. 6. 7. 8. 9. 10. 11. 12. 13. 14. 15.
Alexandersson, H. (1986), A homogeneity test applied to precipitation data, Journal of Climatology, 6, p. 661-675. Buishand, T.A. (1982), Some methods for testing the homoheneity of rainfall data, Journal of Hydrology, 58, p. 11-27. Croitoru, Adina-Eliza, Piticar, Adrian, Imbroane, Alexandru M., Burada, Doina C. (2013), Spatiotemporal distribution of aridity indices based on temperature and precipitation in the extra-Carpathian regions of Romania, Theoreticalv and Applied Climatology, 112, p. 597-607. Dahamsheh, A., Aksoy, H. (2007), Structural characteristics of annual precipitation data in Jordan, Theoretical and Applied Climatology, 88, p. 201-212. Dragotă, Carmen-Sofia, Kucsicsa, Gheorghe (2011), Global climate change-related particularities in the Rodnei Mountains National Park, Carpathian Journal of Earth and Environmental Sciences, 6, 1, p. 43-50. Garen, David C., Marks, Danny (2005), Spatially distributed energy balance snowmelt modeling in a mountainous river basin: estimation of meteorological imputs and verification of model results, Journal of Hydrology, 315, p. 126-153. Gilbert, R.O. (1987), Statistical methods for environmental pollution monitoring, Van Nostrand Reinhold, New York, p. 320. Guan, Huade, Wilson, John L. (2005), Geostatistical Mapping of Mountain Precipitation Incorporating Autosearched Effects of Terrain and Climate Characteristics, Journal of Hydrometeorology, 6, p. 1018-1031. Lupikasza, Ewa (2010), Spatial and temporal distribution of extreme precipitation in Poland in the period 1951-2006, International Journal of Climatology, 30, p. 9911007. Kangas, Ryan S., Brown, Thimothy J. (2007), Characteristics of US drought and pluvials from a high-resolution spatial dataset, International Journal of Climatology, 27, p. 1303-1325. Kendall, M.G. (1975), Rank correlation method, 4th edn. Charles Griffin, London, p. 202. Klein Tank, A.M.G., Wijngaard, J.B., Konnen, G.P. et al. (2002), Daily dataset of 20th century surface air temperature and precipitation series for the European climate assessment, International Journal of Climatology, 22, p. 1441-1453. Mann, H.B. (1945), Non-parametric tests against trend, Econometrica, 13, p. 245-259. Micu, D. (2009), Snow pack in the Romanian Carpathians under changing climatic conditions, Meteorology and Atmospheric Physics, 105, p. 1-16. Nikolova, Nina, Boroneanţ, Constanţa (2011), Observed changes in precipitation in the Danube river lower basin in the context of climate change, Forum geografic, Vol. 10, Issue 1, p. 117-128.
45
A. PITICAR, D. RISTOIU
16. Pettitt, A.N. (1979), A non-parametric approach to the change-point problem, Applied Statistics, 28, 2, p. 126-135. 17. Piticar, Adrian (2013), Caracteristici ale temperaturii aerului în nord-estul României, Volumul de lucrări al Workshop-ului: Tendinţe şi cerinţe de interdisciplinaritate în cercetare. Prezentarea rezultatelor obţinute de doctoranzi, Edit. Politehnium, Iaşi. 18. Tahâş, Sandu-Valer (2011), Influenţa radiaţiilor solare asupra evoluţiei caracteristicilor climatice în arealul municipiului Cluj-Napoca şi împrejurimi, PhD thesis, Faculty of Environmental Science and Engineering, Babeş-Bolyai University. 19. Tănasă, Ion (2011), Clima Podişului Suceava – fenomene de risc, implicaţii în dezvoltarea durabilă, PhD thesis, Faculty of History and Geography, Ştefan cel Mare University. 20. Thomas, Axel, Herzfeld, Ute C. (2004), REGEOTOP: New climatic data fields for East Asia based on localized relief information and geostatistical methods, International Journal of Climatology, 24, p. 1283-1306. 21. Von Neumann, J. (1941), Distribution of the ratio of the mean square successive difference to the variance, Ann. Math. Stat., 12, p. 367-395.
46