Susan S. Hubbard,1,2 Yoram Rubin,1 and Ernie Majer3. Abstract. The large spatial ..... ing routine [Kelly et al., 1976] using the ProMAX seismic data processing ..... [Fogg, 1989; Johnson and Dreiss, 1989; Phillips and Wilson,. 1989; Anderson ...
WATER RESOURCES RESEARCH, VOL. 35, NO. 6, PAGES 1809 –1825, JUNE, 1999
Spatial correlation structure estimation using geophysical and hydrogeological data Susan S. Hubbard,1,2 Yoram Rubin,1 and Ernie Majer3 Abstract. The large spatial variability of hydraulic properties in natural geologic systems over a wide range of scales, and the difficulty of collecting representative and sufficient hydraulic property measurements using conventional sampling techniques, render estimation of spatial correlation parameters difficult. Further compounding the estimation problem is the observation that the integral scale estimate is a function of the measurement support scale. To mitigate these problems, we investigate the use of tomographic geophysical data in combination with hydrogeological data in the spatial correlation estimation procedure. Two synthetic case studies were investigated where the scale of the geophysical measurements were varied relative to the scale of the hydrogeological properties. The spatial correlation structure parameter estimation procedure was performed in the spectral domain, where analysis of data having different support scales and spatial sampling windows was facilitated. Comparison of the spatial correlation structure parameters estimated from measured data with those of the synthetic aquifers revealed which type of data (tomographic, hydrogeological, or a combination of both) was most effective for recovering spatial correlation statistics under different sampling/heterogeneity conditions. These synthetic case studies suggest that collection of a few tomographic profiles and interpretation of these profiles together with limited well bore data can yield correlation structure information that is otherwise obtainable only from extensive hydrological sampling.
1.
Introduction
Natural geologic systems exhibit large spatial variability of hydrogeologic properties such as hydraulic conductivity over a wide range of scales. Environmental, engineering, and agricultural studies often require information about the spatial correlation structure of these properties. For example, groundwater flow modeling is often performed through an aquifer whose hydrological properties have been created using stochastic simulation techniques; these techniques require as input information about the spatial correlation structure. Hydraulic conductivity measurements are obtained in the laboratory using permeameters or minipermeameters on core samples or in the field using downhole flowmeters, slug tests, and pumping tests. It can be difficult to estimate the spatial correlation structure of these properties using these conventional field sampling techniques because (1) well bore data are commonly scarce, especially in the horizontal direction, and (2) hydrological techniques require drilling, and the installed wells change the nature of the flow processes in the vicinity of the probes, which may yield hydraulic conductivity values which are not representative of unsampled and undisturbed areas. In addition to these problems, experimental and numerical studies have suggested that the hydraulic conductivity integral scales that are 1 Department of Civil and Environmental Engineering, University of California at Berkeley. 2 Now at Earth Science Division, Lawrence Berkeley National Laboratory, Berkeley, California. 3 Earth Science Division, Lawrence Berkeley National Laboratory, Berkeley, California.
Copyright 1999 by the American Geophysical Union. Paper number 1999WR900040. 0043-1397/99/1999WR900040$09.00
estimated from measured data are a function of the scale of the observation relative to the scale of the heterogeneity [Gelhar, 1986; Russo and Jury, 1987]. Different measuring devices sample the subsurface with different support scales [Baveye and Sposito, 1984; Cushman, 1986], which is a function of both the resolution of the measuring device, or the measurement scale, and the spatial separation of the measurements, or the network scale [Beckie, 1996]. To mitigate the problems associated with collecting well bore hydraulic conductivity measurements as well as the potential problem associated with the scale of the measurement support relative to the scale of the heterogeneity, we investigate the use of tomographic geophysical data as a supplement to hydrogeological data in the spatial correlation structure estimation procedure. Several recent studies have investigated the joint use of geophysical and well bore data to aid hydrological studies, including Rubin et al. [1992], Daily et al. [1992], Copty et al. [1993], Ramirez et al. [1993], Hyndman et al. [1994], Copty and Rubin [1995], Hyndman and Gorelick [1996], Teutsch et al. [1997], Hubbard et al. [1997a, b], Poeter et al. [1997], and Eppstein and Dougherty [1998]. These studies suggest that highresolution geophysical data can be useful for estimating hydrological properties as well as for delineating the geometry of the aquifer at locations within the study volume which are traversed by the geophysical profiles. However, as these data typically provide only limited two-dimensional coverage of the three-dimensional subsurface aquifer, stochastic simulation techniques are commonly used to generate hydrological properties at other locations where borehole or geophysical data do not exist. Stochastic simulation techniques require information about the spatial correlation structure of the aquifer. In this paper we investigate the utility of tomographic geophysical data for providing this correlation information. Our synthetic
1809
1810
HUBBARD ET AL.: SPATIAL CORRELATION STRUCTURE ESTIMATION
studies suggest that in addition to supplying direct estimates of log permeability at the tomographic profile locations, the tomographic data may also be useful for providing valuable spatial correlation information that can be used within stochastic simulation routines. We also find that in cases where the geophysical techniques may not be capable of providing hydrological point property estimates at the resolution and accuracy necessary for detailed investigations, the geophysical data are still useful for aiding in the spatial correlation structure estimation. A few investigations have focused on extracting spatial correlation information from geophysical data, including Knight et al. [1996, 1997] and Rea and Knight [1998]. These studies used amplitude values from ground penetrating radar traces to estimate experimental variograms. From these experimental variograms of the measured amplitudes, amplitude spatial correlation structures were estimated. Although no attempt was made to use the geophysical response to infer the hydraulic parameter correlation structure, the working hypothesis of these studies was that the spatial correlation structure obtained from the radar data is likely to be associated with the sedimentary depositional environment under investigation, which may be associated with the hydraulic conductivity spatial correlation structure. These studies assumed that the measurement scale of the surface radar data is appropriate for inferring information about the spatial correlation range of the depositional environment under investigation. McKenna and Poeter [1995] integrated hydrological, geological, and geophysical data to improve classification of hydrofacies and their spatial correlation, but did not attempt to estimate smaller-scale (intrafacies) hydraulic properties or to account for the scale of measurement support relative to the scale of the hydrogeological heterogeneity. The present study extends some of these previous investigations and is characterized by three factors: (1) We do attempt to use the geophysical response to infer the correlation structure of log permeability, (2) we consider the measurement scale of the geophysical data relative to the scale of the hydrogeologic heterogeneity, and (3) we use both geophysical and hydrological data in our estimation procedure. Our spatial correlation estimation procedure is performed in the spectral domain and is presented in section 2, and the procedures for acquiring and processing cross-well radar and seismic data are discussed in section 3. Two numerical case studies, which differ in the type of geophysical method employed, the statistical structure of the hydrological properties, the method of analysis of the core and geophysical data, and the scale of the geophysical measurements relative to the scale of the hydrological heterogeneity, are presented in section 4.
2.
Estimation Procedure
We choose to model the hydraulic properties, such as log conductivity, as stochastic processes which can be characterized by their spatial covariance structures [Rubin et al., 1998]. An example of a two-dimensional log conductivity exponential covariance structure is given by C~r! 5 s 2 exp
F S 2
r 21 r 22 1 I1 I2
DG
and 2 refer to the vertical and horizontal directions, or the directions perpendicular and parallel, respectively, to the direction of greatest continuity. The variance indicates dispersion of the properties around the mean value of the distribution, and the integral scale is a measure of the separation distance at which the measurements become spatially uncorrelated. Anisotropy a of the hydrogeological properties is a function of the geometric organization that commonly exists in geologic strata. In our two-dimensional studies the anisotropy ratio is defined as the ratio of the integral scale in the direction of greatest continuity to the integral scale in the direction perpendicular to that. Our spectral domain procedure involves the estimation of the variance, integral scales, and anisotropy ratio of the hydraulic properties using hydrological and tomographic data along two-dimensional traverses coincident with the tomographic profiles. Analysis of tomographic profiles along different directions, including the directions parallel and perpendicular to geologic strike, permits estimation of the three-dimensional spatial correlation structure of the aquifer. 2.1.
For the numerical case studies to follow we assume that limited well bore information and high-resolution tomographic data are available. The well bore data may include, for example, permeability values obtained from core samples as well as facies designations based on core attributes such as grain size and sorting. We represent log-permeability values as y and represent facies designations as z. In practice, well bore measurements are most prevalent along the vertical direction. To supplement these measurements, we also include tomographic information in the estimation procedure. The direct geophysical information, referred to as g, may include geophysical attributes such as P wave velocity obtained from seismic tomographic data or dielectric constants obtained from radar tomographic data. Geophysical measurements are often colocated with well bore measurements; this overlap permits development of petrophysical relationships which can be used to transform the direct geophysical measurements into estimates of hydrological properties. For our case studies these soft data include estimates of log permeability that are obtained from high-resolution seismic or radar tomographic data. The data considered within the case studies, y, z, or g, can be a vector of measurements collected along a well bore, or a twodimensional grid of values representing the model fields or measured tomographic data. The geophysical and well bore data typically have different support scales. The support scale of the geophysical data is defined here as the “geophysical scale” and is a square pixel with 20-cm sides, and the support scale of the well bore data, referred to as the “core scale,” is a square pixel with 5- or 10-cm sides. To develop petrophysical relationships, it is often necessary to average several of the core measurements so that the core and colocated tomographic data have the same sampling interval; the support scale of these averaged core values is referred to here as “upscaled.” 2.2.
1/ 2
,
(1)
where s2 is the variance of the log conductivity, r 1 and r 2 are the log conductivity measurement separation distances, I 1 and I 2 are the corresponding integral scales, and the subscripts 1
Description of Available Data
Spectral Representation of Data
Spectral domain analysis facilitates integration of direct hydrological and soft data, which have different support scales and spatial sampling windows, by representing the spatial phenomena as being composed of variations that are characterized by different length scales. The integral scale associated with a
HUBBARD ET AL.: SPATIAL CORRELATION STRUCTURE ESTIMATION
one-dimensional, uniformly spaced measurement series can be investigated using the amplitudes obtained from Fourier transformation of the data, a(k i ), where k i denotes the wavenumber in the Cartesian direction i 5 1,2 [Bracewell, 1965; Gardner, 1988]. For situations where evenly spaced data are not available, interpolation can be performed prior to transformation [Press et al., 1992], or an alternative transform presented by Lomb [1976] can be employed. In this study we work with uniformly spaced samples and express the energy spectrum obtained from these amplitudes as a spectral density function, S(k i ): S h~k i! 5 ^a h~k i!a h~k i!*&
(2)
where h 5 y, z, or g, the asterisk denotes the complex conjugate, and angle brackets denote the expected value [Dagan, 1989]. No summation over repeated indices is implied in (2) or in subsequent expressions. Spatial covariance functions, such as that given by (1), can be expressed as a spectral density function using Fourier transformations, as discussed by Dagan [1989] and Gelhar [1993]. If there is more than one measurement series available in the same direction, averaging of the individual spectra can be performed to obtain an average spectral density curve. For example, if several core sections of the same length and sampling interval are collected at isolated intervals along a single borehole, the average log-permeability spectral density function can be obtained by averaging the individual core section spectral density functions. Similarly, space-averaged spectral density functions in the vertical and horizontal directions can be calculated from a two-dimensional cross section, such as from a geophysical tomogram, by calculating the average onedimensional spectral density function along the vertical direction and then repeating the procedure along the horizontal direction. The space-averaged spectral density function can be calculated over d individual data measurement series (such as core sections, rows, or columns) using S# h~k i! 5
1 d
O d
S ~hj!~k i!,
(3)
j51
where the superscript j denotes row, column, or core section over which the averaging is taking place and the overbar denotes space averaging. Spectral density curves are calculated from measured data as a function of wavenumber, or spatial frequency. For all data types the spectral density curve low-wavenumber cutoff value is proportional to the inverse of the sampled domain size, 1/L (in units of 1/distance). For data sampled with a spatial interval of , (in units of samples/distance), the spatial Nyquist frequency (, N 5 ,/ 2) dictates the high-wavenumber cutoff, or the highest frequency that can be detected using that sampling interval. Thus the frequencies associated with the hydrological heterogeneity must be lower than the measured data Nyquist frequency in order to be detected. In terms of angular wavenumber, the low cutoff (k min) is expressed as 2 p /L, and the high angular Nyquist wavenumber cutoff (k N ) is expressed as 2 p , N [Ababou and Gelhar, 1990]. Tomographic data generally have fewer samples per length than direct well bore measurements (,geophysical , ,well bore); the spatial interval of the tomographic data is a function of the discretization chosen for the geophysical inversion, which is a function of acquisition geometry and excitation frequency [Williamson and Worthing-
1811
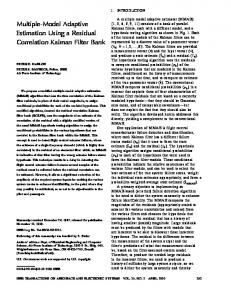
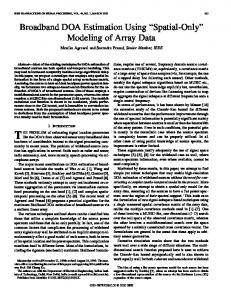
ton, 1993]. In addition to having fewer samples than the well bore measurements, the tomographic data typically sample a greater extent of the spatial domain than the well bore data (L geophysical . L well bore). As a result of these two factors, the geophysical information typically resides in the low-wavenumber portion of the spectrum relative to the position of the spectra obtained from well bore data. Figure 1 shows a spectral density function calculated in the vertical direction over a log-permeability model that extends 10 m in depth and has an exponential log conductivity structure with a variance of 0.3 and a vertical integral scale of 0.2 m. If tomographic seismic or radar data were available to sample the entire length of the aquifer with a sampling interval of 4 samples/m, and if the geophysical information could be transformed into logpermeability information using a petrophysical model, the logpermeability spectral density curve potentially available from the geophysical data would range from a low angular wavenumber cutoff of 2p(1 sample/10 m), or 0.628 samples/m, to a high angular wavenumber cutoff of 2p(4 samples/2 m), or to 12.56 samples/m. In contrast, the low and high angular wavenumber cutoff for a 0.5-m core collected within this aquifer with subsampled log-permeability measurements taken every 5 cm are 12.56 and 62.8 samples/m, respectively. Thus data with different measurement spacing and spatial sampling windows occupy different ranges in the wavenumber domain. Figure 2 illustrates the relationship between the power of the spectral density curve and integral scale for a onedimensional exponential model. When the log conductivity variance is held constant, both the S-axis intercept and the shape of the curves change with varying integral scale. Also, note that for these model parameters, which are reasonable for near-surface unconsolidated sedimentary aquifers, the significant changes in the spectral density curves occur in the lowerwavenumber region, or the region from which information is typically available from high-resolution geophysical data. This suggests that if hydrogeological spatial correlation information can be recovered from these spectral density curves, then geophysical data are a potentially important source of spatial correlation structure information. 2.3. Relationship Between Geophysical and Hydrological Information In the investigations to follow we employ published and site-specific regression petrophysical models to relate logpermeability and geophysical values. Linear regression techniques for relating geophysical and hydrological measurements have been used extensively to aid reservoir studies [e.g., Wyllie et al., 1956; Bourbie et al., 1987; Han et al., 1986; Klimentos and McCann, 1990; Klimentos, 1991; Best et al., 1994]. These techniques assume a linear relationship between some parameterization of the geophysical and hydrological variables. Spectral density curves calculated from log-permeability estimates are used in the spatial correlation estimation procedure which will be described in the next section. However, the regression techniques that are used to obtain the logpermeability estimates from the geophysical attribute images often yield smooth representations of the log-permeability field, and thus high-frequency variations that may be present in the actual fields are commonly not recovered. As a result, the spectral density function calculated from the estimated field may not represent the actual log-permeability spectral density function, and thus the correlation structure that is estimated from the spectral density function may not be representative of
1812
HUBBARD ET AL.: SPATIAL CORRELATION STRUCTURE ESTIMATION
Figure 1. Spectral density function in the vertical direction corresponding to an exponential log conductivity covariance with a variance of 0.3 and a vertical integral scale of 0.2 m. In this example, information about the lower-wavenumber portion of the spectrum is available from tomographic geophysical data, while higherresolution core data provide information in the high-wavenumber portion of the spectrum. Since the wavenumber range sampled by a particular data set is a function of the measurement sampling interval and sampled domain size, it is possible that in other situations the spectral ranges of disparate data types may overlap. the true correlation structure. To compensate for the effect that these filtering procedures may have on the estimated logpermeability spatial correlation structure, the difference between the true and estimated log-permeability values at the well bore location is calculated. This vector of differences («), which represents the estimation error of the regression filter, is then modeled, and error with the same distribution is added back into the geophysically obtained log-permeability values ˜ Y ˆ: to yield an estimate Y ˆ 5˜ Y Y1«
which for this study are the directions perpendicular and parallel to the direction of greatest continuity, or in the vertical and horizontal directions, respectively. The variance in (5) can be estimated from the spectral density curve itself using a discretized version of
(4)
where the tilde indicates that estimates are obtained from geophysical data using a filtering technique. For our study the error («) was considered to be spatially correlated. Addition of this error to the estimated log-permeability field prior to calculation of the spectral density curve helps to ensure that all elements of the model are present during the spatial correlation estimation. 2.4.
Estimation Procedure
We assume in this study that the log-permeability spatial correlation function can be represented using an exponential covariance structure. Fourier transformation of a onedimensional, exponential covariance structure yields the spectral density function S b~k i! 5
s 2I i p ~1 1 k 2i I 2i !
(5)
where b 5 y or z, s 2 is the log-permeability variance, and I i is the integral scale in the directions i 5 1,2 [Gelhar, 1993],
Figure 2. Spectral density functions corresponding to a onedimensional exponential covariance model with a variance of 0.2 and integral scales ranging from 0.2 to 0.6 m.
HUBBARD ET AL.: SPATIAL CORRELATION STRUCTURE ESTIMATION
s 21 5
E
1`
2`
S b~k 1! dk 1 or s 22 5
E
1`
S b~k 2! dk 2
(6)
2`
where the subscripts 1 and 2 indicate calculation along the vertical and horizontal directions, respectively, and the spectrum is an even function so that S b (k i ) 5 S b (2k i ) [Gelhar, 1993]. We assume in our case studies involving two-dimensional data that s2 5 (s ˆ 21 1 s ˆ 22)/2. Ideally, the variance in the vertical direction is equal to the variance in the horizontal direction, and the average variance will not differ from the variances calculated in any individual direction. In the case studies to follow, the averaging resulted in small variations from the true variances calculated in the spatial domain; these variations were negligible and would vanish with increasing domain size. For data that exist only in one dimension, such as a single column of well bore measurements, we assume that s2 5s ˆ 21. The variance can be estimated using (6) and substituted into (5), and the experimental spectral density function, calculated from measured data using (2) or (3), can be equated to the right-hand side of (5). The experimental spectral density curve can then be fit using (5) to estimate I i . This fit can be performed using a number of algorithms; for our case studies we used a Gauss-Newton nonlinear least squares procedure. Equations (5) and (6) form the basis of our estimation procedure. In summary, the procedure consists of the following steps: (1) Obtaining the log-permeability or facies geometry measurements or estimates from hydrological or tomographic data; (2) transferring this information into Fourier space and calculating the one-dimensional experimental spectral density functions. If two-dimensional data are available, the average spectral density function in each direction is calculated; (3) estimating the variance from the resulting spectral density curves; and (4) substituting the estimated variance into the spectral representation of the covariance structure and fitting the experimental spectral density curve to solve for the integral scales and anisotropy. The relationship presented in (5) is valid only if the logpermeability or facies geometry correlation structure can be described using an exponential covariance model. However, if it is suspected that other correlation models are more reasonable for a particular aquifer, the spectral representation of those models can be used in the same manner; the methodology outlined above is independent of the type of model that governs the correlation structure of the system. If the choice of structural model is ambiguous, model discrimination techniques, such as maximum likelihood approaches, can be employed prior to analysis.
3.
Tomographic Radar and Seismic Methods
The geophysical techniques used within the case studies include tomographic radar and seismic methods, both of which are commercially available and becoming more common in practice for detailed environmental site characterization [e.g., Peterson et al., 1985; Majer et al., 1990, 1991; Hubbard et al., 1996, 1997b]. Ground-penetrating radar uses electromagnetic energy at frequencies of 10 –1000 MHz to probe the subsurface. At these frequencies the separation of opposite electric charges within a material that has been subjected to an external electric field dominates over the electrical conductive properties. These capacitive properties are described by the dielectric constant, which is obtainable from radar data. Radar
1813
performance is optimal in moderate- to coarse-textured sediments and can be poor in electrically conductive environments such as those dominated by the presence of clays. At the high frequencies used for cross-hole acquisition, and in geological environments amenable to radar acquisition, the electromagnetic wave velocities (V) obtained from radar data tomographic inversion can be related to the real part of the dielectric constant (k) as
k 5 ~c/V! 2
(7)
where c is the plane wave propagation velocity of electromagnetic waves in free space (3 3 108 m/s). High-resolution seismic methods employ high-frequency pulses of acoustic energy (;100 –10,000 Hz) which are produced at a point and propagate out as a series of wave fronts. The passage of the wave front creates a motion which can be detected by sensitive geophones. From the time of flight of this energy, or from the seismic travel time data, information about the interwell seismic velocity can be obtained. Tomographic methods transmit direct energy, electromagnetic in the case of radar and acoustic in the seismic case, from a transmitter in one borehole to a receiver in another borehole over several transmitting/receiving locations. The energy from the sources to the receivers is envisioned as traveling along ray paths through the interwell area. These data are processed to obtain estimates of acoustic or electromagnetic wave velocity; this procedure is known as tomographic inversion. The inversion discretization is governed by the data acquisition parameters and geometry [Williamson and Worthington, 1993]. A straight ray path algebraic reconstruction technique (ART) inversion algorithm given by Peterson et al. [1985] was used in this study to obtain estimates of seismic P wave velocities from seismic data travel times. This method has also been used for estimating the electromagnetic wave velocities from the radar data travel times [Hubbard et al., 1997b]. In addition to the straight-ray inversion method, several other options exist for inverting tomographic data including curved-ray approaches, which have been suggested when velocity variations of greater than 10 –20% are common [Bregman et al., 1989], and fullwaveform approaches. For more information about alternative tomographic inversion schemes or applications the interested reader is directed to a special issue of Geophysics devoted to cross-well methods and their applications [Rector, 1995].
4.
Numerical Case Studies
We explore the utility of geophysical data to infer the spatial correlation structure by investigating situations where the scale of the geophysical measurement is varied relative to the scale of the hydrologic property. Using the approach outlined in section 2.4, Hubbard [1998] showed that in an ideal case, where the resolution obtainable from tomographic data is high relative to the scale of hydrological heterogeneity, tomographic data alone can be sufficient for recovering the spatial correlation structure of an aquifer. Here two numerical case studies are presented where the geophysical data alone are not sufficient to capture all aspects of the spatial correlation structure. Both case studies involved simulation of tomographic seismic or radar data through a synthetic unconsolidated and fully saturated sand-clay or sand-gravel geologic system. These geologic systems were chosen because they represent many nearsurface environmental, agricultural, and engineering study
1814
HUBBARD ET AL.: SPATIAL CORRELATION STRUCTURE ESTIMATION
Table 1. Discretization Parameters Used to Simulate the Model Log-Permeability Fields of the Numerical Case Studies Discretization Parameters
Node Length i 5 1 and 2, cm
Number of Nodes, i 5 1 and 2
Case Study 1, Y(r) Case Study 2, Z(r), Y 1 (r), Y 2 (r)
10 5
50 100
sites. As the maximum resolutions typically obtained from high-resolution radar and seismic tomographic field data are similar, and we desire to investigate situations where the scale of the geophysical measurement varies relative to the scale of the hydrogeological heterogeneity, each aquifer was simulated using different spatial correlation statistics. The synthetic aquifers were investigated using both tomographic and borehole methods. Comparison of the spatial correlation structure parameters obtained from the measured data with those of the synthetic aquifers reveals which types of data were most effective for recovering the spatial correlation statistics under different heterogeneity/sampling conditions. 4.1.
Case Study 1
This case study was designed to investigate the usefulness of tomographic seismic data as an aid to statistical structure inference in an aquifer that has a single scale of spatial variability. We investigate this aquifer using limited borehole measurements and tomographic data whose resolution is low compared with the scale of the log-permeability variability. The difference in resolution and variability can be attributed to coarse geophysical acquisition parameters relative to the heterogeneity. Additionally, as will be explored in this case study, tomographic methods may not provide sufficient resolution when the log-permeability correlation ranges are small (approximately less than a meter), which is common in unconsolidated sedimentary depositional environments such as the Borden site [Sudicky, 1986] and the Cape Cod site [Hess et al., 1989]. A two-dimensional hydraulic conductivity field was simulated using a sequential Gaussian simulator (SGSIM) [Deutsch and Journel, 1992] with the discretization parameters shown in Table 1 and an exponential covariance function (equation (1)). Plate 1a is a realization of this simulation and is considered the model log-permeability field; the range of the simulated logpermeability values is representative of silty sands [Freeze and Cherry, 1979]. 4.1.1. Tomographic seismic data simulation. Working within a sand-clay system, Marion et al. [1992] used a theoretical microgeometrical approach to relate seismic P wave velocity to pressure and porosity. This relation was verified empirically in the laboratory, and the model was extended by Rubin et al. [1992] to investigate the relationship between log permeability, effective pressure, and seismic P wave velocity (V). The curve of Rubin et al. [1992] for saturated and lowpressure conditions is shown in Figure 3. For our numerical
case studies we assumed that the effective pressure was 0.1 MPa, the system was saturated with water, and the sand content of the system varied from 60% to 90%. These sand content bounds were chosen so that the petrophysical model is simple and traverses only one limb of the curve shown in Figure 3; estimations using more complicated petrophysical models that incorporate both limbs of the curve are given by Rubin et al. [1992]. Regression analysis was performed over the portion of this curve which corresponds to this sand content range to yield the following relationship: log ~k, cm2! 5 3.55 2 0.0078V (m/s)
(8)
with a correlation coefficient of 0.92. This regression model is also displayed in Figure 3. The core-scale permeability field shown in Plate 1a was transferred into a velocity field using the regression equation given in (8). Although we attempted to ensure that construction of the model velocity and log-permeability fields was realistic, development of these fields is not part of the inversion procedure itself. These fields merely serve to represent a subsurface domain which will be subsequently sampled using well bore and tomographic methods, and the reduced data from the well bore and tomographic data will then be used for inferring the spatial correlation structure. The velocity field created using (8) was used as an input velocity model to an acoustic finite difference forward modeling routine [Kelly et al., 1976] using the ProMAX seismic data processing package [Advance Geophysical Corporation, 1993]. Forward tomographic geophysical modeling was performed using a Ricker wavelet with a 4000-Hz central frequency and source and receiver element spacings in the boreholes of 1/8 m; these parameters are representative of those used to acquire high-resolution seismic tomographic data [Majer et al., 1990, 1991]. Seismic data simulation resulted in several shot gathers, each representing a group of energy recorded at several receivers from a single pulse of acoustic energy. The travel time of the seismic energy from the source to the receivers was picked for all ray paths in each shot gather. For this particular simulation this involved picking the first energy arrival time for 1600 ray paths that traverse the interwell area. To account for errors that are typically not spatially correlated, such as errors associated with travel time picking and station locations, random Gaussian error with a standard deviation of 10% of the travel times was added to the travel times to simulate error associated with the seismic data acquisition as well as errors associated with the rock physics relationships, as will be subsequently discussed. The seismic travel times were then inverted for interwell velocities using an algebraic reconstruction technique (ART) [Peterson et al., 1985], as discussed in section 3. A 25 3 25 cell block discretization was used for the inversion, resulting in a seismic velocity measurement sampling interval of 5 samples/m in both the horizontal and vertical directions. This discretization is reasonable given the highresolution acquisition parameters used to simulate the geophysical data. The inversion process resulted in additional error which was spatially correlated. The resulting velocity field is shown in Plate 1b and is considered to be the information
Plate 1. (opposite) (a) Numerical case study 1 model log-permeability field defined at the core support scale in units of log(k, cm2). The location of the borehole from which log-permeability measurements are considered available is shown above the cross section. (b) Velocity field at the geophysical scale considered to be available from tomographic seismic data collected within the saturated permeability field shown in Plate 1a.
HUBBARD ET AL.: SPATIAL CORRELATION STRUCTURE ESTIMATION
1815
1816
HUBBARD ET AL.: SPATIAL CORRELATION STRUCTURE ESTIMATION
Figure 3. Petrophysical curve relating seismic P wave velocity and permeability for a saturated, sand-clay system is shown by the solid, two-limb curve [Marion et al., 1992; Rubin et al., 1992]. The dashed, straight line superimposed on one limb of this curve was used in numerical case study 1 to transfer the model log-permeability field shown in Plate 1a into a model P wave velocity field that was used as input for seismic forward modeling.
available from field seismic tomographic profiling. The blank nodes indicate that the ray path density through those cells was not sufficient to produce velocity estimates; rows with blank values were not used in the spatial correlation structure analysis. 4.1.2. Spatial correlation structure inference. In this case study it is assumed that the petrophysical relationship given in (8) is known from previous laboratory studies or field calibrations. Because the petrophysical model is available and because laboratory core analysis is an expensive procedure, in this case study only limited permeability values were obtained from two 0.5-m core sections. These two core sections, in addition to the tomographic seismic data P wave velocity information, were considered to be the data available for spatial structural inference. We perform this analysis in four parts: first, calculating the parameters associated with the model permeability field; then trying to recover these parameters using only limited information from the core data; then using only information from seismic data; and finally, using combined core and seismic information. The model log-permeability field (Plate 1a) was transformed into the wavenumber domain, and the average spectral density functions were calculated in the vertical and horizontal directions. The model spectral density curve in the vertical direction is shown in Figure 4d. The spectral curves were fit for spatial correlation parameters using (5) together with the variance calculated for the spectral curves (equation (6)) to estimate the vertical integral scale I 1 and the horizontal integral scale I 2 . The resulting model spatial correlation structure parameters estimates are given in Table 2. Two 0.5-m core sections, each with a sampling interval of 10 cm, were extracted from a well bore located along the rightmost column of the original permeability field as annotated above Plate 1a. The average spectral density curve calculated
from these core sections, which exists over a wavenumber range from 12.57 to 31.4 samples/m, is shown in Figure 4a. Note that although it would be possible to obtain some lowerwavenumber spectral values if the spatial separation of the individual core sections were taken into account, only a few values would be recovered. As these values would likely not be enough to ensure a reliable fit in that portion of the wavenumber domain, we do not attempt to recover this information. The tomographic velocity field shown in Plate 1b was transformed into the wavenumber domain, and the average velocity spectral density functions, S# g (k i ), i 5 1, 2, were calculated using (3). These velocity spectra can be used together with the assumed known petrophysical relationship to estimate permeability spectra. For example, suppose a linear relationship is known or developed for the study site that yields an estimate of a hydrological variable ( y) from a geophysical variable ( g) such as y 5 ag 1 b, where a and b are constants. The covariance of the estimated hydrological (C y ) and geophysical (C g ) data are related as C y 5 a 2 C g . Since C y and C g are Fourier transform pairs with S y and S g , respectively, then by using the linearity property of Fourier transforms, we can estimate the spectral density of the hydrological measurements given the spectral density of the geophysical data: ˆ y 5 a 2S ˆ g. S
(9)
Following (9), estimated average log-permeability spectral density functions were obtained using the velocity spectra and the petrophysical relationship (8): S# y~k i! 5 ~20.0078! 2S# g~k i!, i 5 1, 2.
(10)
These estimated spectral density curves cover the wavenumber range from 1.26 to 15.7 samples/m; the curve corresponding to the vertical direction is shown in Figure 4b. These curves were analyzed for spatial correlation information; the results of the estimations are given in Table 2. Combining the spectral density functions obtained from seismic and well bore data yields the spectral density curve shown in Figure 4c. Note that the spectral density curve obtained from seismic data (Figure 4b) occupies the lower-wavenumber portion of the spectrum while the spectral density curve obtained from well bore data (Figure 4a) occupies the highwavenumber portion of the spectrum, and the composite spectrum (Figure 4c) traverses the entire range given by the model permeability field (Figure 4d). This combined spectral density curve was fit with a variance value calculated from the combined spectrum to estimate the vertical integral scale; the results of this fit are shown in Table 2 in the bottom row (Seismic and well bore data). As continuous core coverage in the horizontal direction is not available for this case study, it is impossible to combine well bore and seismic information together to obtain a composite horizontal spectral density function, as was performed for the vertical direction. By assuming that the anisotropy ratio inferred from the seismic data (Table 2) is valid, we can use this value with the vertical integral scale estimate (Iˆ1 ) obtained from a composite well bore–seismic spectra (Figure 4c) to estimate the composite horizontal integral scale: ˆI 2 5 aˆI 1.
(11)
The results of this estimation are given in Table 2. Alternatively, if horizontal core data were available, spectral informa-
HUBBARD ET AL.: SPATIAL CORRELATION STRUCTURE ESTIMATION
1817
Figure 4. Spectral density curves calculated along the vertical direction using (a) core data, (b) seismic data, (c) composite core and seismic data, and (d) model field. Combining the core and seismic data (Figure 4c) yields a spectral response that is most similar to that of the model field (Figure 4d), and thus analysis of this composite information yields the most accurate spatial correlation estimates. tion from the core and tomographic data could be combined prior to analysis, as was performed in the vertical direction. 4.1.3. Discussion. Table 2 shows that analysis of the well bore core data spectral density curve leads to a dramatic unTable 2. Spatial Correlation Parameter Estimates Corresponding to Case Study 1 Data Used to Construct 1/,, Spectral Density Function cm/sample Model permeability Well bore data Seismic data Seismic and well bore data
10 10 20 20, 10
NA, not available. *Estimated using seismic data only.
s ˆ2
I 1, cm
I 2, cm Anisotropy
0.63 13.28 49.1 0.12 5.1 NA 0.40 14.8 54.5 0.52 13.03 47.9
3.697 NA 3.68 3.68*
derestimation of the vertical integral scale and that estimation of the horizontal integral scale and hydraulic anisotropy using the well bore spectral data alone is impossible. Although the sampling interval of the well bore data should be sufficient to recover the actual model vertical integral scale, the small spatial extent of the core sections of 0.5 m is not sufficient to capture information about the variations that occur at large spatial scales. Hubbard [1998] showed that in order to use well data for spatial correlation estimation, the well data need to be ergodic on a univariate level, so that complete coverage of all possible log-permeability values is obtained, and that well data need not be ergodic in terms of bivariate or multivariate statistics; that aspect of the estimation is taken care of by the geophysical survey. In this case study, with the small sampling window available for the core data, it is suspected that ergodicity conditions may not be met and thus the vertical integral
1818
HUBBARD ET AL.: SPATIAL CORRELATION STRUCTURE ESTIMATION
scale estimate obtained from well bore data will likely be dependent on the location of the core section within the study area. The geophysical resolution is not quite sufficient for recovering the frequencies corresponding to the model logpermeability variability. As a result, the estimated integral scales were slightly overestimated when compared with the actual model values (Table 2). By assuming that the lowwavenumber components supplied by the geophysical-scale tomography information are equivalent to the (unrecovered) low-wavenumber components of the core data, we are justified in combining the spectra obtained from the two different data sets prior to spectral analysis. This assumption is valid for an aquifer that has one scale of spatial variability such as the one under consideration here. Supplementing the spectral information obtained from seismic data with higher-resolution spectral data obtained from core sections prior to analysis yielded a composite vertical integral scale that is very similar to the model vertical integral scale. Combination of the anisotropy estimate obtained from the two-dimensional seismic data with the composite vertical integral scale yielded a horizontal integral scale that also compares favorably with the model horizontal integral scale. This case study highlights the usefulness of combining hydrological and geophysical data for correlation structure estimation when neither data set samples the wavenumber range sufficiently and thus when neither data set is individually adequate for providing accurate spatial correlation estimates. 4.2.
Case Study 2
Natural systems contain many scales of geologic controls on the permeability structure. Some of these controls include, in increasing order of scale, pore geometry, depositional flow regime features, stratification, channels, depositional environments, and sedimentary basins [Koltermann and Gorelick, 1996]. To model flow and transport through these systems, hierarchical models are often invoked which attempt to incorporate variability at different spatial scales. Aquifer models are often divided into layers or facies based on their hydraulic measurements, grain size, grain sorting, sedimentary structure, genetic origin, lithologic geometries, trends, or arrangement in space [Koltermann and Gorelick, 1996]. For example, a wellconnected, high– hydraulic conductivity channel sand may be defined as a single facies. Representation of this sand channel as a distinct facies within the aquifer model enables a description of heterogeneity that would be unattainable using simulation techniques based on Gaussian log conductivity distribu-
Plate 2. (opposite) (a) Numerical case study 2 facies geometry field. Facies 1, indicated in red, is representative of a very clean sand, and facies 2, indicated in blue, is representative of gravel. The location of the borehole from which facies designations are considered available is shown above the cross section. (b) Hierarchical log-permeability model. This field was created using the model facies indicator field shown in Plate 2a together with a sequential Gaussian routine to simulate smallscale (intrafacies) heterogeneity. This log-permeability field thus has both large- and small-scale components of variability. The location of the borehole from which log-permeability measurements are considered available is shown above the cross section. (c) Dielectric constant field considered to be available from tomographic radar data collected through the watersaturated log-permeability field shown in Plate 2b.
HUBBARD ET AL.: SPATIAL CORRELATION STRUCTURE ESTIMATION
tions only. Several investigators have used the facies concept to characterize aquifers or to build synthetic aquifer models [Fogg, 1989; Johnson and Dreiss, 1989; Phillips and Wilson, 1989; Anderson, 1989; Rubin and Journel, 1991; Davis et al., 1993]. Hydrogeologic facies have been defined as units that have homogenous internal hydraulic parameters [Anderson, 1989] or as mappable units which are distinct and have internally consistent hydraulic properties [Fogg, 1989]. The former definition implies that the heterogeneity within hydrostratigraphic units is not as important as heterogeneity between the units, and the second definition includes smaller-scale hydraulic property variations within the facies. For example, Anderson [1989] categorized glacial deposits into hydrological facies based on grain size and sedimentary structure where each facies was assumed to be a distinct unit with internally homogeneous hydraulic parameters. Alternatively, Davis et al. [1993] recognized small-scale heterogeneity present within individual facies in an alluvial deposit in New Mexico, where each facies was interpreted as having a distribution of log-permeability values. In this study each facies had significantly different mean log permeabilities and geometries. This case study was designed to investigate the usefulness of tomographic radar data as an aid to spatial correlation structure estimation in hierarchical systems where the geophysical data sampling interval is not sufficient to capture information about the small-scale variability but is sufficient for recovering information about the large scale of variability. The model permeability field was simulated using a two-step hierarchical approach. The first step consisted of using an indicator simulation method to simulate the large-scale facies geometry patterns, and the second step consisted of simulating small-scale permeability variations within these facies. We model this system by defining Y(x) as a random function with the following spatial distribution: Y~x! 5 Z~x!Y 1~x! 1 @1 2 Z~x!#Y 2~x!.
(12)
In (12), Y 1 denotes the log permeability of facies 1 and Y 2 denotes the log permeability of facies 2. Z is an indicator space random function which can be equal to either 1 or 0 with probabilities P and (1-P), respectively; Z is equal to 1 if Y 5 Y 1 and is 0 otherwise [Desbarats, 1990; Rubin and Journel, 1991; Rubin, 1995]. For example, Y 1 can denote the log permeability of a sandy facies while Y 2 denotes the log permeability of a gravelly facies in a sand-gravel system. Equation (12) was adopted by Desbarats [1990] in his study of transport in a sand-shale study, as well as by Rubin and Journel [1991] in a similar study. Z(x) in (12) represents the geometry of the Y 1 , Y 2 distributions in space. Each of Y 1 (x), Y 2 (x), and Z(x) is modeled by its respective spatial correlation structure: C Y 1 , C Y 2 , and C Z . As each facies is defined as a distinct unit based on factors such as the facies hydraulic measurements, sedimentary structure, lithology, or genetic origin, it is reasonable to assume that the log-permeability distributions within these distinct units, usually created by different depositional processes, are independent. Given this assumption, the covariance (C Y (r)) for the bimodal heterogeneous system represented by (12) is C Y~r! 5 @C Z~r! 1 P 2#C Y1~r! 1 @~1 2 P! 2 1 C Z~r!#C Y2~r! 1 ~m 1 2 m 2! 2C Z~r!,
(13)
where m 1 5 ^Y 1 & and m 1 5 ^Y 2 & [Rubin, 1995]. The variance of the composite field is obtained for r 5 0 in (13):
1819
s 2Y 5 ~ s 2Z 1 P 2! s Y2 1 1 @~1 2 P! 2 1 s 2Z# s Y2 2 1 ~m 1 2 m 2! 2s 2Z, (14) where s Y2 1 and s Y2 2 represent the variances of the logpermeability distributions associated with Y 1 and Y 2 , respectively, and s 2Z represents the variance associated with Z. To simulate the hierarchical permeability field, the geometry of two facies was first generated using a sequential indicator simulator (SISIM) [Deutsch and Journel, 1992] with the discretization parameters shown in Table 1. For this first step of the simulation process, the covariance of the indicator values, which represent the presence or absence of facies at each location and thus the facies geometry, was governed by an exponential model C Z (r) whose form is given by (1). Plate 2a is a realization of the facies geometry field created from this indicator simulation process and is considered to be the model facies field. Intrafacies log-permeability distributions were subsequently defined based on parameters obtained from two actual wellstudied, unconsolidated sedimentary facies within a Pleistocene barrier beach deposit at Oyster, Virginia [Swift et al., 1996; DeFlaun et al., 1997]. These distributions were defined to be normal, with variances of 0.25. The mean of the logpermeability distributions was defined to be 4.2 for facies 1 and 4.5 for facies 2, both in units of log(darcy). Simulation of the intrafacies variability was performed using the facies distribution shown in Plate 2a together with a sequential Gaussian simulation program. Simulation was governed by equivalent exponential spatial covariance functions, C Y 1 (r) and C Y 2 (r), and was performed using the discretization parameters given in Table 1. A realization of the resulting log-permeability field is shown in Plate 2b; this field is considered to be the model log-permeability field and consists of a larger spatial scale of heterogeneity associated with the facies geometry and a smaller scale of heterogeneity associated with the intrafacies variations. The log-permeability range defined for facies 1 is representative of a very clean sand facies, and the range defined for facies 2 is similar to that of gravel [Freeze and Cherry, 1979]. The entire range of permeability is small, representing fairly homogeneous sandy-gravelly deposits. 4.2.1. Tomographic radar data simulation. To relate model core-scale log-permeability values to model core-scale dielectric constant values, we use the following relation:
k 5 27.95 2 1.695 log ~k, darcy!,
(15)
which was developed using regression techniques on colocated radar and permeability measurements collected at the Oyster site [Hubbard et al., 1996]. Again, we emphasize that construction of the model geophysical and hydrological fields is not part of the inversion procedure but in this synthetic case study is necessary to produce a representation of the subsurface, which is subsequently sampled by well bore and tomographic data. Although progress is being made in developing realistic twodimensional ground penetrating radar forward modeling algorithms [e.g., Bergmann et al., 1997; Carcione, 1996; Xu and McMechan, 1997], no commercially available, multiple-offset, forward radar modeling software currently exists. An ad hoc method, which included adding error to the model dielectric constant field followed by an upscaling process, was thus used to simulate tomographic radar acquisition through the logpermeability cross section shown in Plate 2b. To account for errors associated with an inversion process, spatially correlated
1820
HUBBARD ET AL.: SPATIAL CORRELATION STRUCTURE ESTIMATION
errors were added to the dielectric constant field obtained using (15). The magnitude and structure of the error were based on analysis of the errors generated by tomographic inversion of the seismic data discussed in case study 1. In addition, a random component of noise was added to account for factors such as errors associated with travel time picking and station locations, as discussed in section 4.1.1. These dielectric constant values were then upscaled to a geophysical-scale discretization using arithmetic averaging so that each new geophysical-scale node encompassed 25 core-scale values. The resulting corrupted data are shown in Plate 2c and are considered to be the radar data available from a field tomographic radar campaign. 4.2.2. Permeability estimation using radar and limited core data. In addition to the geophysical tomogram, one continuous core section from a borehole located along the leftmost column of the original model fields shown in Plates 2a and 2b was considered available for this analysis. The well bore data consisted of 100 core samples collected at a sampling interval of 20 samples/m. Each sample has both a permeability measurement and a facies designation. These limited borehole data are used to convert the two-dimensional dielectric constant field shown in Plate 2c into log-permeability estimates. We develop the petrophysical relationship necessary to perform this task using regression techniques, which require that the permeability and dielectric constant measurements be colocated. Because flow within the core during the laboratory analysis is perpendicular to stratification, harmonic averaging was performed to obtain an upscaled core permeability series. Regression analysis was then performed using the dielectric constant and the upscaled permeability values to obtain log (k, darcy) 5 15.38 2 0.536 k ,
(16)
with a correlation coefficient of 0.85. The simple relationship given by (16) was used with the radar data (Plate 2c) to obtain a two-dimensional field of permeability estimates. To compensate for the smoothing that may incur when using (16) to transfer the dielectric constants into log-permeability estimates, and the effect that this smoothing may have on the log-permeability statistical correlation structure estimation, the differences between the actual upscaled and the estimated log-permeability values at the well bore location were calculated and modeled. Analysis of these differences suggested that the regression process produced errors that were correlated with log permeability. The significant errors occurred at the log-permeability extremes; high log-permeability values were consistently underestimated and low log-permeability values were consistently overestimated. The relationship between log permeability estimated from the dielectric data and the error residual was modeled using regression techniques, and an error field was created that had a random component (« R ) and also reflected the dependence of the error on log permeability: « i 5 b 0 1 b 1˜ Y i 1 « R,i (17) ˜ where Y indicates the geophysical-obtained log-permeability values, b0 and b1 were obtained from the regression process, and m 5 1, M indicates the mth value in the field. As the error is a function of log permeability, and log permeability is spatially correlated, the error field has both random spatially correlated and uncorrelated components. This error was added to the estimated log-permeability field following (4) prior to correlation structure inference.
4.2.3. Spatial correlation structure inference. The single column of well bore permeability measurements and the twodimensional grid of log-permeability estimates obtained from radar data are available for estimation of spatial correlation structure of the hierarchical log-permeability and facies fields. The following analysis is performed in three parts: first, estimating the integral scales and statistical anisotropy of the model facies geometry and intrafacies log-permeability fields, and then trying to recover these parameters using information first from wellbore data and then from radar data. In this case study, s 2Z , I Z,i , and S Z (k i ) represent the facies-scale variance, integral scale, and spectral density function; s Y2 n , I Y n ,i , and S Y n (k i ) represent the intrafacies-scale variance, integral scale, and spectral density function; and s 2Y and S Y (k i ) represent the composite log-permeability field variance and spectral density function, where i 5 1, 2 indicates the spatial direction and n 5 1, 2 represents the facies designations. 4.2.3.1. Model fields: The model indicator data field which represents the facies geometries (Plate 2a) was transformed into the wavenumber domain, and the spectral density curves were calculated from this indicator data series. Using the variances estimated from the spectra in (5) yielded a vertical facies geometry integral scale (I Z,1 ) estimate of 16 cm and a horizontal facies geometry integral scale (I Z,2 ) estimate of 70 cm as shown in Table 3 in the top row (Model facies). Similarly, spectral density functions in the vertical and horizontal directions were calculated from the log-permeability field shown in Plate 2b. Unlike the model facies field, this log-permeability spectral density curve has variability associated with both large- and small-scale components. An expression for a spectral density that includes both large- and smallscale components was developed using the spectral representation of (13) by assuming that C Y 1 , C Y 2 , and C Z have exponential spatial covariance structures. For simplicity, we assume that there are two levels of spatial correlation only: one defined by the facies geometry (the large scale) and one defined by the intrafacies variability (the small scale), which are equivalent for each facies. In this case, I Y 1 ,i 5 I Y 2 ,i 5 I Y n ,i , and the spectral representation of (13) is given by S Y~k i! 5
s 2Z~ s Y2 1 1 s Y2 2! p
F
2 I Y2 n,iI Z,i 1 I Z,i I Yn,i
I
2 Yn,i
2 2 1 2I Yn,iI Z,i 1 I Z,i 1 k 2i I Y2 n,iI Z,i
1
~P 2s Y2 1 1 ~1 2 P! 2s Y2 2! p
1
s 2Z~m 1 2 m 2! 2 p
F
F
I Yn,i 1 1 k 2i I Y2 n,i
I Z,i 2 1 1 k 2i I Z,i
G
G
G
(18)
By estimating s Y2 1 , s Y2 2 , m 1 , m 2 , and P, potentially from borehole data, and I Z,i and s 2Z from the spatial correlation analysis of the facies information, I Y n ,i can be estimated by fitting a composite log-permeability spectral curve, S Y (k i ), with (18). If it had not been assumed that I Y 1 ,i 5 I Y 2 ,i , then additional information would have been necessary to solve for the individual intrafacies integral scales. For analysis of the model field, s Y2 1 , s Y2 2 , m 1 , m 2 , and P were calculated from the model in the spatial domain, and these values, together with I Z,i and s 2Z calculated as described above, were used in (18) to estimate the vertical and horizontal intrafacies integral scales. Estimates from this analysis are given in Table 3 in the second row (Model intrafacies). Figure 5 illustrates the small-scale, large-scale, and compos-
HUBBARD ET AL.: SPATIAL CORRELATION STRUCTURE ESTIMATION
Figure 5. Spectral density curves in the vertical direction simulated using the model spatial correlation structure parameters and equation (5) for the facies and intrafacies subpopulation curves (S Z and S Y n , respectively) and equation (17) for the composite log-permeability curve (S Y ). ite spectral density curves simulated using the model facies and intrafacies spatial correlation parameters for the vertical direction which are given in Table 3. The intrafacies and facies spectral density curves (S Y 1 (k 1 ) 5 S Y 2 (k 1 ) and S Z (k 1 ), respectively) were simulated using these model spatial correlation parameters with (5), and the composite spectral density curve (S Y (k 1 )) was simulated using the estimated model parameters with (18). These curves show that the contribution to the composite spectral power from the large-scale heterogeneity is detectable at low frequencies and decreases as the frequency increases and that the composite spectral density is always greater than that associated with the small-scale, or intrafacies, heterogeneity. These observations are reasonable considering that the spectrum represents the distribution variance over wavenumber. Note that because the composite spectral density curve is subparallel to the intrafacies spectral density curve, it would be difficult given only high-frequency information, such as that available from discrete core sections, to detect the hierarchical nature of the system. 4.2.3.2. Well bore data: We now consider spatial correlation structure information available from analysis of the 100
1821
available well bore core samples. Following the analysis presented above, we first attempt to estimate the large-scale variability associated with the facies geometry. To do this, all well bore samples with facies 1 designations were coded as 0 and all facies 2 designations were coded as 1. The well bore indicator data series was transformed into the wavenumber domain, and the spectral density curve in the vertical direction was calculated from this indicator data series. Using s 2Z estimated from the spectra, I Z,1 was estimated from the core facies data using (5). The results of this fit are shown in Table 3 in the third row (Well bore facies). Next we attempt to estimate the intrafacies spatial correlation structure using the well bore permeability measurements and the facies geometry spatial correlation parameters estimated above. The well bore log-permeability measurements were transformed into the wavenumber domain, and the spectral density curves were calculated from these data. As the well bore traverses the entire length of the domain and samples with a small interval, both scales of heterogeneity should be detectable. From the single column of well bore data, m 1 , m 2 , s Y2 1 , s Y2 2 , and P were estimated. Using these estimates together with s 2Z and ˆI Z,1 , which were estimated from the well bore facies information as discussed above, the composite well bore log-permeability spectral density function was fit using (18). The results of this fit are given in Table 3 in the fourth row (Well bore intrafacies). 4.2.3.3. Radar data: Analysis of the well bore data suggests that the system is composed of two facies and that the intrafacies vertical integral scale estimated from the well bore data is of the order of 6 cm (Table 3). Since the geophysical samples are spaced every 25 cm, recovery of the small-scale variability using the coarsely sampled radar data is deemed futile. We attempt, then, to recover only information about the larger scale of variability from the radar data. If the geophysical resolution is much lower than the small-scale logpermeability variations, then the contribution of the smallscale log-permeability variations to the radar spectral response should be negligible. In this extreme case we can approximate I Y n 3 0, in which case (18) reduces to S Y~k i!