SPATIAL DATA INTERPRETATION FOR THE INTELLIGENT ACCESS TO SPATIAL INFORMATION IN THE INTERNET Frauke Heinzle, Matthias Kopczynski, Monika Sester Institute of Cartography and Geoinformatics (ikg), University of Hannover, Appelstr. 9a, 30167 Hannover, Germany
[email protected] [email protected] [email protected] Abstract While the electronically available information in the Internet is explosively growing and thus increasing, the difficulty to find relevant information is also increasing. Existing search engines are using keyword matching to retrieve information related to the queries of a user. This implies, that the keywords have to be present in a data set, and that the meaning or semantics of the keywords corresponds to the one required by the user. The idea of the Semantic Web is to enrich the data sets by semantic tags which in turn disambiguate different meanings of keyword, and finally enable also intelligent agents to make use of the information in the web. Dealing with spatial information in the web presumes that also a spatial semantics has to be annotated to the spatially related information in the web. The goal of the SPIRIT project is to enrich web resources by spatial concepts and also make spatial data sets visible and usable in the internet. In this paper, we present two aspects of setting up a spatially aware search engine, which both deal with the interpretation of spatial data. Firstly, information in existing spatial data sets is analysed to get information about spatial phenomena and relations, even with respect to unknown, implicit data. The second part deals with investigations in using sketches as an alternative user interface modality to support a users query. 1. INTRODUCTION In the 1990s the Internet started a revolution in everyday life because a huge amount of information was made available for everybody with a connection to the web. One solution of providing access to the Internet is to let the computer look at every page in the web and add it to a big sorted catalogue. The user can type in a keyword and the “search engine“ looks it up. All matching web sites are presented to the user sorted by their relevance. The catalogue is compiled fast compared to the amount of web sites it has to cope with. It is always up to date and can cover almost the whole Internet; a prominent example is Google, which is today the biggest search engine in the net. The project SPIRIT tries to improve the concept of search engines. Many questions have a spatial context which is not used in existing search engines to get useful answers. The problems lie in the explicit description of spatial concepts in the web, and in the adequate user interface to specify a query and present the result. To solve these problems we need a new user interface dealing with maps and spatial terms, find a way to index the web sites spatially and provide a mechanism of reasoning with spatial terms. Furthermore, spatial information typically is coded in spatial data sets, thus also these 2D-geo-datasets have to be made accessible to the internet. The problems will be tackled with the introduction of an ontology on spatial concepts. It will also help in sorting the query results according to their spatial relevance. SPIRIT (Spatially-aware Information Retrieval on the Internet) is a project funded by the European Community in the framework of the IST-Programme (Information Society Technologies). It is a consortium of 6 partners from the European Community and Switzerland. The duration of the project is scheduled from May 2002 till May 2005 and will result in the implementation of a prototype of a spatially-aware search-engine. A big problem is the use of place names and spatial relationships in search-engines, for example when looking for a hiking trail near a place called “Schwarzwald”. Mostly, spatially related notions are not well defined: terms like “near”, “in the vicinity”, “around”, “outside” and relationships and words to express topological circumstances are encoded in small filler words. They are removed by usual search engines but provide a lot of information about the users intention. Our field of research in SPIRIT goes far beyond only inspecting and annotating the ostensible vector elements in spatial data sets. Topological relations, geometrical shapes, distribution in space, geographical classification, layout of the features, frequency of occurrence, distances, immediate vicinity, closeness, thematic connections etc. play a prominent role in analysing the data and deriving further information.
2. SPIRIT AND RELATED WORK The idea of the Semantic Web, introduced by Berners-Lee, T. [1][2][3], is to make the huge amount of information within the WWW available for an automatic analysis and use. Then, the information will not only be machine readable but also machine understandable: the vision is that intelligent agents are able to crawl the web and collect relevant information for a certain task, e.g. arranging an appointment with a medical specialist, or planning a holyday trip. In order to achieve this, the information in the web has to be enriched by machine understandable tags. The meaning of these tags goes far beyond that of the metatags specified in the header of today’s HTML pages. They are meant to more precisely describe the contents and the context of the data contained in the page. To this end, ontologies have to be defined that describe ”consensual, shared, formal descriptions of important concepts in a domain” [4]. Allowing different ontologies makes it possible to classify existing information and to build up schemes that model different terminologies [5]. When setting up an ontology, a common concept has to be developed to determine the meaning of a term concerning the context it is used in. A specific term gains its meaning typically from the context it is embedded in - which is how humans typically understand phrases and terms, namely by setting it into the context of their background knowledge. That implies the definition of a common language and a vocabulary of concepts where the information is coded in. For the representation of ontologies, several languages have been developed, e.g. SHOE [6] or DAML+OIL [7] [8]. The representation of knowledge in ontologies faces different challenges today. Typically an ontology will be implemented in terms of a centralized and explicitly fixed concept. That implies that the user, who applies the ontology in his or her web pages has to fully agree with all conventions made. In order to also allow the creation of own ontologies, interfaces were developed to enable a user in building up and modifying an ontology, which fits to his understanding [9]. Other research issues deal with the generation of semantic translators for the combination of different ontologies, the automatic information extraction and the design of intelligent agents. SPIRIT wants to extend the accessibility and usability of spatial knowledge, thus a geographical ontology has to be developed. Representations to encode geographical terminology have been developed in the context of geographical thesauri and gazetteers, e.g. the Getty Information Institute’s Thesaurus of Geographic Names [10] or the Alexandria Digital Library gazetteer [11]. In the TGN places are encoded hierarchically (i.e. relating to administrative regions, countries, …), whereas the information in gazetteers typically is not that rich. In both representations, the spatial component is either given in terms of a point-based or polygon-based footprint. This will be the starting point for the research of SPIRIT. In the context of SPIRIT an ontology is needed to model the spatial terms, relationships and associated thematic questions in a semantic network. The following tasks will be solved with the SPIRIT search engine [12]: 1. 2. 3. 4. 5. 6.
Recognise the presence of a place name or spatial relationship in a query or a document; Find web resources that contain alternative versions of a user specified name; Find web resources that refer to places that are inside or nearby to a specified location; Distinguish between different types of place; Perform efficient indexing of web resources to find quickly resources relating to particular regions of space; Perform relevance ranking with regard to geographic space as well as to non-geographic factors.
One aspect of our work is to populate the ontology with specific knowledge. This is presented in Section 3, where the issue of interpretation of given spatial data sets with respect to inherent, hidden information will be focused on. The second aspect, presented in Section 4, lies in the provision of a new interface modality to communicate with the search engine, namely sketches. Interpreting sketches needs prior knowledge about possible meanings, thus sketches have to be analysed with respect to the given ontology and the vector data sets. For both tasks mechanisms for the automatic extraction of implicit information will be needed, using techniques from computational geometry [13], image interpretation [14] and spatial data mining [15]. Finally, a conclusion and an outlook on future work is given in Section 5. 3. DISCOVERING IMPLICIT KNOWLEDGE IN SPATIAL DATASETS 3.1 General Problem SPIRIT aims at raising the visibility of Internet resources to spatial search engines. We are focusing on automatically extracting relevant information from spatial data sets. Therefore automatic data enrichment techniques have to be developed not only to learn about the content but also to extract the geographical semantics of spatial data sets. The major challenges and principle aim of our research is to inspect a dataset for implicit, hidden information and thus extract its semantics. Important types of information in this context are spatial relations and higher level groups of objects.
This kind of information is typically grasped by classifying or categorizing those pieces of information, which seems to belong together. Thus, we build thematic clusters as well as spatial clusters. An example for such a process is the way a person automatically is able to localise centres of settlement areas or urban areas when looking at a map. Without knowing anything about the urban area itself, humans are able to delineate the city limits, or to form an opinion about the importance and influence of the urban areas relating to their surroundings. This interpretation often happens unconsciously, by using our cognition and background knowledge. Of course, it is a subjective nature in these conclusions, that typically depend on our knowledge. The idea is to make this knowledge and these rules explicit and represent them in a machine processable way in order to derive information, which does not explicit exist and is not formally expressed in existing data sets. 3.2. Spatial data interpretation – finding implicit information in spatial data sets Spatial data interpretation is a well known problem from Image Analysis, where the task is to find meaningful objects in a collection of grey value pixels. In GIS-data, in contrary, the data already have a given interpretation – however, there is more information in the data sets even beyond the explicit one. For example the above mentioned city centre or the impression, how one could spend the holiday in a specified area only from evaluating the recreational potential there. For interpretation either supervised or unsupervised approaches can be used. Supervised techniques provide a model or template of the searched information, that has to be matched against the data set. The methods vary according to the given models: specific models exactly define individual object instances, whereas generic models describe more general concepts, e.g. a whole class of objects. Unsupervised approaches do not use prior knowledge in terms of objects or concept models. These techniques, in contrast, look for regularities in the data sets. Regularities can occur in terms of similar attribute values, similar neighbourhood characteristics, or similar relations. Unsupervised approaches identify objects sharing these regularities as clusters. An assignment to a certain object class has to be done manually in the end of the process. This type of mechanism is used in Data Mining, or Spatial Data Mining [15], where implicit information is searched in large databases [17]. There are different techniques of Data Mining and often they are associated with statistic analysis. For example, the most important techniques to find out interesting and unknown structures in data are classification, association, clustering and numerical prediction. Decision trees and classification rules are used to describe the extracted knowledge. With the growing availability of data sets in the Web, appropriate tools for intelligent analysis, interpretation and use are needed. Hence Knowledge Discovery and Data Mining are key elements to support discovering implicit information structures. The challenge within SPIRIT is to provide a set of general interpretation tools that can be applied to a variety of spatial data sets. Furthermore, an intelligent control strategy for combining the different information chunks is of crucial importance. E.g. imagine the problem of distinguishing a big city in a data set from other, less important cities. An intuitive way to infer the importance would be to use the number of inhabitants. Other criteria might be the existence of special infrastructures or certain building types (e.g. administrative buildings). The problem is that “big city” is somehow relative, thus the criteria has to be well considered and combined depending on a given context. Furthermore, an important issue is the assignment of quality or certainty to a certain decision. Flexible interpretation tools are needed, as depending on the environment or application no strict rules are applicable, thus no predefined solution can be given. So the problem is to adapt the human process of knowledge acquisition, and to simulate this process of decision making depending on the environment. 3.3. Interesting spatial concepts for SPIRIT In the following, a first collection of possibly useful information in the geographic context is listed. This information is important and useful for our application areas, namely tourism, regional planning, location searching etc. In the following subsections, there is a collection of targets for automatic information extraction. They are structured according to those information chunks that are available in the data sets (first row of table), together with the necessary operations to extract and combine the information (second row). Concerning the data set, we are referring to the German topographic data set ATKIS. The list will form the basis for the identification of general spatial interpretation operations. In the subsequent steps, these operations will be implemented and used for different scenarios and data sets. 3.3.1. Classification of important cities Whereas most topographic data sets contain topographic objects, information about the relative importance of a city is typically not explicitly stored and has to be inferred from given information with appropriate operations. The following collection of information chunks can be combined to classify a city as being important or not. An open question is how to integrate and combine the different information parts. A probability based approach will be needed in order to take possible variations of the given information into account.
explicit objects, information settlement areas administrative boundaries streets railways, railway station water bodies, harbour public transportation administrative buildings schools, universities, educational institutions churches shopping-centre, market places town hall all extracted cities
operations extent, size, density, classification into different categories (e.g. built-up areas, industrial areas, areas of commerce) -> presence of all categories extent, size, distribution of settlement areas inside the boundary category, junctions, density junctions, stations, location in relation to city boundary presence, location with respect to city boundary type, number of stations, density, operation frequency type, uniqueness, number, in the range of -> commuter belt number, uniqueness, catchment area number number, size, catchment area, types of products existence comparison, scale of valuation
3.3.2. Sphere of influence of cities Relating to the investigation into important cities mentioned above it is of substantial interest to know about the range an urban area extends to. Thus it is also possible to allocate the space between settlement areas to the cities, dependent on their influence. The description and assessment of such relative and imprecise terms like “near”, “in the vicinity”, “next to”, “outside of the boundary” or “in the middle of” is of special value. The range analysis is one step further to solve the problem of undefined terms and to interpret those expressions by making a valuation. all existing cities
comparison of all cities of the same category, Voronoi diagram resp. Delaunay triangulation
3.3.3. Detection of the centre of a city The information about the centre of a city typically is not encoded in a data set. Looking at an aerial image or at a map, a human usually is able to identify the centre using criteria like density of the road-network, density of the administrative buildings and buildings of small commerce and absence of industrial areas, respectively. settlement area streets, traffic areas administrative buildings, small commerce market places stations (bus, railway) industrial areas
extent, density junctions, density of road network presence, certain agglomeration of them location junctions, overlapping, number, possibilities of transfer non-presence
3.3.4. Determination of tourist areas and attractive destinations In order to qualify an area for recreational or tourist purposes, it has to be conform with several issues, e.g. cultural, historical, adventurous, sporting or amusement facilities. Most of these issues are often mentioned on homepages of tourist business. However these criteria also can be found in spatial data sets, as some noted below. line of communication, traffic special infrastructure water bodies, landing stages for boats, ferries, beaches hiking trails hotels, youth hostels, camping sites forest areas restaurants differences in elevation museum cinemas possibilities of recreation (playgrounds, barbecue, sports field, parks, swimming pool, signed recreational areas) landmarks for sight seeing
number, characteristic (trail, bicycle, motor way) characteristic, special names („Burgenstraße“) type, number, distribution regional distribution number, distribution extent, number of trails in it number, distribution how to deal with it (cable cars) number, distribution number, distribution number, distribution, extent number, distribution, significance
3.3.5. Possibilities of suburban or industrial settlement, urban development, quality of housing The usability of an area for a certain purpose is a very important task, e.g. when looking for housing in a new city, looking for a site for a restaurant, determining the quality of living in certain areas of a town. In order to solve this task, both presence or absence of certain factors are important, and spatial relations among these factors. The quality of housing (and the price for renting/buying a house as a consequence) e.g. depends on the type of settlement area, the closeness to recreation areas, public transportation, the presence of small commerce and shopping facilities. settlement areas traffic routes local industry, trade shopping centre infrastructure present land use structural and natural environment in the vicinity
type, high/low density areas number, type, distribution, density number, type, distribution, density number, type, distribution, density number, type, distribution, density classification, distance to urban centres or industrial areas or recreational areas, distance, neighbourhood
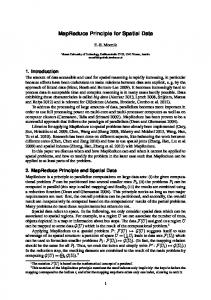
This first collection of possible queries to SPIRIT leads to a set of analysis functions that have both thematic and geometric components. Besides simple counts of objects (“number”) or determination of the type of an object, geometric operations like the evaluation of density, distribution, connectivity and the relative location with respect to other objects is of great importance. The next steps in our research will be dedicated to develop automatic functions to solve these operations. 3.4. Example of the ATKIS data set The following illustrations will give a first idea of how such an analysis can be carried out by taking up the question of the first example mentioned above: the classification into important cities. It shall point out the first steps to discover the searched knowledge with automatic algorithms. Firstly, the settlement areas have to be investigated. The first thing one perceives is an area covered with settlements and industry. However this information is split into many parts, there is no contiguous covered settlement area. In order to aggregate the disconnected parts, a clustering algorithm has to be used, that takes the relative neighbourhood of the objects into account [18]. Further small splinters has to be suppressed and the algorithm has to focus on larger areas. Figure 1 shows a data set example and Figure 2 the requested result.
Figure 1: Settlement areas
Figure 2: Clustered regions
It gives a first key for evaluation, but does not describe the importance of the city in the network of population density, living comfort, trade, economic, shopping facilities and supply of services. Often there is one central settlement within the limits of the administrative boundaries, thus, they have to be included and overlaid. It becomes visible, that there are three major administrative boundaries (Figure 3). The decision on a main city depends on the clustered region is situated inside an administrative boundary and the size of the area. Geometrical algorithms to perform overlay and intersection have to be used, and also combined with thematic information. And also the correct order and configuration of the rules to check have a big influence to the accurateness of the result. In order to decide about the importance of the cities A, B and C with their clustered area, we have to investigate into streets, railways, their junctions as well as into water bodies and their distribution, respectively.
Figure 3: Administrative boundaries
Figure 4: Streets, railways and water bodies
In Figure 4 you can find a motorway junction north of city A, there are many junctions and routes of streets of lower category in city A. Furthermore, city A also has a direct link to a canal. Also, city A has large industrial areas in its south and west. City B has a station where two railway routes are conjoining. City C, finally, has a station and a harbour. A human would now possible infer, that city A is the most important one. For the automatic process, two main issues have to be solved: after having identified the different information chunks that are relevant to decide on a higher level concept like “important city”, the crucial question arises how to weight the facts automatically and how to evaluate spatial expressions like “near” or “direct link”. An intuitive way is to compare the absolute distance dimensions concerning the investigated region, but one has to bear in mind, that the value of absolute distances is depending on the area the data set covers. It is also of interest, that a bigger city has even more distant infrastructure facilities just because of the extent of the city. That is why the implementation deals with the boundary of the clustered city. In dependence of the general extent of the data set and the extent of the clustered settlement area a relative factor to all measures of distances is calculated. Direct neighbourhood will be calculated using a Delaunay triangulation. The relative position of objects with respect to others can be decided using topologic relations [19], that can be assigned also quality values [20]. “Direct link” can be evaluated using shortest path algorithms. 4. SKETCHING 4.1. Sketching as alternative user interface for SPIRIT Imagine you are looking for an accommodation somewhere in France for your holydays. As usual you could use Google or even better the text interface of SPIRIT, especially when there is a strong spatial component in your question. But SPIRIT can do much more. Most people prefer to take a pencil and a sheet of paper when they want to explain a spatial situation. A spatial situation is inherently two-dimensional – therefore, using a two-dimensional communication means is straightforward and sometimes more direct and immediately understandable than a (linear) sentence. Furthermore, two-dimensional notions like near, in the vicinity, north of, can easily be “described” in a sketch. From this representation, numerical values, that are needed for automatic processing, can more easily be derived than from a mere textual description. So why not draw a sketch on the display of a computer? The basic tools for creating an analogue sketch were mentioned briefly, only pencil and paper are required and a picture of the situation in mind of course. Every human would be able to recognize the sketched situation. It is one form of human communication. 4.2. Hardware requirements In our case the search engine runs on a computer. So the right term for the process is human computer interaction (HCI). Pencil and paper are not available for this kind of communication. Of course it would be possible to scan the sketch and the received raster image could be an input for the processing of the sketch. This way a lot of information is lost as shown later and it would not be practical for the every days usage of the search engine. Integration of available hardware is recommended. At home at least a monitor is used as a display and a mouse and a keyboard is available for input. The disadvantage is the separation of sketching tool and display. Better, but up to now rarely used, is a tablet with a better feeling for the pen but the drawback of separation between the media and the tool still remains. In the mobile market another development can be observed. Because of the need for small and compact devices the display is the input device at the same time. A pen can be used to draw and type additional characters on a software emulation of a keyboard. There is no real keyboard anymore. Today there is the choice between small PDAs with limited display capabilities or a Tablet PC which has a rather big display and would be the most suitable device for sketching on the computer.
Figure 5: Locating hotels by a sketch In the case of SPIRIT all questions have a spatial relation. The user has an idea in mind where something may be located like in Figure 5. The area is the primary constraint but it is not necessary a very precise constraint. The drawing media has two dimensions and when sketching a spatial situation in smaller scales it is drawn like a map from the birds view. In larger scales the height may be more important and may be drawn vertically but SPIRIT does not focus on this. 4.3. Basic elements of a sketch In contrast to maps, where measurable geometry is important, sketches contain relations like near, behind, left of or neighboured to determine the arrangement of items. It depends on the individual view of the world that is in the users mind. In this world concepts and relations, which are also concepts, result in a complex map which is build up by learning. This facts has been checked empirically by Blaser [21]. He pointed out the phenomenon that in a sketch the vast majority of people prefer to draw abstract items as a representative for the concepts they have in mind. Realistic drawings of items are rarely used and the placement depends on the imagined not the real distance. When the sketch is finished it may look very complicate because there are many ways of placing the items on the sketchpad and there are also many ways of drawing a particular item. On closer inspection the basic structure becomes visible. In an analogue sketch the only ways to create a picture is to use the pencil for drawing lines onto the paper. The idea is only expressed by combining lines to well known patterns, while the patterns are strongly cultural influenced in some cases. This observation is made in the hand writing process. Lines are combined to letters and letters are combined to words and sentences. The placement tells about the context of the line and in China the patterns look very different from the ones used in Europe Lines are very basic elements of a sketch. However, lines are not the only basic element to be used in a computer sketch. In contrast to the analogue case the basic input modality of a computer is typing. Letters are encoded directly as a numerical value and their meaning is defined in standards. Thus it is an easy task to integrate some text typing into the sketching tool. Usually every sketch contains some text. It is an enormous help for its interpretation if each letter is coded directly without being interpreted from line patterns. A keyboard or a keyboard emulation is accessible on almost any device. A related topic is the use of drag and drop icons with a fixed conceptual meaning. Only the relations to other concepts must be interpreted. Note that the possible input element text is only a special case of this. Typed Text and pictograms are basic elements in computer sketches. Sketching is a very sequential task. It cannot be noticed in the ready drawn sketch but during the creation one line after the next is placed on the sketchpad. On paper this information gets lost but the computer can record it and use the additional information as a hint for closely related elements. Sequence is an invisible but still recordable element of a computer generated sketch. As shown in the last section the sketch is composed from a set of basic elements. Each element for itself doesn't provide much information. Only all elements together can tell the intention of the sketch creator. As noted above the concepts and their relations are the central part of the sketch. The drawn elements must be brought into relation to this concepts. For instance a text together with a circle may stand for the specific concept “Hamburg” or “Large city” if a certain class of cities is meant. A connection to the concepts in the ontology must be found.
The difference between specific concepts and abstract concepts leads to two different kinds of sketches. In the first case (Figure 6) the sketch is linked to one specific place. There is only one correct interpretation of the sketch. The drawer wants to find web sites about a well defined region when using the sketching tool in SPIRIT to formulate a query. The second possible type develops from sketches with abstract concepts. No specific place is given and the possible solution of the interpretation process is ambiguous. The drawer does not know exactly the place he wants to find but he knows how the place should look like. An example is to look for places in southern France like in Figure 7. Both forms might be mixed in one sketch. Then it must be handled like the second case but with some specific constraint.
Figure 6: A specific region to locate hotels in Durban
Figure 7: Ambiguous localisation of a city in France
4.4. Sketch interpretation The last section described what a sketch is and how the users intention is brought into a two dimensional form on paper or a sketchpad on the computer. There are some basic elements and there are specific or abstract types of sketches. But how does the computer know what is in the sketch? How can he find out how spatial or non-spatial concepts are related or even which concepts are placed in the sketch? Is it possible to find all the places that are described with an abstract sketch? In brief the following process can be used to answer these questions. In general the first step is to find out some basic properties, geometrical relations, that are not explicitly given but are easy to recognize for a human being. The combination of the basic elements with the basic properties will make it possible to find out which of the elements belong to a group. The groups are geometrical anchors for the concepts that were intended by the drawer and may be a composition of arbitrary basic elements. But what is the concept behind a group? This may for some part be resolved from the ontology, for another part some kind of pattern recognition must be applied. The context of a group is important for finding a solution for this pattern recognition process. But also for the next step of sketch localisation the relations between the groups must be extracted. The interpretation starts with the basic properties. They are implicitly given by the geometry of all lines and texts in the sketch. The pure list of lines and text is only a bunch of elements without any relation to each other. But there are many interesting facts to say about them and these facts are needed for deciding whether an element is part of a certain group or not. At first a list of possible properties: -
Neighbourhood Crossing Inside of Smoothness
-
Direction Orthogonality/Parallelism Linear form/Curved form
This list neither claims to be complete nor does it claim to be relevant for every case. In fact Blaser [21] pointed out the importance of neighbourhood. There is a great chance that two neighboured basic elements belong to the same group or are part of two related groups. The natural way to find out which elements are neighboured is to calculate the constraint Delaunay triangulation [22]. CDT must be used because the interesting geometry is linear and not limited to points. Not less import might be topological relations, e.g. if two elements are crossing each other or if an element is inside the area of another element. Direction is characteristically for several metaphors, especially the special case of orthogonal or parallel direction. Streets often are symbolized by two parallel lines while an orthogonal crossing may be the symbol for a church. The element itself can be characterized by its form. For this purpose it is useful to find a measure for the linearity or for the tendency to change the direction. The next step is to find out where the groups are. How many groups are in a sketch? A rough estimate is the number of text elements. The reason for this is that texts are likely to contain names of concepts in the sketch. Then lines near the
text show where the concept is geometrically situated. The grouping algorithm then tries to add neighboured elements to each group. An element is added if its basic properties match with some pattern in the pattern database. This requires some knowledge about how concepts are usually drawn. It can be provided a priori in terms of a fixed “vocabulary” or can be trained to the system using Machine Learning approaches [23][24]. The whole process looks like a crystal seed growing from a small entity until all available material is already used. If a text is given the identification of a concept is easy: it can simply be looked up in the ontology. Much harder is the identification of unknown texts or groups without any text. Groups without text are located by looking for known patterns in the basic elements and their basic properties. A knowledge base must be given and if a group of elements matches some description in the knowledge base the concept is also known. Because the patterns are of a generic nature the resulting concepts are in most cases abstract concepts expanding to many specific concepts. The groups are geometric representations of their assigned concepts. Thus the basic relations that were described for basic elements can also be applied on groups. This is interesting for the next step of identifying where the sketched situation is located. But also while growing the seeds it can help in assigning concepts to the groups and narrow down the search space for the pattern matching. The combination of several elements to one group has an impact on the definition of the basic properties. The extraction must be flexible enough for both the simple and the complex cases. 4.5. Sketch localisation Now the computer knows about the concepts in the sketch and how their representing groups are related geometrically. The user, however, is interested in localizing a spatial situation corresponding to his sketch. Thus, this interpreted situation is only a basic step for the localisation of a sketch. The desired result is an area that fits the sketched situation as well as possible. To find out where the sketch is located, it must be known if the matching concepts in the ontology are of a specific nature or are abstract classes with many possible instances. The ontology gives information about the nature of a concept and how it is related to other concepts. It can answer questions like: “Is city A in Country B?” or “Is C a city?” In the geographic ontology defined in SPIRIT a basic geometric representation for the objects is given in terms of point or polygon footprints. If this information is not accurate enough for localisation, also vector data sets can be used to provide more precise information. The geometric entities in the data set must be identified with the terms in the ontology to make a fast access possible. Specific places can be looked up directly from the link between the ontology and the vector data. The city “Hamburg” can be directly linked to the corresponding geometrical entities. In the simple case this are the boundaries of the city area and in all other cases areas, lines and points matching the term must be aggregated to a boundary object. This boundary object is the result of this look up process. In contrast to this easy case much more effort must be done if abstract concepts are to be discovered. They are also found in the ontology and could be linked to entities in the vector data set. But since an abstract concept has more than one possible instance the right one has to be found. And there may be more than one right solution. A first approach would be to produce possible sets of instances for the concepts combinatorial until all potential settings are found. Then, for every potential setting its consistence with the given relations between concepts must be checked. If it is consistent then it is a valid solution for the sketched situation. With a small number of possible solutions this would work fine. But the complexity of this task grows exponentially because every instance of an abstract concept must be combined with all instances of all other concepts. This is a general problem in the research area of Artificial Intelligence where a set of well known algorithms are available to deal with this kind of task. [25]. In order to find possible solutions in short time (some seconds), appropriate constraints have to be used as heuristics to narrow down the search space. 5. CONCLUSIONS AND FURTHER WORK The article presented problems related to spatial data interpretation in the context of realizing a spatially aware search engine. The basic element for an interpretation is the existence of a geographic ontology with spatial terms. Interpretation techniques are needed to automatically enrich the ontology with the help of existing geo datasets, and to annotate spatial data sets. The purpose of sketching is to provide a new way of formulating a query with spatial relations in a search engine; here the ontology is used to interpret the contents of a sketch. Both methods inherently rely on geometric operations in vector data, and – more importantly – reasoning with the help of knowledge about spatial relations in our world. The automatic annotation procedure will be of great use for data providers who can use this technique to automatically advertise the contents of their data sets. The very costly and time consuming manual annotation with metadata can be
automated using our approach. As only the annotated information has to be published in the web, there is still an incentive for possible users to buy the data, if it provides the information and the quality he is looking for. The research described in the paper is only in the beginning, so there are many open questions to be solved in the near future. Concerning spatial data interpretation, algorithms identified in Section 4 will be implemented and tested with respect to different scenarios. The goal is to have a set of generic tools available to detect “interesting” information in any kind of spatial data set. While the first step is to extract elementary information chunks, the next challenge is the combination of these pieces of information to achieve a higher level interpretation. A rule based system using quality measures seems to be appropriate. 6. REFERENCES 1 2 3 4 5 6 7 8 9 10 11 12 13 14 15 16 17 18 19 20 21 22 23 24 25
T. Berners-Lee, Weaving the Web: The Original Design and Ultimate destiny of the World Wide Web by Its Inventor, Harper, San Francisco (1999) T. Berners-Lee, J. Hendler, O. Lassila. The Semantic Web. Scientific American, 284(5), pp. 34-43 (2001) J. Heflin, J. Hendler, A Portrait of the Semantic Web in Action. IEEE Intelligent Sys. 16(2), pp. 54-59 (2001) D. Fensel, Ontology-Based Knowledge Management, IEEE Computer, Vol. 35, No. 11, pp. 56-59 (2002) S. Winter, Ontology: buzzword or paradigm shift in GI science?, International Journal of Geographical Information Science, 15 (7) (2001) SHOE, Simple HTML Ontology Extensions, http://www.cs.umd.edu/projects/plus/SHOE/ (2002) W3C, DAML+OIL (March 2001) Reference Description, http://www.w3.org/TR/daml+oil-reference (2001) W3C, OWL Web Ontology Language, http://xml.coverpages.org/owl.html (2002) N.F. Noy, M. Sintek, S. Decker, M. Crubézy, R.W. Fergerson, M.A. Musen, Creating Semantic Web Contents with Protégé-2000, IEEE Intelligent Systems 16(2), pp. 60-71 (2001) Getty Thesaurus of Geographic Names, http://www.getty.edu/research/tools/vocabulary/tgn/ (2002) ADL, Alexandria Digital Library Project, http://www.alexandria.ucsb.edu/ (2002) G. Fu, A. Abdelmoty, C.B. Jones, Design of a Geographical Ontology, D5 3101, Public Deliverable SPIRITproject, http://www.geo-spirit.org/ (2003) M. de Berg, M. van Kreveld, M. Overmars, O. Schwarzkopf, Computational Geometry - Algorithms and Applications, Springer, Heidelberg (2000) R.M. Haralick, L.G. Shapiro, Computer and Robot Vision, Addison-Wesley, Vol. I & II. (1992) K. Koperski, J. Han, Discovery of Spatial Association Rules in Geographic Information Databases, Proc. Advances in Spatial Databases ’95’, Lecture Notes in Computer Science, Vol. 951, pp. 47–66, Springer, Heidelberg (1995) ISO Technical Committee 211, ISO 19115 Geographic Information – Metadata, http://www.isotc211.org/scope.htm (2001) I.H. Witten, E. Frank, Data Mining: Practical Machine Learning Tools and Techniques with Java Implementations, Morgan Kaufmann, San Francisco (1999) K.-H. Anders, M. Sester, Parameter-Free Cluster Detection in Spatial Databases and its Application to Typification, IAPRS Vol. XXXIII, Part B4/1, Comm. IV, pp. 75-82, ISPRS Congress, Amsterdam (2000) M. Egenhofer, R. Franzosa, On the Equivalence of Topological Relations, International Journal of Geographical Information Systems, 9(2), pp.133-152 (1995) S. Winter, Uncertainty of Topological Relations in GIS, H. Ebner, C. Heipke & K. Eder, Eds., Proc. of ISPRS Comm. III Symposium Spatial Information from Digital Photogrammetry and Computer Vision, Munich, Germany, Vol. 30/3, pp. 924-930 (1994) A. Blaser, Sketching Spatial Queries, PhD Thesis, Department for Spatial Information Science and Engineering and National Center of Geographic Information and Analysis (NCGIA). Orono, ME, University of Maine (2000) J.R. Shewchuk, Constrained Delaunay Tetrahedralizations and Provably Good Boundary Recovery, Proceedings, 11th International Meshing Roundtable, Sandia National Laboratories, pp.193-204 (2002 ) R. Michalski, J. Carbonell, T. Mitchell, Machine Learning – An Artificial Intelligence Approach, Springer Verlag, Berlin, Germany (1984) M. Sester, Lernen struktureller Modelle für die Bildanalyse, Deutsche Geodätische Kommission, Reihe C, Vol. 441, München (1995) S. Russell, P. Norvig, Artificial Intelligence – A Modern Approach, Prentice Hall International Editions (1995)
7. ACKNOWLEDGEMENT This work is supported by the EU in the IST-programme Number 2001-35047. We thank the National Mapping Agency of the state Lower Saxony in Germany (LGN) for providing the ATKIS data.