Original Article
Journal of Biosystems Engineering
J. of Biosystems Eng. 39(1):47-56. (2014. 3) http://dx.doi.org/10.5307/JBE.2014.39.1.047
eISSN : 2234-1862 pISSN : 1738-1266
Spatial, Vertical, and Temporal Variability of Ambient Environments in Strawberry and Tomato Greenhouses in Winter Myong-Jin Ryu1, Dong-Ki Ryu1, Sun-Ok Chung1*, Yun-Kun Hur1, Seung-Oh Hur2, 2 2 3 Soon-Jung Hong , Je-Hoon Sung , Hak-Hun Kim 1
Department of Biosystems Machinery Engineering, Chungnam National University, Daejeon, Korea 2 Rural Development Administration, Gyeonggi-do, Korea 3 Chungnam Agriculture Research & Extension Services, Chungcheongnam-do, Korea Received: November 18th, 2013; Revised: February 8th, 2014; Accepted: February 19th, 2014
Purpose: In protected crop production facilities such as greenhouse and plant factory, farmers should be present and/or visit frequently to the production site for maintaining optimum environmental conditions and better production, which is time and labor consuming. Monitoring of environmental condition is highly important for optimum control of the conditions, and the condition is not uniform within the facility. Objectives of the paper were to investigate spatial and vertical variability in ambient environmental variables and to provide useful information for sensing and control of the environments. Methods: Experiments were conducted in a strawberry-growing greenhouse (greenhouse 1) and a cherry tomato-growing greenhouse (greenhouse 2). Selected ambient environmental variables for experiment in greenhouse 1 were air temperature and humidity, and in greenhouse 2, they were air temperature, humidity, PPFD (Photosynthetic Photon Flux Density), and CO2 concentration. Results: Considerable spatial, vertical, and temporal variability of the ambient environments were observed. In greenhouse 1, overall temperature increased from 12:00 to 14:00 and increased after that, while RH increased continuously during the experiments. Differences between the maximum and minimum temperature and RH values were greater when one of the side windows were open than those when both of the windows were closed. The location and height of the maximum and minimum measurements were also different. In greenhouse 2, differences between the maximum and minimum air temperatures at noon and sunset were greater when both windows were open. The maximum PPFD were observed at a 3-m height, close to the lighting source, and CO2 concentration in the crop growing regions. Conclusions: In this study, spatial, vertical, and temporal variability of ambient crop growing conditions in greenhouses was evaluated. And also the variability was affected by operation conditions such as window opening and heating. Results of the study would provide information for optimum monitoring and control of ambient greenhouse environments. Keywords: Ambient environment, Greenhouse, Monitoring, Variability
Introduction Protected crop production has advantages of stable and year-round production, and also controllable crop quality and yield. Ambient environmental factors affect crop growth and quality. Adams et al. (2001) compared tomato yield grown in four different temperatures of 14, 18, *Corresponding author: Sun-Ok Chung Tel: +82-42-821-6712; Fax: +82-42-823-6246 E-mail:
[email protected]
22, and 26°C for a 27-week growing season. Corresponding tomato weights were 18.3, 57.7, 51.3, and 23.9 g, respectively. Mortensen and Gislerod (2005) compared growth of the six-cut rose cultivar grown in 75% and 90% relative humidity (RH) levels, and found that the mildew was not detected in 90% RH and only minor infections were observed in 75% RH. Hirama et al. (2006) compared four species of cucumber growth in different temperature and RH conditions of 29°C, 70% RH and 25°C, 55% RH. Days of harvesting after planting were 0.7~2.6 days shorter in
Copyright ⓒ 2014 by The Korean Society for Agricultural Machinery This is an Open Access article distributed under the terms of the Creative Commons Attribution Non-Commercial License (http://creativecommons.org/licenses/by-nc/3.0) which permits unrestricted non-commercial use, distribution, and reproduction in any medium, provided the original work is properly cited.
Ryu et al. Spatial, Vertical, and Temporal Variability of Ambient Environments in Strawberry and Tomato Greenhouses in Winter Journal of Biosystems Engineering • Vol. 39, No. 1, 2014 • www.jbeng.org
the growing conditions with 29°C, 70% RH than with 25°C, 55% RH. Klaring et al. (2007) reported that CO2 supply of about 500 g/m2 using a control system in a greenhouse increased cucumber production by 37%, compared with the case of the greenhouse without additional CO2 supply. Farmers should be present and/or visit frequently to the production site to monitor, control, and maintain optimum environmental conditions. Recently, remote monitoring and control of the environmental conditions using internet or mobile devices have been reported and commercialized. For example, He et al. (2007) used code division multiple access (CDMA) wireless communication for web-based monitoring of temperature, RH, soil temperature, light intensity, and 4 images of an experimental maize field. Hwang et al. (2010) reported an environmental monitoring and control system for paprika greenhouse using sensor nodes with 2.4-GHz RF chips. Temperature, humidity, wind direction, wind speed, EC, pH, CO2, leaf temperature, plant body weight and height, fruit temperature and volume were monitored and the real-time changes in growth was captured by a CCTV. The developed system was tested through experiments using a test bed system and was installed in the paprika greenhouse. Study of measurement of agricultural atmospheric factors using ubiquitous sensor networks was conducted (Chang et al., 2011). Selected agricultural atmospheric factors were temperature, humidity and light intensity. And sensor network was designed by using ZigBex I and II. Sensor nodes were installed at height of about 2 m and 1.5 m from the ground in greenhouses and orchards, respectively. Measured value of the sensor nodes and the actual measured values did not differ significantly. Proper implementation and utilization of sensor technology is the most essential requirement for accurate monitoring the environmental factors in the protected crop production. Environment factors may show variability by location, direction, size and type of sensors, crops type, seeding rates, season, and time. Therefore, investigation of the variations is prerequisite to the accurate monitoring. Zhao et al. (2001) reported temperature difference between the top and the bottom of crop canopy, using 10 temperature sensors installed at different heights. In a pepper greenhouse with a total area of about 960 m2, the temperature difference was about 5°C in July when the crop height was about 2.7 m. Variations in environmental factors would be dependent also on ventilation methods. Soni et al. (2005) found a
48
vertical temperature difference caused by natural ventilation in four tomato-growing greenhouses at two plant growth stages (young and mature) from mid-April to late-June. The highest temperature was measured near the roof, and temperature difference between the roof and the coolest point was 5°C. Temperature gradients at the maturing stages were 14% higher than those at younger plant stages. Li and Willits (2008) studied vertical variations of air temperature and humidity in a 6.7 × 12.1 m2 fanventilated sweet pepper greenhouse. When measured at five heights (0.46, 0.94, 1.40, 1.84, and 2.32 m) on the ridge and furrow, vertical deviations of air temperature and humidity were 1.8°C and 10% with crops and 11.5°C and 12% without crops. The highest temperatures were predicted at the top of the canopies, and suggested that placing the sensor below the top of the canopy might be appropriate. Bojaca et al. (2009) compared variations of the temperature obtained at 30 points in a normal single‐ layer polyethylene greenhouse (PGH, 5100 m2) and 35 points in a single‐layer polyethylene greenhouse with automated roof ventilation (RPGH, 9792 m2). The difference between the maximum and minimum air temperatures were 3.2°C in PGH and 4.1°C in RPGH, respectively. Temperature of the greenhouse with automated roof ventilation resulted in greater variation. It was pointed out that measuring with only one sensor near the center of the greenhouse would overestimate the average temperature of the entire area. Tadj et al. (2010) investigated distribution of temperature and humidity in greenhouse by different heating methods. The experiments were performed in a tomato growing greenhouse of 8 × 20 m2 size, in which the heating pipes at the bottom and a heater at the upper were used for heating. In order to compare air velocity, air temperature, and RH by height, measurements were obtained at five heights (0.8, 1.0, 1.5, 2, 2.5 m), and 42 points and 21 points at 1 and 1.5 m heights. When heating pipes were used, temperature at the bottom of the greenhouse was the highest as 19°C and humidity of near the crops was the highest as 7%. When a heater was used, temperature at the upper area of the greenhouse was the highest as 26°C and humidity at the bottom was the highest as 14%. Effect analysis of natural ventilation according to ambient wind speed and direction was studied (Kwong et al., 2011). In the case of east roof open, west roof open, and both of the roofs open, internal air velocity distributions in greenhouse were in order of 0.075, 0.077, 0.082 m/s,
Ryu et al. Spatial, Vertical, and Temporal Variability of Ambient Environments in Strawberry and Tomato Greenhouses in Winter Journal of Biosystems Engineering • Vol. 39, No. 1, 2014 • www.jbeng.org
respectively. And, air temperature distributions in the greenhouse were confirmed at wind speeds of 0.5, 2.0, 3.0, 4.0 m/s. In case of 0.5 and 2.0 m/s, air temperature distributions were more stable. But, in case of wind speed greater than 2 m/s, air temperature distributions were unstable by forming of strong swirling flows. For optimum monitoring and control of environmental variables in a greenhouse, installation of sensors considering the variability would be preferable. Objectives of the paper were to measure spatial, vertical, and temporal variability in major ambient environmental variables in strawberry and tomato greenhouses in winter, and to provide basic data useful for monitoring and control of the ambient environments.
Materials and Methods Sensors and wireless communication devices Table 1 shows the selected ambient environmental variables (air temperature, air humidity, PPFD, and CO2 concentrations) and specifications of the sensors. Air temperature and air humidity were measured using temperature/humidity sensors (CIPCAP-L Sensor, General Electric Company Co. Inc., Niskayuna, NY, USA). CIPCAP-L sensor uses Integral PTAT (Proportional to Absolute Temperature) silicon transistor for temperature and capacitive polymer sensing technology for humidity. Photosynthetic photon flux density (PPFD) was measured by a quantum sensor (PPFD Sensor # 36681, Spectrum Technologies Inc., Plainfield, IL, USA) and CO2 was obtained with a NDIR (Non-dispersive Infrared) sensor (SH-300STH Sensor, SOHA TECH Co. Ltd., Nowon-gu, Seoul, Korea). A
wireless communication device (ZP24D-250RM-SR, B&B Electronics Co. Inc., Dayton, OH, USA) having a 2.4 GHz band with Zigbee protocol and Modbus protocol was selected in the study. The maximum communication distance between the two wireless communication devices was about 90 m.
Experimental methods Commercial sensors may not provide the same output even in the same environment. To verify the output from the sensor, output values from temperature/humidity sensors were compared at three different places: temperatures of 25, 15, 20°C and RH values of 55, 60, 70%, respectively. During the measurement, air flow was blocked to prevent the change of temperature and humidity. Measurements were obtained for 1 min with 3 replications at each condition. In order to measure the accurate distribution of ambient environment variables in the greenhouse, sensors should be stabilized in the changed condition. Based on the manufacturers’ manuals, response time of the light sensor was less than one min, and the CO2 sensor was less than 30 seconds. Temperature and humidity sensors take measurements in the state of heat balance with the objects, and contact sensors systematically would have some delay time (Kim and Kim, 2002). To determine response time of the temperature and humidity sensors that were not provided in the manufacturers’ manuals, a constant temperature & humidity chamber (HB-105SG, Hanbaek Co. Ltd., Bucheon, Gyenggi-do, Korea; Table 2) was used. Temperature/humidity sensors were first stabilized in temperature of 24±1°C and humidity of 40±1.5%, then placed inside of the chamber. Temperature and RH
Table 1. Selected environmental variables and specifications of the sensors used Variable
Temperature
Humidity
PPFD
CO2 concentration
Model
CIPCAP-L
CIPCAP-L
PPFD Sensor
Range
-55~150°C
0~100%
0~2,500 μmol·m ·s
0~3,000 ppm
Accuracy
±0.6°C
±2%
±5%
±2%
-2
SH-300STH -1
Table 2. Specifications of the constant temperature & humidity chamber Item
Specification
Temperature range
- 20 ~ 120°C
Humidity range
30 ~ 98%
Temperature accuracy
± 0.1°C at 37°C
Humidity accuracy
± 2% at 70%
49
Ryu et al. Spatial, Vertical, and Temporal Variability of Ambient Environments in Strawberry and Tomato Greenhouses in Winter Journal of Biosystems Engineering • Vol. 39, No. 1, 2014 • www.jbeng.org
2.5 m 2m 1.5 m
6m 6.5 m
Figure 1. Dimensions (left) and view (right) of greenhouse 1.
5m
5m
5m
50 m 10 m
10 m
10 m
Door
.5 m
5m
100m Measurement location of temperature and humidity at all times Measurement location of temperature and humidity at 12:00 and 14:00
Figure 2. Measurement locations of temperature and humidity in greenhouse 1.
settings of the chamber were 30, 40, 50, 60, 70, and 80°C at RH of 40%, and 50, 60, 70, and 80% at temperature of 24°C. All measurements were repeated three times. Field experiments were conducted in two greenhouses in winter (December 2011 and January 2012, Korea): strawberry-growing (Greenhouse 1) and cherry tomatogrowing (Greenhouse 2) facilities. Selection of the variety was based on that cultivated area of strawberries and tomatoes were second and fourth, respectively, of greenhouse crops in Korea (MFAFF, 2012). Dimensions of the greenhouse 1 (L, W, and H) were 100, 6.5 and 2.5 m, and the structure consisted of three layers (Figure 1). Both sides of the greenhouse 1 could be open with window opening motors, and an irrigation system was installed. Strawberries were planted before three weeks, and harvested at the one week after the experiments. The greenhouse 1 was oriented in the north-south direction and horizontal slope of the ground was about 5 degrees. Experiments were conducted from noon when the highest temperature was expected to sunset when the
50
greatest environmental change was expected, at two-hour intervals (12:00, 14:00, 16:00, and 18:00). Following farmers’ practice, the right side window was open at 12:00 and both windows were closed at other times. Measurement was started after 1 min stabilization period at each location, but all measurements at each experiment was done less than 30 min to minimize changes in the environmental conditions. Measurements were done at 0 and 0.5 m heights at the sides and up to 1 m in the middle of the greenhouse, and at 49 spatial locations over half or quarter of the area, assuming spatial symmetry of the environmental conditions (Figure 2). Dimensions of the cherry tomato greenhouse (L, W, and H) were 25, 7.5, and 4 m, and the structure consisted of 2 layers (Figure 3). Experiments were conducted on th 25 January, 2012. Both of the side windows could be open, an irrigation system using 4-line drip pipes was installed, and the temperature could be controlled at 17°C by a heater and thermal tunnel. Cherry tomato was planted two weeks before the experiments, and tomato
Ryu et al. Spatial, Vertical, and Temporal Variability of Ambient Environments in Strawberry and Tomato Greenhouses in Winter Journal of Biosystems Engineering • Vol. 39, No. 1, 2014 • www.jbeng.org
4m 3.5 m
7m 7.5 m
Figure 3. Dimensions (left) and view (right) of greenhouse 2.
5m
14 m 1.5 m 1.5 m 1.5 m 1.5 m 1.5 m 1.5 m
1.5 m D 1.5 m o 7.5 m or 1.5 m 1.5 m 25m Measurement location of temperature and humidity
Measurement location of luminous intensity
Measurement location of CO2 concentrations
Figure 4. Measurement locations of the environmental variables in greenhouse 2.
canopy height was about 30 cm. The greenhouse 2 was oriented in the north‐south direction and horizontal slope of the ground was less than 2 degrees. Durations of sensor stabilization and measurement were similar as in greenhouse 1. Experiments were performed at noon (12:00~14:00) and sunset (17:00~19:00). Measurement locations of temperature, humidity, PPFD, and CO2 concentration were illustrated in Figure 4. At each experiment, measurements were taken by window opening and heater operation: windows open, right window open, windows closed, window closed and heater operation. After the window and heater operation, 5 min stabilization period was considered. Measurement heights were 0, 1, 2, and 3 m in the middle and limited to 2 m at the side, and data were taken at 126 locations at each height for temperature and RH. PPFD and CO2 concentration were measured at 10 points and 14 points at the middle of the greenhouse by each sensor (Figure 4). Measurement at each location was done considering the response time of the sensor specified by the manufacturer’s manual, but
the total measurement time was less than 30 min for minimizing the change of environmental factors.
Results and Discussion Performance of the temperature and RH sensors Results of the calibration tests for the temperature and RH sensors were summarized in Tables 3 and 4. Temperature sensors provided outputs with no statistically significant difference, while one of the RH sensors gave greater values than others by 1.5%. The deviation was considered in later experiments. Response times due to changes in temperature and RH were shown in Figure 5. Generally, response to decrease was slower than that to increase in those factors. Within the experimental ranges, response times were 42 seconds for 6.4°C increase, and 169 seconds for 53.55°C increase, respectively. Average response time for 1°C increase was 51
Ryu et al. Spatial, Vertical, and Temporal Variability of Ambient Environments in Strawberry and Tomato Greenhouses in Winter Journal of Biosystems Engineering • Vol. 39, No. 1, 2014 • www.jbeng.org
Table 3. Results of calibration tests for the 7 temperature sensors (Unit : °C) Average and standard deviation
Replication number
a)
No. 2
No. 3
No. 4
No. 5
No. 6
No. 7
1
14.9 (0.1)
No.1 a)
15.1 (0.0)
15.0 (0.1)
14.9 (0.1)
15.1 (0.1)
15.1 (0.0)
15.1 (0.0)
2
20.3 (0.00)
20.6 (0.2)
20.5 (0.2)
20.1 (0.2)
20.1 (0.3)
20.1 (0.3)
20.3 (0.0)
3
25.2 (0.0)
25.1 (0.2)
25.0 (0.2)
25.2 (0.2)
25.1 (0.2)
25.2 (0.0)
25.2 (0.0)
Duncan’s grouping
Ab)
A
A
A
A
A
A
Values in the parentheses are standard deviations Groups with the same letter indicate no statistically significant different means
b)
Table 4. Results of calibration tests for the 7 relative humidity sensors (Unit : %) Average and standard deviation
Replication number
a) b)
No.1
No. 2 a)
No. 3
No. 4
No. 5
No. 6
No. 7
1
55.1 (0.0)
54.9 (0.1)
56.5 (0.1)
55.0 (0.1)
55.0 (0.1)
54.9 (0.1)
55.0 (0.1)
2
60.3 (0.2)
60.3 (0.2)
61.5 (0.2)
60.2 (0.2)
60.1 (0.1)
60.0 (0.2)
60.4 (0.2)
3
70.2 (0.1)
70.0 (0.2)
71.5 (0.2)
70.1 (0.2)
71.0 (0.2)
70.1 (0.3)
70.2 (0.2)
Duncan’s grouping
Ab)
A
B
A
A
A
A
Values in the parentheses are standard deviations Groups with the same letter indicate no statistically significant different means 07:12
05:46
Increase Decrease
Increase Decrease 04:19
Time, m:s
Time, m:s
05:46 04:19 02:53
02:53
01:26
01:26 00:00
00:00 0
10
20
30
40
50
Difference in air temperature, O C
60
10
15
20
25
30
35
40
Difference in relative humidity, %
45
Figure 5. Response times of the temperature and RH sensors.
considered as about 4 seconds. Similarly, average response time for 1°C decrease was about 12 seconds. In case of RH, response times for 41.3% increase and 41.5% decrease were 90 and 272 seconds, respectively. Average response times for 1% increase and 1% decrease were 3 and 7 seconds, respectively. These response times were considered for later experiments.
Variability of environmental variables in greenhouses Tables 5 and 6 show overall variability of temperature and RH in greenhouse 1 during the experiments. Average 52
temperature increased from 13.6°C at 12:00 to 17.7°C at 14:00 and decreased after that, while RH increased continuously until 18:00. In the experiment at 12:00 with the right window open, the maximum air temperature of 17.2°C was measured at the left middle location at a 0-m height, and the minimum temperature of 11.0°C was measured at the right front location at a 0.5-m height. RH was the highest (78.8%) at the left window part at a 0-m height, and the lowest (59.5%) at the right window part at a 0-m height. When both windows were closed (at 14:00), the maximum (19.3°C) and minimum (15.7°C) temperatures were obtained at the center at a 0.5-m
Ryu et al. Spatial, Vertical, and Temporal Variability of Ambient Environments in Strawberry and Tomato Greenhouses in Winter Journal of Biosystems Engineering • Vol. 39, No. 1, 2014 • www.jbeng.org
Table 5. Variability of the measured air temperature in greenhouse 1 (Unit: °C) Time
Average
Maximum
Minimum
Range
Std. Dev.
12:00
13.6
17.2
11.0
6.2
1.32
14:00
17.7
19.3
15.7
3.6
0.86
16:00
14.0
15.9
11.9
3.9
0.83
18:00
11.5
12.6
10.5
2.1
0.51
Table 6. Variability of the measured air RH in greenhouse 1 (Unit: %) Time
Average
Maximum
Minimum
Range
Std. Dev.
12:00
70.1
78.8
59.5
19.3
4.35
14:00
80.2
84.7
74.2
10.4
2.66
16:00
85.7
93.6
78.9
14.7
2.88
18:00
93.2
97.6
86.4
11.2
2.27
50
50
50
50
45
45
45
45
40
40
40
40
35
35
78
14.8 14.4
25
14
Distance, m
Distance, m
15.2 30
30
76 75 74
25
73
20
13.2
71
20
12.4
69
15
68
11.6
66
10
0
2
4
6
Distance, m
(a)
10.8
25
18
20
17.2 16.8
15
0
2
4
6
63
Distance, m
(b)
82 81 80
25
79 78 20
77 76 75
15
16.4 16
10
74 73
10
72
15.6
64 5
83 30
17.6
65
11.2 5
18.4
67
12 10
18.8
70
12.8 15
30
72
13.6
84
19.2
77
Distance, m
35
15.6
Distance, m
35
5
15.2 0
2
4
6
Distance, m
(c)
71 5
0
2
4
6
70
Distance, m
(d)
Figure 6. Spatial distribution of air temperature and humidity at a 0.5-m height in greenhouse 1 : (a) air temperature and (b) RH with the right side window open at 12:00, and (c) air temperature and (d) RH with the both windows closed at 14:00.
height and near the entrance at a 0-m height, respectively. RH was the lowest (74.2%) at the entrance at a 0-m height, and the highest (84.7%) at the center at a 1-m height. Differences between the maximum and minimum temperature and RH values were greater when one of the side windows were open than when both of the windows
were closed. Figure 6 shows spatial distribution of air temperature and RH at a 0.5-m height. Temperature and RH values were low at the right side due to ventilation at 12:00, while low at the both sides and high at the center at 14:00. These results indicated considerable variability of temperature and RH even within the single greenhouse
53
Ryu et al. Spatial, Vertical, and Temporal Variability of Ambient Environments in Strawberry and Tomato Greenhouses in Winter Journal of Biosystems Engineering • Vol. 39, No. 1, 2014 • www.jbeng.org
Table 7. Variability of the measured air temperature in greenhouse 2 (Unit: °C) Time
Noon
Sunset
Average
Maximum
Minimum
Range
Std. Dev.
Both windows open
8.2
10.6
7.1
3.5
0.87
Right window open
9.7
11.6
8.1
3.5
0.72
Both windows closed
11.6
12.9
10.7
2.1
0.47
After heater operation
17.4
18.9
15.7
3.2
0.92
Both windows open
7.7
9.3
6.9
2.4
0.80
Right window open
8.7
9.7
8.1
1.6
0.39
Both windows closed
8.4
8.8
7.9
0.9
0.19
After heater operation
14.7
15.5
13.3
2.2
0.64
Average
Maximum
Minimum
Range
Std. Dev.
Both windows open
72.6
79.7
63.5
16.2
3.82
Right window open
71.7
80.4
64.8
15.7
3.54
Table 8. Variability of the measured air RH in greenhouse 2 (Unit: %) Time
Noon
Sunset
Both windows closed
70.7
74.0
66.9
7.1
1.27
After heater operation
56.5
65.1
51.0
14.0
4.11
Both windows open
74.7
77.2
70.3
7.0
1.82
Right window open
76.1
79.3
72.4
6.9
1.51
Both windows closed
79.8
85.2
76.5
8.7
1.57
After heater operation
60.1
66.3
55.0
11.3
2.89
Table 9. Variability of the measured PPFD and CO2 concentration in greenhouse 2 Environment variable
Time
Average
Maximum
Minimum
Range
Std. Dev.
PPFD -2 -1 (Unit: μmol·m ·s )
Noon
1633.2
1661.0
1610.0
50.0
17.07
CO2 concentrations (Unit: ppm)
Sunset
61.0
90.0
50.0
40.0
12.26
Noon
176.0
180.7
173.3
7.3
2.62
Sunset
306.4
312.5
302.7
9.8
3.80
not only by time, but also by location and height. Tables 7 and 8 show the overall variability of air temperature and RH at noon and sunset in greenhouse 2. Comparing the air temperature and humidity at noon and sunset, the differences in the average of air temperature and humidity were 3.2°C and 9.1% with both windows closed and 0.5°C and 2.1% with both windows open. Differences between the maximum and minimum air temperatures at noon and sunset were greater when both windows were open. At noon, the maximum and minimum air temperatures were measured near the front center at a 0-m height and at the left side at a 2-m height, respectively, and the difference was 3.5°C. At sunset, the maximum and minimum air temperatures were measured at the center at a 0-m height and at the left side at a 1-m height, respectively, and the difference was 2.4°C. Difference between the maximum and minimum RH at 54
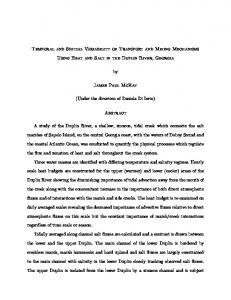
noon was greater when both windows were open. The maximum and minimum RHs were measured at the left side at a 1-m height and near the center at a 0-m height, respectively, and the difference was 16.2%. At sunset, the greatest variability was observed when the heater was operated (11.3%). Basic statistics of PPFD and CO2 concentration were listed in Table 9, and vertical maps were shown in Figures 7 and 8, respectively. Average and standard deviation of the PPFD were 1,633.2 and 17.07 1 μmol·m-2·s-1 at noon and 61.0 and 12.26 μmol·m-2·s-1 at sunset, respectively. The maximum values were observed at a 3-m height, close to the lighting source, for both cases. Average and standard deviation of CO2 concentration were 176.0 and 17.07 ppm at noon and 306.4 and 3.80 ppm at sunset, respectively, and the greatest values were observed in the crop growing regions.
Ryu et al. Spatial, Vertical, and Temporal Variability of Ambient Environments in Strawberry and Tomato Greenhouses in Winter Journal of Biosystems Engineering • Vol. 39, No. 1, 2014 • www.jbeng.org
Figure 7. Variability of PPFD at noon (left) and sunset (right).
Figure 8. Variability of CO2 concentration at noon (left) and sunset (right).
For monitoring and control of ambient environments in greenhouses, variability of the variables should be considered. Greater number of sensors would be better for monitoring environmental conditions when there were greater variability, but it would increase cost. As vertical location, the height near the crop canopy would be the best for PPFD and CO2 concentration, and need to be variable as crops grow. For temperature and RH sensors, either close to the ground surface, half or height of crop canopy need to be considered. Determination of spatial locations of the sensors should consider variability (average, maximum, and minimum values), and also locations of components such as window, heater, and cooler. Candidates for sensor installation would be center and/or sides where windows and entrance gates are located. Criteria of sensor location would be also different. For example, lowest temperature would be important when heating is necessary during winter seasons, and highest temperature would be considered for cooling or ventilation operation.
Summary and Conclusions This study was conducted to measure and analyze the variation of air temperature, humidity, PPFD, and CO2 concentration in greenhouses. Experiments were conducted in two greenhouses using different specifications, equipments,
and crops. The major results are as follows. (1) Prior to the measurements in greenhouses, sensor accuracy and response time were validated. Time for sensor stability was secured (i.e., one min) for each measurement. (2) In greenhouse 1, overall temperature increased from 12:00 to 14:00 and increased after that, while RH increased continuously during the experiments. Differences between the maximum and minimum temperature and RH values were greater when one of the side windows were open than when both of the windows were closed. The location and height of the maximum and minimum measurements were also different. (3) In greenhouse 2, air temperature and RH changed considerably by time, height, and location, and differences between the maximum and minimum air temperatures at noon and sunset were greater when both windows were open. PPF and CO2 concentration also showed variation by time, height, and location. The maximum PPF values were observed at a 3-m height, close to the lighting source, and CO2 concentration in the crop growing regions. This result would provide basic data useful to monitor and control ambient environment in the future.
55
Ryu et al. Spatial, Vertical, and Temporal Variability of Ambient Environments in Strawberry and Tomato Greenhouses in Winter Journal of Biosystems Engineering • Vol. 39, No. 1, 2014 • www.jbeng.org
Conflict of Interest The authors have no conflicting financial or other interests.
Acknowledgement This work was supported by research fund of Chungnam National University.
References Adams, S. R., K. E. Cockshull and C. R. J. Cave. 2001. Effect of temperature on the growth and development of tomato fruits. Annals of Botany 88:869-877. Bojaca, C. R., R. Gil, S. Gomez, A. Cooman and E. Schrevens. 2009. Analysis of greenhouse air temperature distribution using geostatistical methods. Transactions of the ASABE 52(3):957-968. Chang, Y. C., S. O. Chung, I. S. Han and K. M. Noh. 2011. Measurement of agricultural atmospheric factors using ubiquitous sensor network - temperature, humidity and light intensity -. Journal of Biosystems Engineering 36(2):122-129 (in Korean). He, D., Y. Bai and P. Yang. 2007. Agricultural remote monitoring systems based on web-server-embedded technology and CDMA service. New Zealand Journal of Agricultural Research 50:1393-1397. Hirama, N., H. Mizusawa, F. Azuhata and S. Matsuura. 2006. Effects of forenoon temperatures in ventilated greenhouse on the growth of forced and fall-cropped cucumber cultivars. Journal of the Japanese Society for Horticultural Science 75(4):331-333.
56
Hwang, J., C. Shin and H. Yoe. 2010. A wireless sensor network-based ubiquitous paprika growth management system. Sensors 10:11566-11589. Kim, W. H and J. S. Kim. 2002. Sensor engineering for automation. Seoul, Republic of Korea: Sungandang. Klaring, H. P., C. Hauschild, A. Beibner and B. B. Yosef. 2007. Model-based control of CO2 concentration in greenhouses at ambient levels increases cucumber yield. Agricultural and Forest Meteorology 143:208-216. Kwong, J. K., S. H. Lee, J. H. Seong, J. P. Moon, S. J. Lee, B. M. Choi and K. J. Kim. 2011. Analysis of natural ventilation characteristics of venlo-type greenhouse with continuous roof vents. Journal of Biosystems Engineering 36(6): 444-452 (in Korean). Li, S and D. H. Willits. Modeling thermal stratification in fan-ventilated greenhouses. 2008. Transactions of the ASABE 51(5):1735-1746. MFAFF. 2012. Food, Agriculture, Forestry and Fisheries Statistical Yearbook. Ministry for Food, Agriculture, Forestry and Fisheries, Gwacheon, Korea. Mortensen, L. M and H. R. Gislerod. 2005. Effect of air humidity variation on powdery mildew and keeping quality of cut roses. Scientia Horticulturae 104:49-55. Soni, P., V. M. Salokhe and H. J. Tantau. 2005. Effect of screen mesh size on vertical temperature distribution in naturally ventilated tropical greenhouses. Biosystems Engineering 92(4):469-482. Tadj, N., T. Bartzanas, D. Fidaros, B. Draoui and C. Kittas. 2010. Influence of heating system on greenhouse microclimate distribution. Transactions of the ASABE 53(1):225-238. Zhao, Y., M. Teitel and M. Barak. 2001. Vertical temperature and humidity gradients in a naturally ventilated greenhouse. Journal of Agricultural Engineering Research 78(4):431-436.