Jul 15, 2015 - image processing, spatial analysis, and image data mining. In addition to image .... data used in the experiment were all downloaded free of charge from two ... For image classification, we used eCognition software, and for.
ISPRS Annals of the Photogrammetry, Remote Sensing and Spatial Information Sciences, Volume II-4/W2, 2015 International Workshop on Spatiotemporal Computing, 13–15 July 2015, Fairfax, Virginia, USA
Spatiotemporal Mining of Time-Series Remote Sensing Images Based on Sequential Pattern Mining H. C. Liu a, b, G. J. He a, *, X. M. Zhang a, b, W. Jiang a, b, S. G. Ling a, b a
Institute of Remote Sensing and Digital Earth, Chinese Academy of Sciences, Beijing 100094, China – (hcliu, gjhe, xmzhang, weijiang, sgling) @ceode.ac.cn b University of Chinese Academy of Sciences, Beijing 100049, China
KEY WORDS: Remote Sensing, Satellite Image, Time Series, Data Mining, Sequential Pattern Mining, Land Cover Change
ABSTRACT: With the continuous development of satellite techniques, it is now possible to acquire a regular series of images concerning a given geographical zone with both high accuracy and low cost. Research on how best to effectively process huge volumes of observational data obtained on different dates for a specific geographical zone, and to exploit the valuable information regarding land cover contained in these images has received increasing interest from the remote sensing community. In contrast to traditional land cover change measures using pair-wise comparisons that emphasize the compositional or configurational changes between dates, this research focuses on the analysis of the temporal sequence of land cover dynamics, which refers to the succession of land cover types for a given area over more than two observational periods. Using a time series of classified Landsat images, ranging from 2006 to 2011, a sequential pattern mining method was extended to this spatiotemporal context to extract sets of connected pixels sharing similar temporal evolutions. The resultant sequential patterns could be selected (or not) based on the range of support values. These selected patterns were used to explore the spatial compositions and temporal evolutions of land cover change within the study region. Experimental results showed that continuous patterns that represent consistent land cover over time appeared as quite homogeneous zones, which agreed with our domain knowledge. Discontinuous patterns that represent land cover change trajectories were dominated by the transition from vegetation to bare land, especially during 2009–2010. This approach quantified land cover changes in terms of the percentage area affected and mapped the spatial distribution of these changes. Sequential pattern mining has been used for string mining or itemset mining in transactions analysis. The expected novel significance of this study is the generalization of the application of the sequential pattern mining method for capturing the spatial variability of landscape patterns, and their trajectories of change, to reveal information regarding process regularities with satellite imagery.
1. INTRODUCTION Land use and land cover change are becoming increasingly recognized as important drivers of global environmental change (Turner et al., 2007). The characteristics of land cover can have important effects on the local climate, radiation balance, biogeochemistry, hydrology, and the diversity and abundance of terrestrial species (Randerson et al., 2006). Therefore, the study of land cover change is an important problem within the geoscience domain. Advances in earth observation technologies have led to the acquisition of vast volumes of accurate, timely, and reliable environmental data, which encompass wideranging information about the earth’s land, ocean, and atmosphere (Karpatne et al., 2013). Remote sensing imagery consisting of satellite-based observations of the land surface, biosphere, solid earth, atmosphere, and oceans, combined with historical climate records and predictions from ecosystem models, offer new opportunities for understanding how the earth is changing, determining the factors causing these changes, and predicting future changes (Boriah et al., 2009). Therefore, remote sensing satellite imagery has emerged as the most useful data source for characterizing and quantitatively measuring landscape-scale land cover changes (Hudak and Wessman, 1998). Detecting and characterizing change over time is the natural first step towards identifying the drivers of the change and
understanding the change mechanism (Verbesselt et al., 2010). Satellite remote sensing has long been used as a means of detecting and classifying temporal changes in the condition of the land surface (Coppin et al., 2004; Lu et al., 2004). Satellite sensors are well suited to this task because they provide consistent and repeatable measurements on a spatial scale appropriate for capturing the processes of change (Jin and Sader, 2006). A given scene may be observed repeatedly from space, resulting in a times series of satellite images. The high spatial resolution of current sensors provides detailed information on spatial structures, which after a series of revisits, can be extended to spatiotemporal data structures. It follows that a time series of satellite images represents a highly complex data set that potentially contains valuable spatiotemporal information (Gueguen and Datcu, 2007). Although the value of remotely sensed long-term data sets to change detection has been firmly established (De Beurs and Henebry, 2005), only a limited number of time-series changedetection methods have been developed. Most previous changedetection studies have relied primarily on examining the differences between two or more satellite images acquired on different dates (Boriah, 2010). These procedures can be categorized into three types. Procedures of the first category identify simple proportional differences of certain classes within a certain area between two points in time without being spatially explicit (Godoy and Contreras, 2001; Sierra, 2000).
* Corresponding author
This contribution has been peer-reviewed. The double-blind peer-review was conducted on the basis of the full paper. doi:10.5194/isprsannals-II-4-W2-111-2015 111
ISPRS Annals of the Photogrammetry, Remote Sensing and Spatial Information Sciences, Volume II-4/W2, 2015 International Workshop on Spatiotemporal Computing, 13–15 July 2015, Fairfax, Virginia, USA
The second category procedures involve the calculation of annual rates of change between end-member periods (Lambin and Ehrlich, 1997; Puyravaud, 2003). Methods in the third category quantify changes in the spatial configuration and composition of land cover on multiple dates using pair-wise comparisons (Mertens and Lambin, 2000; Schneider, 2012). One limitation of these methods is the inadequacy of detailed observation and discrimination of the process of land cover change. Actually, temporally, the change process of land cover types can be viewed as a trajectory, which highlights the dynamic character of change (Petit et al., 2001). By analyzing change trajectories, we can investigate the detailed dynamics of change processes (i.e., sequences of successive changes in land cover types). However, such methods used for analyzing change trajectories can usually be found for use with green cover; for example, vegetation (Cai and Wang, 2010), cropland (Liu et al., 2005), forest land (Chen et al., 2012; Gimmi et al., 2010; Kennedy et al., 2007; Lambert et al., 2011), and grassland (Dubinin et al., 2010; Dusseux et al., 2011) research. These methods are rarely applied in the change analysis of other land cover types. Therefore, there is an urgent need for a new universal technique for transforming remote sensing data into information on the patterns and processes of land cover change. The effective use of a satellite image time series to characterize and monitor land cover change trajectories requires the analysis of temporal variations in spatial patterns (Henebry and Goodin, 2002). When analyzing a sequence of items, one basic problem to be addressed is to find frequent episodes (Mannila and Toivonen, 1996.), or in other words, to extract regular patterns from temporal data. Therefore, there is a critical need for a method that can enable efficient and reliable characterization of spatiotemporal patterns contained in an image time series (Henebry and Goodin, 2002). Mining sequential and spatial patterns is an active area of research in artificial intelligence (Le Ber et al., 2006), and it has been used for string mining or itemset mining in transactions analysis. The objective of this study is the generalization of the application of the sequential pattern mining method for capturing the spatial variability of landscape and their temporal trajectories of change, to reveal information regarding process regularities with satellite imagery. In this study, a sequence of repeated satellite images of the same scene was used to establish the land cover change sequence set, and a typical sequence mining algorithm—the Continuous Association Rule Mining Algorithm (CARMA)— used on this sequence set to analyze the land cover change in the form of change patterns. This article is organized as follows. Section 1 discussed the significance of land cover change and introduced the objectives of this study. Section 2 covers the sequential pattern mining method and Section 3 presents a case study and an analysis of the results. Finally, Section 4 discusses the principal findings and offers our conclusions.
2. METHODOLOGY The methodology used in this study includes remote sensing image processing, spatial analysis, and image data mining. In addition to image pre-processing and remote sensing image classification, a sequential pattern mining method is applied in the analysis of land cover change, which forms the main part of the research. Therefore, in this section, the sequential pattern mining method based on the CARMA algorithm is introduced. First, some basic concepts of pattern mining are provided in
Section 2.1, followed by an introduction to the CARMA algorithm in Section 2.2. 2.1 Basic concepts Let I = {I1,I2,…,Ip} be the set of all items; a set of items is referred to as an itemset and a sequence is an ordered set of one or more itemsets. For example, in a sequence s = , itemset e1 shows before e2, and e2 shows before e3, and so on. Itemset ej is also an element of the sequence s denoted as (x1,x2,…,xq) in which xq ∈ I . A sequence that contains k itemsets is a k-sequence. If there exists 1 ≤ i1 < i2 maxSupport(v) for some superset w of v. Thus, we set maxMissed(w) = Count(v) – Count(w) for all supersets w of v with maxSupport(w) > maxSupport(v). We also remove the itemsets v from V with maxSupport < σn. From all the above, it is clear that CARMA only requires two scans of the sequences to obtain the sequential pattern. 2.3 Data
Figure 1. Scan of the equence database First, we initialize V to {ø} and set Count(ø) = 0, firstTrans(ø) = 0, and maxmissed(ø) = 0. Thus, V is a support lattice for an empty sequence. Suppose V is a support lattice up to sequence i-1, we are reading the i-th sequence ti, and we want to transform V into a support lattice up to i; there are three steps to go through. First, for each itemset v in V, if v is contained in ti, let Count(v) = Count(v) + 1.We insert a subset v of ti into V, if and only if all subsets w of v are already contained in V and satisfy maxSupport(w) ≥ σi (where σi is the current user defined support threshold). As v is contained in the current sequence ti, let Count(v) = 1, firstTrans(v) = i, and we compute the value of maxMissed(v). As w is a subset of v, we obtain maxSupport(w) ≥ maxSupport(v). Second, for maxSupport(w) = [maxMissed(w) + Count(w)]/i, maxSupport(v) = [maxMissed(v) = Count(v)]/i and Count(v) = 1; therefore, we obtain maxMissed(v) ≤ maxMissed(w) + Count(w) - 1. When we are inserting a subset v into V, the set v is not yet contained in V. Hence, the support of v for the first (i-1) sequences satisfies v −1 supporti-1(v) ≤ avg i -1 ( ⎡σ ⎤ i −1 ) + , where v means the i −1 number of items in v. In addition, considering maxMissed(v) = supporti-1(v) × (i – 1), we obtain maxMissed(v) ≤ ⎣(i − 1)avg i −1 (⎡σ ⎤ i −1 )⎦ + v − 1 . Based on all of the
above,
{
we
can
define
A time series of Landsat TM images, path 123/row 32, for 2006–2011 were selected as the data source (Table 2). The chosen acquisition time was June–July; this corresponds to the spring and summer for most areas in northern China, which are the best seasons for analyses of land cover change. Satellite data used in the experiment were all downloaded free of charge from two websites, http://ids.ceode.ac.cn/ and http://glovis.usgs.gov/. Image data I II III IV V VI
Acquisition date 7.12.2006 5.28.2007 5.30.2008 7.20.2009 6.5.2010 6.8.2011
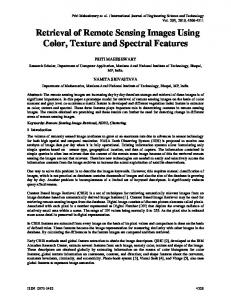
Table 2. Acquisition time of the six Landsat TM images used in the experiment As cloud and fog can seriously affect the results of the mining, we chose the northern part of Beijing as the study area, which was clear in all six images (Figure 2).
that }.
max Missed(v) = min ⎣(i − 1)avg i −1 (⎡σ ⎤ i −1 )⎦ + v − 1, maxMissed(w) + count(w)-1 w ⊂ v
And third, We compute maxSupport = (maxMissed + Count)/i for each itemset v of V when every k sequences (the value of k is defined by the user) are scanned. For any itemset v whose maxSupport < σi, we delete v from V. 2.2.2
Second part of CARMA
For the second step, the main aim is to scan the sequences a second time and generate sequential patterns based on the frequent sequences found in the first part of CARMA. In the second step, we compute the precise support of all itemsets v in V and continually remove itemsets with maxSupport < σn where σn is the last threshold of minSupport. While performing the scanning, all itemsets v of V are checked and the parameters associated with v updated. Two situations may arise:first, if firstTrans(v) < i, then v is considered as a large itemset. If the current sequence index is past firstTrans for all itemsets in the lattice, the second part of the CARMA algorithm stops. And second, if the current sequence contains itemset v of V, we set
Figure 2. Overview of study area, (a) location of Beijing within the People's Republic of China, (b) location of the study area within Beijing 2.4 Experimental Procedure For the rational and effective analysis of land cover changes, after the image pre-processing, we firstly classified the six timeseries images of the study area into land cover maps. Secondly, based on the land cover map, we constructed the image sequence set within which each sequence is a land cover class trajectory at pixel level that is described through the classified images assembled in the time series. Thirdly, we applied the sequential pattern mining algorithm to the image sequence set to search for sequential patterns. Finally, we analyzed some interesting sequential patterns to reveal the trajectory of land cover change and evaluated the degree of change. The flowchart of the experimental procedure is shown in Figure 3.
This contribution has been peer-reviewed. The double-blind peer-review was conducted on the basis of the full paper. doi:10.5194/isprsannals-II-4-W2-111-2015 113
ISPRS Annals of the Photogrammetry, Remote Sensing and Spatial Information Sciences, Volume II-4/W2, 2015 International Workshop on Spatiotemporal Computing, 13–15 July 2015, Fairfax, Virginia, USA
Figure 3. The flowchart of the experimental procedure 2.5 Pre-processing and classification The pre-processing steps included atmospheric correction, geometric correction, and data format conversion. Landsat TM image from 2011, obtained from the United States Geological Survey, is orthorectified and therefore, it was selected as the master or reference data for geometric correction. Ground control points were collected from the reference image for rectifying the remaining images from 2006 to 2010 (i.e., relative registration) (Kennedy and Cohen, 2003). In this paper, the Gauss-Kruger projection was used in the geometric correction, and a minimum of 20 evenly distributed ground control points were selected to ensure geometric precision of 0.5 pixel (