make the pass/fail decision. This paper is organized as follows: In Section 2, we de- scribe the circuit model and define the terms that will be used throughout the ...
Specification Back-Propagation and Its Application to DC Fault Simulation for Analog/Mixed-Signal Circuits Jiun-Lang Huang, Chen-Yang Pan, and Kwang-Ting Cheng Department of Electrical and Computer Engineering University of California, Santa Barbara
Abstract In this paper we present the specification backpropagation technique which enables one to derive the constraint of an internal functional block with respect to a given DC specification for an analog/mixed-signal system. Based on this technique, we implement an efficient fault simulator which reduces the required efforts by (1) removing undetectable faults from the fault list, and (2) performing fault simulation only locally for the faulty block. Simulation results on an industrial design show a speedup factor of 7.2 with 98% correct classification of detected and undetected faults as compared with full-chip DC fault simulation.
1. Introduction Fault simulation for analog/mixed-signal systems has been a difficult task because the process is still primarily based on transistor-level, full-circuit, serial fault simulation techniques. Recently, fault simulation schemes based on macro-models have been proposed [6, 7, 8, 9, 1, 12] to reduce the simulation cost. However, it remains challenging to derive accurate macro-models/fault macro-models with high simulation efficiency. In [13], the authors use simulation-based methods for fault modeling and assume that the specifications for each level of design hierarchy are available to propagate the fault effects to higher design levels. The works in [8, 1, 12] address fault simulation for linear, time-invariant analog circuits. In [6, 7, 9], the effectiveness of macro-level simulation is demonstrated but algorithms for deriving the macro-models are not discussed. The works in [4, 11, 5] attempt to perform fault simulation by function mapping. However, derivation of an accurate mapping function cannot always be guaranteed. Fault simulation based on sensitivity analysis is proposed in [10, 2]. But, it is not clear whether this technique can be applied to faults causing large deviations. The concurrent fault simula�
Chen-Yang Pan is currently with LSI Logic Corporation, Milpitas, CA 95035, USA
tor in [3] improves fault simulation efficiency by exploring the similarity between faulty netlists. In this work, we employ the specification backpropagation technique to speed up the fault simulation efficiency for analog/mixed-signal systems. For an analog/mixed-signal system that is built hierarchically with functional blocks, the technique is intended to derive the constraint associated with each functional block with respect to the given system specification. Depending on the circuit topology, the derived constraint for each block is either a necessary and sufficient condition on its output values or a sufficient condition on its I/O behavior. If any block fails the constraint derived for it, the system will indeed fails its specification at primary outputs. Because the derived constraints give more insight into how each block should behave for the system to meet its specification, they can be helpful in areas like design optimization, yield optimization, and fault simulation. In this paper, we will address the application of this technique to fault simulation. The derived constraints allow one to improve the fault simulation efficiency by (1) removing from the fault list the faults that cannot be detected by identifying idle blocks, and (2) employing single-block instead of full-chip fault simulation to make the pass/fail decision. This paper is organized as follows: In Section 2, we describe the circuit model and define the terms that will be used throughout the paper. Section 3 illustrates the specification back-propagation algorithm. Then, we show the fault simulation process in Section 4. Simulation results of an industrial mix-signal circuit design are shown in Section 5. In Section 6, we conclude the work and describe the direction of our future work.
2. Preliminaries In this work, we model a mixed-signal design built upon functional blocks together with the inter-block signals that connect them as a directed graph in which (1) each vertex corresponds to a functional block, and (2) each directed arc represents the signal flow from a driving block to a driven
Localize global feedback v2
VBIAS2 vref
VBIAS1
v1
REF
p p2 n2
iref
d
DIFF n MUX
VBIAS2 v22 REF
i1
OUT
vout
i2 DIFF
v12
d
VBIAS1 n
sel
(a) Block diagram
i1 IBIAS
v21
v11
IBIAS i2
p1 n1
vr
Next block? OUT
p MUX
(b) Circuit graph
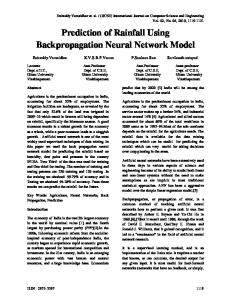
Figure 1. The circuit model block. When the circuit contains no block-level global feedback, its circuit graph is a directed acyclic graph (DAG). The exemplar circuit in Fig. 1(a) consists of seven functional blocks and its circuit graph is shown in Fig. 1(b). Notice that there are two incarnations of the signal ��� , i.e., ����� and ����� , in the circuit graph, which reflects the fact that ��� drives two blocks, D IFF and V BIAS 2. For each block, we make the assumption that the change of the value of one of its input signals will have no or negligible effects on the other input signals. For example, the � value of signal � should remain the same when one drives with an independent source whose value is different from ’s original value. For ease of description and to avoid confusion, we use the following terms in the following discussion: (1) A configuration of a set of signals is the assignment of values � � ����� to ����� each of the signal in the set, e.g., � �� �� �� ����� � �! is a configuration for the signal set � . (2) Two signals are independent if their fanin cone do not overlap. (3) A block P is the dominating block of another block Q if all the outgoing signal flow from Q merges at P. (4) For block A, the loading (driving) network associated with its input (output) terminal " is a network that mimics A’s i-v characteristic at " and is the load (source) experienced by " ’s driving (driven) block(s).
3. Specification back-propagation In general, a system specification defines the acceptable primary output configurations but gives no information about how each block should behave when the test stimulus is applied. However, for design optimization or fault simulation purpose, one may be interested in the corresponding specification associated with each internal block, which is useful in that it provides further insight into the circuit behavior than the system specification itself: (1) If a block has very strict output constraint, the system will be very sensitive to its performance variation. Redesign of the block itself or its neighboring blocks may help improve the yield. (2) For fault simulation point of view, if one has the specification of each functional block, one will be able to make
no
yes
Next f.back macro?
no
End
yes
Derive O/P spec.
Derive acceptable outputs
Derive I/O transfer table
Derive possible inputs
Derive loading network
Save I/O constraint
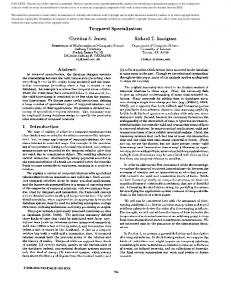
Figure 2. Spec. back-propagation
the pass/fail decision without full-circuit fault simulation. (3) The obtained information can be utilized in controllability and observability analysis which is crucial for the implementation of an efficient test pattern generator. In this work, we will address the application of this technique to fault simulation.
3.1. The algorithm flow The main idea of specification back-propagation is to derive the specification of a block from that of its nearest dominating block, i.e., the dominating block with the smallest topological order, instead of from the system specification. Depending on whether a block is involved in global feedback or not, its output or I/O specification will be derived. Fig. 2 illustrates the algorithm flow of the specification back-propagation process. First, we merge blocks involved in the same feedback into a macro block (“Localize global feedback”) and thus transform the circuit graph into a DAG. For example, blocks C, D, and E in Fig. 3(a) are merged into a macro block M #%$'& , and the resulting DAG is shown in Fig. 3(b). Derivation of the output specification (“Derive O/P spec.”) is performed on each vertex in the DAG in descending topological order to ensure that we derive the O/P specification of a vertex only when the I/O transfer tables (“Derive I/O transfer table”) and loading network (“Derive loading network”) are available for each vertex in its fanout cone. At last, we use the derived output specification for each macro block, e.g., M #%$'& , to derive the I/O specification for its comprising blocks, e.g., C, D, and E (the shaded block). Deriving output specification. To derive the output specification for a block (or macro block) T, we first generate a set of output configurations (*) in the following ��-/way: . � For each output signal ",+ of T, we evenly sample
� " + points with separation 0,+2143 � centered at ’s nominal � � � � � �!�!� ��+ 5 ���!� � +: , value ��+ 5 and obtain 67+ � � �9+ 8;: �9+ 8 :=
+ < ? �,> + � 0 + ? ? � . Then, � � � ( ) � �G ��� ��� �!��� �!H�I KJ � +ML 6 + , where N ) is number of output signals of T. ( ) is then propagated (utilizing I/O transfer tables) to T’s nearest dominating block O , and whether a configuration in ( ) passes or fails D’s output specification is recorded. The region in T’s output space that’s enclosed by the output configurations in ( ) that satisfy D’s output specification is the derived output specification of T. Because the derived specification will be backpropagated, its accuracy has direct impact on that of T’s � proceeding blocks. Let P N + and PRQGST+ be the minimal and maximal values of signal "�+ in the derived specification, � we require that for each output signal "�+ , �U+ 8;: V P N + , � : 12PRQ9SW+ , and there be at least fifty sample points within + � the range enclosed by P N + and PRQGST+ . The process is finished if both criteria are satisfied; otherwise, we update ( ) by enlarging the sampling range of " + and/or by reducing the value of 0 + . Deriving I/O transfer tables. The I/O transfer tables store the I/O relationships of a block when loaded by its succeeding blocks. First, the target block T’s input signals are divided into independent sets such that two signals are in the same set (different sets) if they are not independent of (independent of) each other. Then, we perform DC sweep analysis for each independent input set to obtain the corresponding I/O transfer table (with all other inputs at nominal values). Similar to “Derive O/P spec.”, we use two criteria to check if the sweep setup is appropriate: (1) the outputs of the DC sweep analysis should cover T’s output specification, and (2) for each swept signal " , when all other swept signals are fixed at their nominal values, at least fifty of the sample points of " will satisfy T’s output specification. If both criteria are satisfied, we proceed to next independent set; otherwise, we update the DC analysis setup by enlarging the sweep range and/or decreasing the step size. It should be noted that (1) the I/O transfer tables for input signal combinations other than those independent input sets are not needed because we only vary the output configuration of the target block in “Derive O/P specification” and two independent signals won’t be affected at the same time by the change of a single block, and (2) in addition to the
+ Vd -
I
Ii2
IBIAS
OUT R
I = 29.57 A R R = 7.27M
I = 2.66 A R = 2.96M
(a) Loading network
+ I
Vi2 -
(b) Driving network
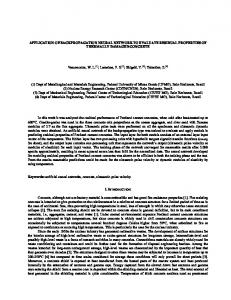
Figure 4. The loading and driving network output configuration, we also record the voltage at/current through each swept signal for deriving loading networks in next stage. Deriving loading network. For each block A, we have (from the previous stage) an i-v characteristic table for each independent set of inputs. The i-v characteristic of input signal " of A is extracted from the table corresponding to the independent input set that contains " by fixing all other inputs at their nominal values. The i-v characteristic is approximated by first-order regression, and, depending on the signal type of " , is modeled by:
X
.[Z]\ �
Y" '� Q ^ " . Z]\ � � ^" _� Q M
Y"
current signal
X
�
voltage signal
(1) (2)
The loading network corresponding to Eq. 1 and Eq. 2 can be implemented by an independent source and a resistor. For example, the i-v characteristic of the input terminal of O UT in Fig. 1(a) is approximated by:
�Y` �
�
��a�ab�
. � `�c � � � a�P
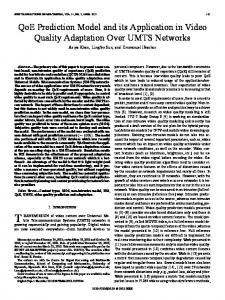
and the corresponding loading network is shown in Fig. 4(a). Global feedback. As discussed earlier, deriving output specification requires that one be able to propagate the output configuration of a block to its nearest dominating block, which is not possible for a block involved in global feedback because its output configuration will be propagated to its input terminals and then in turn changes its output configuration! For a block that’s involved in global feedback, we propose to derive the sufficient condition on its I/O transfer characteristics. Let’s use the macro M #d$'& (Fig. 3(b)) to illustrate how the sufficient I/O specification on the blocks involved in global feedback is derived. Fig. 5 plots the trajectory of �� D’s output configuration � � when one varies its input e from e + H to e : :gf�h (D is loaded by its succeeding block, E, and this is an open loop configuration since we drive O with an independent source). It can be observed that (1) The � derived output specification of M #d$'& (a constraint on ) defines the set of acceptable output configurations for C since the system specification will not be satisfied if C’s
d1
acceptable O/P of C
cmax Spec. back-propagation
Next fault?
no
End
yes
O/P spec. of MCDE
Identify idle blocks
no
Faulty blk .OP
Feedback? Pass/Fail
yes
Suff. cond.
Derive driving networks
cmin possible i/p of E
d2
Unknown Faulty macro .OP Single-block fault simulation
Figure 5. Feedback loop
Figure 6. The fault simulation process
output configuration falls outside the derived output specification of M #d$'& . (2) The part of the trajectory whose projection on the � axis falls in the set of C’s acceptable output configurations (the bold segments) defines the set of acceptable output configurations (a constraint on e ) of C. (3) The projection of the bold segments on the � axis defines the set of possible input configurations of E when M #%$'& ’s output specification is satisfied. The steps for deriving the sets of possible input and acceptable output configurations for the blocks in a macro block M are summarized as: (1) Merge all the blocks in M whose output signals are involved in M’s output specification into a single block O. (2) M’s output specification defines the set of acceptable output configurations of O. (3) For each block driven by O, its possible input configurations is the projection of O’s acceptable output configurations on its input signals from O. (4) Remove each signal " from O to other blocks in M, drive the driven block by the nominal value of " and load O with the loading network of the driven block to obtain the open-loop configuration of M. (5) Backpropagate O’s acceptable output configurations in the openloop configuration to obtain those for the other blocks in M. (6) Forward-propagate the possible input configurations obtained in (3) in the open-loop configuration to obtain those of other blocks. The derived configurations can be used as a sufficient condition to make the pass/fail decision: A block involved in global feedback will pass/fail the output specification of the macro block that contains it if all the output configurations corresponding to its possible input configurations fall inside/outside its acceptable output configurations.
detected by the given system specification from the fault list (“Identify idle blocks”). To facilitate single-block fault simulation, we derive the driving network (discussed latter) of each block (“Derive driving networks”). The single-block fault simulation technique is then applied to each fault in the fault list to make the pass/fail decision. Identifying the idle blocks. Due to the trend of integrating various functionality or even different standards into IC’s, it is common that some functional blocks are operating only at certain modes. One example is the BIST circuitry that affects the system functionality only in the test mode. We call the blocks of which the outputs will not affect the primary outputs of concern, i.e., the ones that are involved in the specification under consideration, the idle blocks. To decide whether a block is idle or not, we need to know what output configuration it may have at the existence of a fault. An example is that voltage signals are in general bounded by the values of positive and negative power supplies. If the output specification of a block covers its entire possible output configurations, i.e., there is no constraint at the outputs of the block, the block is classified idle. Deriving driving network The i-v characteristic required for deriving driving network associated with output signal " of block A is obtained by varying the current through (voltage at) " if " is a voltage (current) signal and measuring the voltage at (current through) " which requires one DC sweep analysis. Then, similar to deriving loading network, we use first-order approximation for the i-v characteristic: .MZ]\ � voltage signal X � ^" _� Q (3)
Y" .[Z]\ � � '� current signal X (4)
Y" Q
^"
4. Application to fault simulation The fault simulation process is depicted in Fig. 6. After “Spec. back-propagation”, one obtains (1) the output specification, the I/O transfer tables, and the input loading network of each block not involved in global feedback and each macro block, and (2) the set of acceptable output and possible input configurations for each block involved in global feedback. We then intend to remove the faults that cannot be
The driving network corresponding to Eq. 3 and Eq. 4 can be implemented by an independent source and a resistor. For example, the i-v characteristic of the output terminals �� of I BIAS is approximated by: � � � ��� c � + ����i�� ? � + � iT� i�P and the corresponding driving network is shown in Fig. 4(b). Single-block fault simulation Each fault j is injected to its victim block T to obtain the faulty block Tk . To
ensure that Tk is properly driven and loaded, we connect all of T k ’s inputs to the driving networks of T’s proceeding blocks and all of T k ’s outputs to the loading networks of T’s succeeding blocks. If T is not involved in global feedback, we perform OP (operating point) analysis on T k and compare the output configuration to T’s output specification. j is detected/undetected if T’s output specification is failed/satisfied. If T is involved in global feedback, we first check if we can make the pass/fail decision using the derived acceptable output and possible input configurations. This is done by performing a DC sweep analysis whose sweep range covers T’s possible input configurations and examine if all of T k ’s output configurations fall inside/outside T’s acceptable output configurations. If we can not make the decision, we inject j to the macro block M that contains T and perform an OP analysis on the resulting faulty macro block M k (properly loaded and driven). The output configuration of M k is compared to the output specification of M to make the pass/fail decision.
5. Simulation Results We use the servo control block circuit (Fig. 1(a)) designed in BiCMOS technology as our test case. The second row of Table 1 lists the number of elements in each of the blocks. blk elements faults detected fault coverage(%)
R EF 27 68 38 56
O UT I B IAS 27 36 68 79 35 48 51 61
D IFF V B IAS 2 V B IAS 1 M UX 98 52 34 8 240 130 82 24 102 92 34 8 43 71 41 33
Total 282 691 357 52
Table 1. Statistics of the servo block
5.1. The fault model In our experiments, we use the catastrophic open/short fault models including (1) the short and open faults for a resistor or a capacitor, (2) collector-base short, base-emitter short, base open, and emitter open faults for a BJT, and (3) drain-gate short, gate-source short, and drain open faults for a MOSFET. These faults have been identified to be the most common defect mechanism for BiCMOS process. Each short fault is modeled as a 10 ( resistor in parallel with the two faulty nodes and each open fault is modeled as a 10M ( resistor in series with the faulty node. The third row of Table 1 lists the number of faults in each block. Although we use the single fault model, our fault simulator is not limited to the single-fault assumption. It is applicable if there is only one faulty block (which may contain multiple faults).
5.2. The DC specification We use the DC specification shown in Table 2 as the system specification. It requires that both �!l and ��mAn�o satisfy the “constraints” when “test stimulus” is applied. The fourth and fifth rows of Table 1 show the number of detected faults and fault coverage of the DC specification when using full-circuit fault simulation. Overall, 52% of the catastrophic faults in the servo circuit can be detected. test stimulus +^p^qYr�s!p^qYrgt�uAvxw y�z�{ H z}| w y�~�{ H ~�| 25 A 2.4V 5V (4.5V,2.5V) (3.02V,2.98V)
constraints 1.825V s!p 1.829V 3.350V s,
3.363V
Table 2. DC specification for the test circuit
5.3. Results For comparison purpose, we use the full-circuit fault simulation results as the reference. Specification back-propagation The CPU time required for specification back-propagation is 22.6 seconds. The specification back-propagation results are shown in Table 3. The second column lists the nominal output value(s) of each block, and the third column lists the derived output specifications shown in the form of allowed percentage deviation from the nominal value(s) (the derived output specification of M UX is a 2-D plot and not shown). For example, the output specification of V BIAS 1 is that the deviation of its output � � should be within -5.7% to +13.0% of � � ’s nominal value. block I B IAS
nominal ���output ��� A A ���� ��� V V � �� V y= V H �� V
+Yz +~ V B IAS 1 s z V B IAS 2 s ` ~ D IFF M UX
allowed deviation(%) low high misclassified accuracy(%) -4.55 +4.54 2 97.5 -20.56 +25.1 -5.7 +13.0 0 100 -0.12 +0.6 0 100 -0.11 +0.16 5 97.9 0 100 -
Table 3. Derived output specifications To verify the accuracy of the derived specification, we compute the percentage of faults that will be correctly classified as detected/undetected by the derived output specification using full-circuit fault simulation result. The fifth and sixth columns in Table 3 are the number of misclassified faults and the percentage of correct classification, respectively. The high percentages (97%–100%) indicate the high quality of the derived output specifications. Fault simulation accuracy. We evaluate the fault simulation accuracy by computing the percentage of faults that are correctly classified. The second row of Table 4 is the number of misclassified faults in each block, and the third
row is the percentage of the correctly classified faults, i.e., the fault simulation accuracy. Among the 593 catastrophic faults, 16 are misclassified and the overall fault simulation accuracy is 98%. block misclassified accuracy full circuit out method speed up
R EF 0 100 132.8 12.4 10.7
O UT 1 99 143.0 12.7 11.2
I B IAS 0 100 187.2 20.3 9.2
D IFF V B IAS 2 V B IAS 1 14 0 0 94 100 100 570.2 263.2 188.4 85.6 40.8 16.8 6.7 6.5 11.2
M UX Overall 1 16 96 98 51.1 1535.9 3.1 214.3 16.6 7.2
Table 4. Fault simulation results Fault simulation efficiency. The fourth and fifth rows in Table 4 are the simulation time (seconds) for full-circuit fault simulation and our fault simulator, respectively. Note that the overall time for our method includes the overhead for specification back-propagation. The speedup factor (sixth row in Table 4) is greatest for the smallest block M UX and smaller for the larger blocks D IFF and V BIAS 2. This is so because while the required simulation time for each fault is about the same for full-circuit fault simulation, it takes less time for faults in smaller blocks when using our method. The overall speedup is 7.2. To see how the size of the circuit under test affects the overall speedup, we apply both fault simulation approaches to another circuit obtained by removing the blocks M UX and I BIAS from the servo block. The results are shown in Table 5. The second to fourth columns list the number of blocks, elements, and faults in the two circuits. The fifth and sixth columns are the fault simulation time required by fullcircuit fault simulation and our simulator, respectively. The speed up factor is shown in the last column. One can see that as the circuit size grows, the speedup factor also increases. This is due to the fact that as the circuit size grows, the average fault simulation time for each fault increases when using full-circuit fault simulation while it remains about the same when using our fault simulation approach. circuit blocks elements faults full ckt. our method speed up Mod. Servo 5 240 593 1020.8 190.2 5.4 7 282 691 1535.9 214.3 7.2 Servo Blk
Table 5. Effect of circuit size on speedup
6. Conclusion and future work We have presented the specification back-propagation technique and discuss how practical issues such as load effect, signal re-convergence, and global feedback are taken into account. Although we focus on its application in improving fault simulation efficiency, the technique can be applied to other areas such as design optimization, yield optimization, and test generation. We demonstrate the effec-
tiveness of our technique by using an industrial BiCMOS mixed-signal design. For the derived output specifications, the accuracy ranges from 97% to 100%. For the fault simulator, we achieve a fault simulation accuracy of 98% with a speedup factor of 7.2. We also show how the circuit size may affect the speedup factor. Our future work will be to (1) study efficient ways to handle blocks with a large number of inputs, (2) take into account the effect of parameter tolerance, and (3) extend current work to more general AC or transient specifications.
References [1] A. Balivada, H. Zheng, N. Nagi, A. Chatterjee, and others. A unified approach for fault simulation of linear mixed-signal circuits. Journal of Electronic Testing: Theory and Applications, 9(1–2):29–41, August–October 1996. [2] N. Hamida and B. Kaminska. Analog circuit testing based on sensitivity computation and new circuit modeling. In International Test Conference, pages 652–661, October 1993. [3] J. Hou and A. Chatterjee. CONCERT: A concurrent transient fault simulator for nonlinear analog circuits. In International Conference on Computer Aided Design, pages 384–391, 1998. [4] T. Koskinen and P. Cheung. Hierarchical tolerance analysis using statistical behavioral models. IEEE Transactions on Computer-Aided Design, 15(5):506–516, May 1996. [5] C. Kurker, J. Paulos, R. Gyurcsik, and J.-C. Lu. Hierarchical yield estimation of large analog integrated circuits. IEEE Journal of Solid-State Circuits, 28(3):203–209, March 1993. [6] A. Mexiner and W. Maly. Fault modeling for the testing of mixed integrated circuits. In Proc. International Test Conference, pages 564–572, October 1991. [7] N. Nagi and J. Abraham. Hierarchical fault modeling for analog and mixed-signal circuits. In Proc. VLSI Test Symposium, pages 96–101, May 1992. [8] N. Nagi, A. Chatterjee, and J. Abraham. DRAFTS: Discretized analog circuit fault simulator. In Proc. Design Automation Conference, pages 96–101, June 96–101. [9] C. Pan, K. Cheng, and S. Gupta. Fault macromodeling and a test strategy for opamps. Journal of Electronic Testing: Theory and Applications, 9(3):225–235, December 1996. [10] M. Slamani and B. Kaminska. Analog circuit fault diagnosis based on sensitivity computation and functional testing. IEEE Design & Test of Computers, 9(1):30–39, March 1992. [11] A. Strojwas and S. Director. An efficient algorithm for parametric fault simulation of monolithic IC’s. IEEE Transactions on Computer-Aided Design of Integrated Circuits and Systems, 10(8):1049–1058, August 1991. [12] P. Variyam and A. Chatterjee. FLYER: fast fault simulation of linear analog circuits using polynomial waveform and perturbed state representation. In Proceedings. Tenth International Conference on VLSI Design, pages 408–412, January 1997. [13] R. Voorakaranam, S. Chakrabarti, J. Hou, A. Gomes, et al. Hierachical specification-driven analog fault modeling for efficient fault simulation and diagnosis. In International Test Conference, pages 903–912, 1997.