Hindawi Publishing Corporation International Journal of Antennas and Propagation Volume 2013, Article ID 853746, 8 pages http://dx.doi.org/10.1155/2013/853746
Research Article Spectrum Sensing under Correlated Antenna Array Using Generalized Detector in Cognitive Radio Systems Modar Safir Shbat and Vyacheslav Tuzlukov School of Electronics Engineering, College of IT Engineering, Kyungpook National University, 1370 Sankyuk-dong, Buk-gu, Daegu 702-701, Republic of Korea Correspondence should be addressed to Vyacheslav Tuzlukov;
[email protected] Received 5 April 2013; Accepted 29 May 2013 Academic Editor: Krzysztof Kulpa Copyright © 2013 M. S. Shbat and V. Tuzlukov. This is an open access article distributed under the Creative Commons Attribution License, which permits unrestricted use, distribution, and reproduction in any medium, provided the original work is properly cited. We derive the probability of false alarm and detection threshold under employment of the generalized detector (GD) in cognitive radio (CR) systems for two scenarios: firstly, the independent antenna array elements; the secondly, the correlated antenna array elements. The energy detector (ED) and GD spectrum sensing performances are compared under the same initial conditions. The simulation results show that implementation of the GD improves the spectrum sensing performance in CR systems both for independent and correlated antenna array elements.
1. Introduction Simple random access protocols such as the carrier sense multiple access (CSMA) are widely used in many network applications. Using these protocols, the users and nodes have to define an availability of the radio channel or possibility to use a definite spectrum in order to start the transmission process after an arbitrary delay. The cognitive radio (CR) concept depends on the spectrum sharing and opportunistic spectrum access when there is a secondary network additionally to the primary network that has priority in access to spectral resources. The CR is an effective approach to improve spectrum utilization or radio resources by introducing an opportunistic use of frequency bands unused by the primary or licensed users. The CR systems have ability to measure, sense, learn, and define the radio channel parameters, the spectrum availability, and the radio operating conditions. Two types of users are considered in the CR systems, namely, the primary user and the secondary user. The primary users (the licensed users) have a priority to use the available designated spectrum. The secondary users are allowed to temporally use idle spectrum unused by the primary users. The secondary user should take down the radio resources if the primary user needs to use the same radio resources. Thus, the secondary user should try to find another idle radio resources or frequency bands.
In general, most of the existed spectrum sensing approaches are based on the energy detector [1, 2], matched filter, [3, 4], and cyclostationary detector [5, 6]. The matched filter requires a complete knowledge about the signal received from the primary user and signaling features. The cyclostationary detector exploits features of signal received from the primary user caused by periodicity. Advantage of the energy detector (ED) is an absence of any required information about the signal sent by the primary user. The ED is considered to be optimal in the case of independent antenna array elements [1], but it is not true in the opposite case, that is, the correlated antenna array elements. In general, the ED is sensitive to noise when variations in the noise power can cause a serious decline in the detection performance. The employment of ED with dynamic threshold in CR systems is investigated in [7] when the detection performance is defined under the fast fluctuated average noise power. The ED dynamic threshold is proposed to solve the problem of degradation in detection performance and sensitivity under the fast fluctuated average noise power, especially, at low values of the signal-to-noise ratio (SNR). The spectrum sensing performance under implementation of ED in CR systems is investigated in [8] using the dynamic threshold. Several spectrum sensing approaches based on the generalized likelihood ratio test (GLRT) are investigated in [8] with
2 the purpose to be implemented by CR systems. The techniques proposed in [9] use the eigenvalues of the sample covariance matrix of the received signal vector by treating unknown parameters of the probability density function (pdf) of observed data independently of the presence of the signal from the primary user. Another signal detection scheme based on the eigenvalues of the covariance matrix of the signal vector received from the primary user is proposed in [10]. This scheme generates a decision statistics for the detection of signal sent by the primary user based on the ratio between the largest and the smallest eigenvalues of the covariance matrix of the received signal vector. In this case, the probability of miss is defined as a function of the number of cooperative receivers, number of samples, and SNR [11]. Detection performance improving can be achieved by cooperative spectrum sensing using the two-step threshold ED [12]. The two-step thresholds are used for local detection allowing us to make a reliable local decision at each sensing node. The final decision is defined by combining the results of local decisions using the data fusion center. Under the spectrum sensing based on known signal pattern (waveform) of the primary user [13], the preamble (a known data sequence transmitted before each data burst) and the midamble (a known data sequence transmitted in the middle of the data burst) are used. Thus, if the signal pattern is known, the sensing process is performed by correlating the received signal with a known copy of itself (the coherent sensing). Some parameters extracted from the received signal, for example, the signal energy, and power spectral density are employed by radio identification sensing approach [14, 15]. More information about other spectrum sensing techniques such as the multitaper spectral estimation, wavelet transform estimation, and time-frequency analysis can be found in [13]. There are many problems under spectrum sensing in CR systems, namely, the detection of the signal received from the primary user under correlation of the antenna array elements, interference cancellation, hidden primary user, and sensing efficiency when the data transmission is not allowed for the CR users during the observation period. The last problem decreases the transmission opportunities [16]. Because of the low computation costs and implementation complexity, the ED is widely used in the spectrum sensing. Additionally, it does not need any knowledge about the signal sent by the primary user. The ED detects the signal by comparing the decision statistics with the detection threshold depended on the noise power (variance) [17]. The ED has some problems related to spectrum sensing including the threshold selection, interference cancellation, noise differentiation, noise power estimation, and detection performance degradation under the correlated antenna array elements and at the low SNR. The noise variance estimation problem is solved by distinguishing the noise and signal subspaces using the multiple signal classification (MUSIC) algorithm [18]. The idea to employ the generalized detector (GD) for spectrum sensing in CR is proposed with the purpose to improve the sensing performance under the correlated antenna array elements because the GD has the same advantage as the ED; that is, no knowledge about parameters of the signal sent by the primary user is required. The GD is
International Journal of Antennas and Propagation a combination of the Neyman-Pearson (NP) detector and ED based on the generalized approach to signal processing in noise [19]. As well known, the NP detector is optimal for the detection of signals with known parameters and the ED is optimal for the detection of signals with unknown parameters. The GD allows us to formulate a decision-making rule about the presence or absence of the signal based on definition of the jointly sufficient statistics of the mean and variance of likelihood function [20]. The GD implementation in wireless communication systems and GD detection performance are discussed in [21]. How we can improve the detection performance employing GD in radar sensor systems is investigated in [22, 23]. In this paper, the spectrum sensing in CR systems based on employment of the GD is evaluated. We define the detection threshold and the probability of false alarm under GD employment in CR systems. The sensing performance of the ED and GD is compared under the same conditions for two scenarios: firstly, the independent antenna array elements; secondly, the correlated antenna array elements. The simulation results demonstrate the better sensing performance of the GD in comparison with the ED one both for independent and correlated antenna array elements. The remainder of this paper is organized as follows. The system model is presented in Section 2. The GD main structure and the decision statistics are introduced in Section 3. Section 4 describes a definition of the GD threshold and a derivation of the probability of false alarm. The threshold and the probability of false alarm for ED are discussed in Section 5. The simulation results are presented in Section 6. The conclusion remarks are made in Section 7.
2. Spectrum Sensing in Correlated Antenna Array Elements Assume that the spectrum sensing is carried out by the secondary user and/or secondary sensing node with the number of antennas equal to 𝑀 (𝑀 antenna array elements). At the specific kth time instant and for the ith antenna array element, the binary hypothesis test for the spectrum sensing can be presented in the following form: 𝑤𝑖 [𝑘] , { { { 𝑖 = 1, . . . , 𝑀; 𝑘 = 0, . . . , 𝑁 − 1 ⇒ H0 ; 𝑥𝑖 [𝑘] = { 𝑎 [𝑘] + 𝑤𝑖 [𝑘] , ℎ [𝑘] { {𝑖 𝑖 = 1, . . . , 𝑀; 𝑘 = 0, . . . , 𝑁 − 1 ⇒ H1 , {
(1)
where 𝑥𝑖 [𝑘] is the discrete-time received signal at the input of secondary user or secondary sensing node; 𝑎[𝑘] is the discrete-time shift phase keying (PSK) modulated transmitted signal with the equal likely probability of transmission for all symbols; ℎ𝑖 [𝑘] is the discrete-time channel coefficient; and 𝑤𝑖 [𝑘] is the discrete-time additive white Gaussian noise (AWGN) with zero mean and variance equal to 𝜎𝑛2 , that is, 𝑤𝑖 [𝑘] ∼ CN(0, 𝜎𝑛2 ), where C denotes that 𝑤𝑖 [𝑘] is the complex random variable. The PSK modulated signal 𝑎[𝑘] is transmitted over a Rayleigh fading channel with coefficients obeying the complex Gaussian distribution with zero mean
International Journal of Antennas and Propagation
3
𝜂i [k]
AF xi [k] = {
yi [k] = ai [k] + 𝜁i [k]
PF
wi [k],
⇒ ℋ0 hi [k]a[k] + wi [k], ⇒ ℋ1
X
MSG
SGSA
+
X
−
+
X
+ X
−
K2
−
+ +
2
∑
+
THRA
1
2 K1 1
∑ 𝜂i2 [k]
Noise power estimator
out f1 [ZGD [k], aim [k]]
out f2 [ZGD [k], k]
Figure 1: GD structure.
and variance equal to 𝜎ℎ2 , that is, ℎ𝑖 [𝑘] ∼ CN(0, 𝜎ℎ2 ). The channel coefficients ℎ𝑖 [𝑘] corresponding to the ith antenna array element, 𝑖 = 1, . . . , 𝑀, are correlated between each other and independent of the time. The PSK modulated signal 𝑎[𝑘], the channel coefficients ℎ𝑖 [𝑘], and the AWGN 𝑤𝑖 [𝑘] are independent between each other. The exponential correlation model of antenna array elements is widely used owing to its simplicity and complete description of the spatial correlation [24]. The components of the 𝑀 × 𝑀 correlation matrix Cor are presented in the following form: 𝜌𝑖−𝑗 , 𝑖 ≤ 𝑗, 𝐶𝑜𝑟𝑖𝑗 = { 𝐶𝑜𝑟∗𝑗𝑖 , 𝑖 > 𝑗,
𝑖, 𝑗 = 1, . . . , 𝑀,
(2)
where 𝜌 is the coefficient of correlation between two adjacent antenna array elements, 0 ≤ 𝜌 ≤ 1 (real values), and ∗ denotes the complex conjugate. Using the approximated cross-correlation function defined in [25], the correlation coefficient 𝜌 can be given as 𝜌 = exp (−23Λ2 (
𝑑 2 ) ), 𝜆𝑐
(3)
where Λ is the angular spread, 𝜆 𝑐 is the wavelength, and 𝑑 is the distance between adjacent antenna array elements (antenna spacing). Thus, under these conditions, the correlation matrix Cor is the symmetric Toeplitz matrix [26]. The signals are received by 𝑀 antenna array elements. If the sample size of received signals is 𝑁, the 𝑀𝑁 × 1 received signal vector can be defined in the following form 𝑇
X = [𝑥1 (0) , . . . , 𝑥𝑀 (0) , . . . , 𝑥1 (𝑁 − 1) , . . . , 𝑥𝑀 (𝑁 − 1)] , (4) where 𝑇 denotes a transpose. The covariance matrices of the received signal vector X under the hypotheses H0 and H1 can be written in the following form: H0 ⇒ Cok0 = 𝐸 [XX𝐻 | H0 ] = 𝜎𝑛2 I, H1 ⇒ Cok1 = 𝐸 [XX𝐻 | H1 ] = 𝐸𝑎 𝜎ℎ2 A + 𝜎𝑛2 I,
(5)
where 𝐻 denotes the Hermitian conjugate (conjugate transpose), I is the 𝑀𝑁 × 𝑀𝑁 identity matrix, 𝐸𝑎 is the received signal energy at the input of the secondary user or sensing node, and A is the 𝑀𝑁 × 𝑀𝑁 matrix defined based on the correlation matrix Cor [26] Cor [ [ 0𝑀 A=[ [ . [ .. [ 0𝑀
0𝑀 ⋅ ⋅ ⋅ 0𝑀 . ] d d .. ] ] , ] d d 0𝑀 ] ⋅ ⋅ ⋅ 0𝑀 Cor]𝑀𝑁×𝑀𝑁
(6)
where 0𝑀 is an 𝑀 × 𝑀 zero matrix.
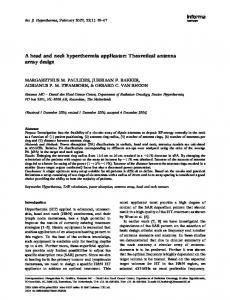
3. GD Structure and Decision Statistics The GD structure is presented in Figure 1. Here MSG is the model signal generator (local oscillator), AF is the additional filter, and PF is the preliminary filter. The threshold apparatus (THRA) device defines the GD threshold and the signal model generator switching apparatus (SGSA) is used to switch on the MSG with the purpose to define the unknown parameters of the detected signal. The noise power estimator evaluates 𝜎𝑛2 that is the variance of the noise at the GD input. PF and AF are two linear systems at the GD front end that can be presented, for example, as the band-pass filters with the impulse responses ℎPF (𝜏) and ℎAF (𝜏). For simplicity of analysis, we think that these filters have the same amplitudefrequency responses and bandwidths. Moreover, a resonant or centered frequency of the AF is detuned relative to a resonant frequency of the PF on such a value that the information signal cannot pass through the AF. Thus, the information signal and noise can appear at the PF output and only the noise appear at the AF output. If a value of detuning between the AF and PF resonant frequencies is more than 4 ÷ 5Δ𝑓𝑎 , where Δ𝑓𝑎 is the information signal bandwidth, the processes forming at the AF and PF outputs can be considered as independent and uncorrelated processes. In practice, under this condition the coefficient of correlation is not more than 0.05 [20, Chapter 3]. When the Gaussian noise 𝑤(𝑡) comes in at
4
International Journal of Antennas and Propagation
the AF and PF inputs (the GD linear system front end), the noise forming at the AF and PF outputs is Gaussian, too, because the AF and PF are the linear systems. We may think that the AF and PF do not change the statistical parameters of input process since they are the linear GD front end systems. For this reason, the AF can be considered as a generator of reference sample with a priori information a “no” signal. A detailed discussion of the AF and PF can be found in [27, Chapter 5]. The signal at the PF output can be defined as 𝑦𝑖 [𝑘] = 𝑎𝑖 [𝑘]+𝜁𝑖 [𝑘], where 𝜁𝑖 [𝑘] is the observed noise at the PF output and 𝑎𝑖 [𝑘] = ℎ𝑖 [𝑘]𝑎[𝑘]. Under the hypothesis H0 and for all ith and kth, 𝑦𝑖 [𝑘] is subjected to the complex Gaussian distribution with zero mean and variance 𝜎𝑛2 and is considered as the independent and identically distributed (i.i.d) process. The AF output signal is the reference noise 𝜂𝑖 [𝑘]. The model signal is defined as 𝑎𝑖𝑚 [𝑘] = 𝛽𝑎𝑖 [𝑘] ,
∑ ∑ 2𝑦𝑖 [𝑘] 𝑎𝑖𝑚 𝑘=0 𝑖=1
GD THRGD − 𝑚H 0
√VarGD H0
),
GD 𝑃miss = 𝑃 (𝑇GD (X) < THRGD | H1 )
= Φ(
GD THRGD − 𝑚H 1
√VarGD H1
(10)
),
where Φ (𝑥) =
1 1 𝑥 + erf ( ) √2 2 2
erf (𝑥) = ∫ exp (−𝑡2 ) 𝑑𝑡 0
𝑁−1 𝑀
𝑁−1 𝑀
H1
𝑘=0 𝑖=1
𝑘=0 𝑖=1
H0
(8) where THRGD is the GD threshold. The first term in (8) corresponds to the NP detector with twice the gain and is considered as the sufficient statistics of the likelihood function mean. The second term in (8) corresponds to the ED and is considered as the sufficient statistics of the likelihood function variance. The third term in (8) presents the reference noise power generated according to the main functioning principles of the GD [19, Chapter 3]. Under the hypothesis H1 corresponding to 𝑦𝑖 [𝑘] = 𝑎𝑖 [𝑘] + 𝜁𝑖 [𝑘] and the condition 𝑎𝑖𝑚 [𝑘] = 𝑎𝑖 [𝑘], the GD decision statistics takes the form 𝑇GD (X) =
= 1 − Φ(
(11)
𝑥
[𝑘]
− ∑ ∑ 𝑦𝑖2 [𝑘] + ∑ ∑ 𝜂𝑖2 [𝑘] ≷ THRGD ,
∑ ∑ 𝑎𝑖2 𝑘=0 𝑖=1
GD = 𝑃 (𝑇GD (X) ≥ THRGD | H0 ) 𝑃FA
is the integral of probability,
𝑁−1 𝑀
𝑁−1 𝑀
4.1. Correlated Antenna Array Elements. According to the GD decision statistics at the hypothesis H1 given by (9) if the energy of signal received by each of 𝑀 antenna elements is combined with equal gain and the condition 𝑎𝑖 [𝑘] = 𝑎𝑖𝑚 [𝑘] is satisfied, the GD defines the total received signal energy within the limits of the observation interval and compares this energy with the GD threshold THRGD to make a decision of a “yes” or a “no” signal sent by the primary user. The probGD GD and the probability of miss 𝑃miss ability of false alarm 𝑃FA are defined using the following forms [20, Chapter 6]:
(7)
where 𝑎𝑖𝑚 [𝑘] is the generated model signal and 𝛽 is the coefficient of the proportionality. The main functioning condition of GD is an equality over the whole range of parameters between the model signal forming at the GD MSG output and the detected signal forming at the GD input linear system (the PF) output [19]. How we can do it in practice is discussed in [20, Chapter 7]. The decision statistics at the GD output can be presented in the following form [20, Chapter 3]: 𝑇GD (X) =
4. Spectrum Sensing Performance of GD
[𝑘] −
𝑁−1 𝑀
∑ ∑ 𝜂𝑖2 𝑘=0 𝑖=1
[𝑘] −
𝑁−1 𝑀
∑ ∑ 𝜁𝑖2 𝑘=0 𝑖=1
GD is the is the error function which is identical to Φ(𝑥), 𝑚H 0 mean of the decision statistics 𝑇GD (X) under the hypothesis H0 , VarGD H0 is the variance of the decision statistics 𝑇GD (X) GD and VarGD under the hypothesis H0 , and 𝑚H H1 are the mean 1 and variance of the decision statistics under the hypothesis H1 , respectively. The decision statistics 𝑇GD (X) is a sum of 𝑀 × 𝑁 i.i.d. random variables. Using a relationship between the probability of detection 𝑃𝐷GD and the probability of miss GD 𝑃miss GD 𝑃𝐷GD = 1 − 𝑃miss
(9) where the second and third terms in (9) present the background noise at the GD output. The background noise is a difference between the noise power forming at the PF and AF outputs. In the opposite case (the hypothesis H0 ) corresponding to 𝑦𝑖 [𝑘] = 𝜁𝑖 [𝑘], the right side of (9), is the background noise only.
(13)
and taking into consideration a definition of the Gaussian 𝑄function 𝑄 (𝑥) =
[𝑘] ,
(12)
1 1 𝑥 − erf ( ) , √2 2 2
(14)
GD based on (10) the probability of false alarm 𝑃FA and the probGD ability of detection 𝑃𝐷 can be defined in the following forms: GD 𝑃FA = 𝑃 (𝑇GD (X) ≥ THRGD | H0 )
= 𝑄(
GD THRGD − 𝑚H 0
√VarGD H0
),
(15)
International Journal of Antennas and Propagation
5
𝑃𝐷GD = 𝑃 (𝑇GD (X) > THRGD | H1 ) = 𝑄(
GD THRGD − 𝑚H 1
√VarGD H1
(16)
),
where the Gaussian 𝑄-function can be presented in another form: 𝑄 (𝑥) =
∞ 1 𝑡2 ∫ exp (− ) 𝑑𝑡. √2𝜋 𝑥 2
(17)
The moment generating function (MGF) of the partial decision statistics given by 𝑇GD (X𝑘 ) =
𝑀
∑ 𝑎𝑖2 𝑖=1
[𝑘] +
𝑀
∑ 𝜂𝑖2 𝑖=1
[𝑘] −
𝑀
is sufficient to define the detection threshold. In other words, the noise variance at the GD input can be estimated. We assume that the probability of detection is lower bounded, that is, 𝑃𝐷GD ≥ 𝛼, where 𝛼 is the constraint. Based on (16), the GD threshold THRGD can be presented in the following form: GD −1 + √VarGD THRGD = 𝑚H H1 𝑄 (𝛼) . 1
As follows from (20), the GD threshold THRGD can be rewritten in the following form: 𝑀
𝑖=1
∑ 𝜁𝑖2 𝑖=1
[𝑘] ,
(23)
(18)
The SNR at the secondary sensing node input is defined as
where is the sum of correlated random variables, can be delivered using the procedure discussed in [28]. As follows from (18), the MGF is defined as M𝑇GD (X𝑘 ) (𝑠) = ∏(1 − 𝑖=1
𝛾=
𝐸𝑎 𝜎ℎ2 . 𝜎𝑛2
(24)
Taking into account (24), the THRGD can be presented in the following form:
−1 𝑠 (𝐸𝑎 𝜎ℎ2 𝜆 𝑖 ))
𝑀
𝑀
−1
𝑀
−1
× ∏(1 − 𝑠 (√2𝜎𝑛2 )) ∏(1 + 𝑠 (√2𝜎𝑛2 )) , 𝑖=1
2
THRGD = 𝑁𝑀𝐸𝑎 𝜎ℎ2 + 𝑄−1 (𝛼) √ 𝑁 {∑ (𝐸𝑎 𝜎ℎ2 𝜆 𝑖 ) +4𝑀𝜎𝑛4 }.
2 ∑𝑀 𝑖=1 𝑎𝑖 [𝑘]
𝑀
(22)
2
THRGD = 𝑁𝑀𝛾𝜎𝑛2 + 𝑄−1 (𝛼) √ 𝑁 {∑ (𝛾𝜎𝑛2 𝜆 𝑖 ) + 4𝑀𝜎𝑛4 }. 𝑖=1
𝑖=1
(25)
(19) where 𝜆 𝑖 is the eigenvalue of the ith spatial channel of the correlation matrix Cor. The mean and the variance of the partial decision statistics under the hypothesis H1 can be presented in the following form: GD = 𝐸 [𝑇GD (X𝑘 ) | H1 ] = 𝑀 (𝐸𝑎 𝜎ℎ2 ) , 𝑚H 1 𝑀
Based on (15), (21), and (23), the probability of false alarm GD 𝑃FA under correlated antenna array elements is defined in the following form: GDcor
𝑃FA
2
2
2 4 VarGD H1 = Var [𝑇GD (X𝑘 ) | H1 ] = ∑ (𝐸𝑎 𝜎ℎ 𝜆 𝑖 ) + 4𝑀𝜎𝑛 .
2 4 𝑁𝑀𝐸𝑎 𝜎ℎ2 +𝑄−1 (𝛼)√𝑁 {∑𝑀 𝑖=1 (𝐸𝑎 𝜎ℎ 𝜆 𝑖 ) +4𝑀𝜎𝑛 } =𝑄 ( ). √4𝑁𝑀𝜎𝑛4
(26)
𝑖=1
(20) Similarly, the variance of the partial decision statistics 𝑇GD (X𝑘 ) under the hypothesis H0 takes the form 4 VarGD H0 = Var [𝑇GD (X𝑘 ) | H0 ] = 4𝑀𝜎𝑛 .
(21)
Under the hypothesis H0 , the mean of the partial decision GD statistics 𝑇GD (X𝑘 ) is equal to zero, 𝑚H = 0 [20, Chapter 3]. 0 For large values of 𝑁, the central limit theorem can be applied to obtain the pdf of the GD decision statistics. With the purpose of avoiding the interference for the primary user in the CR systems, we define a lower bound of the probability of detection 𝑃𝐷. Thus, the sensing performance is evaluated by the probability of false alarm 𝑃FA while the probability of detection 𝑃𝐷 is maintained in accordance with the determined lower bound. In this case, there is a need to define the GD threshold THRGD as a function of the probability of detection 𝑃𝐷 applying the required lower bound. In practice, in the case of GD, a knowledge of the GD input noise variance
After some elementary mathematical transformations and GD using (24), we can rewrite the 𝑃FA cor as follows: 2
GD 𝑃FA cor
𝛾√𝑁𝑀+𝑄−1 (𝛼)√(1/𝑀) (∑𝑀 𝑖=1 (𝛾𝜆 𝑖 ) +4𝑀) =𝑄 ( ). 2 (27)
4.2. Independent Antenna Array Elements. Under conditions that the value of 𝑑/𝜆 𝑐 is high and the angular spread Λ value is close to 𝜋, there is no correlation between the adjacent antenna array elements in the GD; that is, the correlation coefficient is equal to zero (𝜌 = 0). Then, taking into consideration that the correlation matrix becomes 𝑀 × 𝑀 identity matrix, the probability of false alarm 𝑃FA can be presented as a limiting case [26]: uncor cor = lim 𝑃FA . 𝑃FA 𝜌→0
(28)
6
International Journal of Antennas and Propagation
Threshold setting
A/D
(· · · )2
FFT
Threshold comparison
Finite time integrator
Figure 2: ED structure.
GD Thus, based on (27), the probability of false alarm 𝑃FA under uncorrelated antenna array elements can be presented in the following form:
GD 𝑃FA uncor
GD = lim 𝑃FA cor 𝜌→0
=𝑄 (
𝑄−1 (𝛼) √(𝛾2 +4)+𝛾√𝑁𝑀 2
).
In the case when the antenna array elements are uncorrelated, ED takes the following form the probability of false alarm 𝑃FA [26]: 𝑃FA uncor = lim 𝑃FA cor = 𝑄 [𝑄−1 (𝛼) (𝛾 + 1) + 𝛾√𝑁𝑀] . ED
ED
𝜌→0
(33) (29)
Equation (29) presents the lower bound of the probability of GD false alarm 𝑃FA .
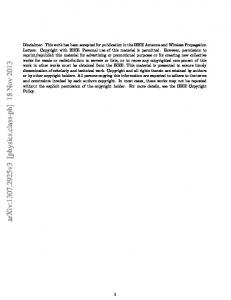
5. ED Spectrum Sensing Performance The ED flowchart is presented in Figure 2 where we use the following notations: 𝐴/𝐷 is the analog-to-digital converter, FFT is the fast Fourier transform, and (⋅ ⋅ ⋅ )2 denotes the square law function. The spectrum sensing performance of ED was discussed in [26] for two cases: there is correlation between the antenna array elements and there is no correlation between the antenna array elements. Under the initial conditions discussed in Section 2, the decision statistics at the ED output can be defined as 𝑁−1 𝑀
𝑇ED (X) = ∑ ∑ 𝑥𝑖2 [𝑘] .
(30)
𝑘=0 𝑖=1
The ED decision statistics under the hypotheses H0 and H1 obeys the following distributions [26]: H0 ⇒ 𝑇ED (X) ∼ N (𝑁𝑀𝜎𝑛2 , 𝑁𝑀𝜎𝑛4 ) , H1 ⇒ 𝑇ED (X) 𝑀
2
∼ N (𝑁𝑀 (𝐸𝑎 𝜎ℎ2 + 𝜎𝑛2 ) , 𝑁 ∑ (𝐸𝑎 𝜎ℎ2 𝜆 𝑖 + 𝜎𝑛2 ) ) . 𝑖=1
(31) In the case of correlated antenna array elements, the probED ability of false alarm 𝑃FA can be derived also based on the detection threshold and the lower bounded probability of detection 𝑃𝐷ED , that is, 𝑃𝐷ED ≥ 𝛼. According to [26], the ED probability of false alarm 𝑃FA can be written as 1 𝑀 2 ED 𝑃FA cor = 𝑄 [𝑄−1 (𝛼) √ ∑ (𝛾𝜆 𝑖 + 1) + 𝛾√𝑁𝑀] . (32) 𝑀 𝑖=1 [ ]
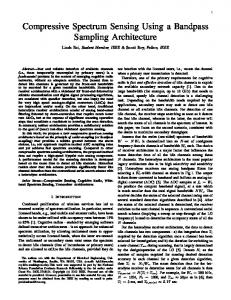
6. Simulation Results The ED and GD sensing performances in CR systems are compared under the same initial conditions for two cases, namely, the independent antenna array elements and the correlated antenna array elements. We verify the spectrum sensing performance analysis for both detectors using MATLAB where the simulation conditions and parameters are established according to IEEE 802.22 [29]. The main simulation parameters are presented in Table 1. In Figure 3, the probability of false alarm 𝑃FA of ED and GD is presented as a function of SNR when the antenna array elements are independent, and when the antenna array elements are correlated with the coefficient of correlation 𝜌 = 1, the number of antenna array elements is 𝑀 = 6. The GD demonstrates better performance in comparison with the ED for all cases. For example, in the case of independent antenna array elements, at the probability of false alarm 𝑃FA equal to 0.5 the SNR gain in favor of GD is approximately 4 dB in comparison with the ED. Under the correlated antenna array elements and at the same probability of false alarm 𝑃FA = 0.5, the SNR gain is about 2 dB in favor of GD comparing with the ED. In general, as shown in Figure 3, the probability of false alarm 𝑃FA for the correlated antenna array elements both for the ED and GD is higher in comparison with the case when the correlation between antenna array elements is absent. Figure 4 presents the receiver operation characteristic (ROC) curves for the GD and ED when the antenna array elements are independent; the number of antenna array elements is 𝑀 = 6 and SNR= −5 dB and −10 dB. The GD demonstrates superiority in sensing performance. For example, at the probability of false alarm 𝑃FA being equal to 0.1 and SNR = −10 dB, the probability of detection 𝑃𝐷 in the case of ED is equal approximately to 0.45, while the GD achieves the probability of detection 𝑃𝐷 equal to 0.8 under the same conditions. At the SNR = −5 dB and if the probability of false alarm 𝑃FA is equal to 0.1, both ED and GD achieve a probability of detection 𝑃𝐷 of more than 0.9.
International Journal of Antennas and Propagation
0.9
7
ED and GD performance comparison
0.9
0.8
0.8
0.7
Probability of detection
Probability of false alarm
ROC of ED and GD
1
0.6 0.5 0.4 0.3
0.7 0.6 0.5 0.4 0.3
0.2
0.2
0.1
0.1
0 −20
−15
−10 SNR [dB]
ED“-yes” correlation ED“-no” correlation
0
−5
0
0
0.2
GD“-yes” correlation GD“-no” correlation
ED, SNR = −5 dB ED, SNR = −10 dB
Figure 3: Comparison between the ED and GD sensing performance.
0.6
0.8
1
GD, SNR = −5 dB GD, SNR = −10 dB
Figure 4: ROC of ED and GD. 100
Table 1: Simulation parameters. Value 0.5
∘
180∘ 𝑑 = 𝜆 𝑐 /8 𝑑 = 𝜆 𝑐 /2 2 ÷ 10 −20 ÷ 0 (dB) 0.99 0; 0.1; 0.25; 0.5; 0.75; 1 1 20
In Figure 5, we illustrate the GD performance in terms GD of the probability of false alarm 𝑃FA ; when the number of antenna array elements is variable 2 ≤ 𝑀 ≤ 10, the coefficient of correlation 𝜌 is changed as a parameter within the limits of 0.1 ≤ 𝜌 ≤ 1, and the SNR = −5 dB. As we can see from GD increases monoFigure 5, the probability of false alarm 𝑃FA tonically with the increasing in the coefficient of correlation 𝜌 between antenna array elements. The use of large number of antenna array elements 𝑀 allows us to reduce the negative action of the coefficient of correlation 𝜌 on the probability of GD . false alarm 𝑃FA
7. Conclusions Comparison of the spectrum sensing performance between the ED and GD is performed under the independent and correlated antenna array elements in CR systems at the low
10−2 Probability of false alarm
Parameter The angular spread (Λ), the correlated antenna array elements The angular spread (Λ), the uncorrelated antenna array elements Distance between antenna elements (𝑑), the correlated antenna array elements Distance between antenna elements (𝑑), the uncorrelated antenna array elements Number of antenna array elements (𝑀) SNR 𝑃𝐷 constraint (𝛼) Coefficient of correlation (𝜌) Channel parameter (𝜎ℎ2 ) 𝑁
0.4
Probability of false alarm
10−4 10−6 10−8 10−10
2
3
4 5 6 7 8 9 Number of antenna array elements (M)
GD, 𝜌 = 1, 𝛾 = −5 dB GD, 𝜌 = 0.75, 𝛾 = −5 dB GD, 𝜌 = 0.5, 𝛾 = −5 dB
10
GD, 𝜌 = 0.25, 𝛾 = −5 dB GD, 𝜌 = 0.1, 𝛾 = −5 dB
Figure 5: The probability of false alarm for GD versus the number of antenna array elements at various values of the coefficient of correlation.
SNR. The GD overcomes the ED in the sensing performance when the antenna array elements are either independent or correlated. The simulation results show a validity to use the GD for spectrum sensing in CR systems and confirm a superiority of GD implementation in comparison with ED. GD and ED performance analysis allows us to conclude that the probability of false alarm is lower bounded when the antenna array elements are independent. The GD sensing performance is a function of the coefficient of correlation between the antenna array elements. It follows from the fact that the probability of false alarm increases with the increasing in the coefficient of correlation between the antenna array elements. The use of large number of antenna array elements allows us to reduce
8 a negative influence of correlation between the antenna array elements and, consequently, a degradation of the GD sensing performance.
Acknowledgment This research was supported by the Kyungpook National University research grant 2012.
References [1] A. Sonnenschein and P. M. Fishman, “Radiometric detection of spread-spectrum signals in noise of uncertain power,” IEEE Transactions on Aerospace and Electronic Systems, vol. 28, no. 3, pp. 654–660, 1992. [2] S. M. Kay, Fundamentals of Statistical Signal Processing: Detection Theory, vol. 2, Prentice Hall, Upper Saddle River, NJ, USA, 1998. [3] H.-S. Chen, W. Gao, and D. G. Daut, “Signature based spectrum sensing algorithms for IEEE 802.22 WRAN,” in Proceedings of the IEEE International Conference on Communications (ICC ’07), pp. 6487–6492, Glasgow, Scotland, June 2007. [4] D. Cabric, A. Tkachenko, and R. W. Brodersen, “Spectrum sensing measurements of pilot, energy, and collaborative detection,” in Proceedings of the Military Communications Conference (MILCOM ’06), pp. 1–7, Washington, DC, USA, October 2006. [5] W. A. Gardner, “Exploitation of spectral redundancy in cyclostationary signals,” IEEE Signal Processing Magazine, vol. 8, no. 2, pp. 14–36, 1991. [6] N. Han, S. H. Shon, J. O. Joo, and J. M. Kim, “Spectral correlation based signal detection method for spectrum sensing in IEEE 802.22 WRAN systems,” in Proceedings of the 8th International Conference Advanced Communication Technology (ICACT ’06), pp. 1765–1770, Gangwon-Do, South Korea, February 2006. [7] G. Yu, C. Long, M. Xiang, and X. I. Wei, “A Novel energy detection scheme based on dynamic threshold in cognitive radio systems,” Journal of Computational Information Systems, vol. 8, no. 6, pp. 2245–2252, 2012. [8] C. Korumilli, C. Gadde, and I. Hemalatha, “Performance analysis of energy detection algorithm in cognitive radio,” International Journal of Engineering Research and Applications, vol. 2, no. 4, pp. 1004–1009, 2012. [9] T. J. Lim, R. Zhang, Y. C. Liang, and Y. Zeng, “GLRT-based spectrum sensing for cognitive radio,” in Proceedings of the IEEE Global Telecommunications Conference (GLOBECOM ’08), pp. 4391–4395, New Orleans, La, USA, December 2008. [10] Y. Zeng and Y.-C. Liang, “Maximum-minimum eigenvalue detection for cognitive radio,” in Proceedings of the 18th Annual IEEE International Symposium on Personal, Indoor and Mobile Radio Communications (PIMRC ’07), pp. 1–5, Athens, Greece, September 2007. [11] F. Penna, R. Garello, and M. A. Spirito, “Probability of missed detection in eigenvalue ratio spectrum sensing,” in Proceedings of the 5th IEEE International Conference on Wireless and Mobile Computing Networking and Communication (WiMob ’09), pp. 117–122, Marrakech, Morocco, October 2009. [12] H. Chen and J. Liu, “Cooperative spectrum sensing based on double threshold detection and Dempster-Shafer theory,” in Proceedings of the IEEE 12th International Conference on Communication Technology (ICCT ’2010), pp. 1212–1215, Nanjing, China, November 2010.
International Journal of Antennas and Propagation [13] T. Y¨ucek and H. Arslan, “A survey of spectrum sensing algorithms for cognitive radio applications,” IEEE Communications Surveys and Tutorials, vol. 11, no. 1, pp. 116–130, 2009. [14] M. Mehta, N. Drew, G. Vardoulias, N. Greco, and C. Niedermeier, “Reconfigurable terminals: an overview of architectural solutions,” IEEE Communications Magazine, vol. 39, no. 8, pp. 82–89, 2001. [15] J. Palicot and C. Roland, “A new concept for wireless reconfigurable receivers,” IEEE Communications Magazine, vol. 41, no. 7, pp. 124–132, 2003. [16] W.-Y. Lee and I. F. Akyildiz, “Optimal spectrum sensing framework for cognitive radio networks,” IEEE Transactions on Wireless Communications, vol. 7, no. 10, pp. 3845–3857, 2008. [17] F. F. Digham, M.-S. Alouini, and M. K. Simon, “On the energy detection of unknown signals over fading channels,” in Proceedings of the International Conference on Communications (ICC ’03), pp. 3575–3579, Seattle, Wash, USA, May 2003. [18] M. P. Olivieri, G. Barnett, A. Lackpour, A. Davis, and P. Ngo, “A scalable dynamic spectrum allocation system with interference mitigation for teams of spectrally agile software defined radios,” in Proceedings of the 1st IEEE International Symposium on New Frontiers in Dynamic Spectrum Access Networks (DySPAN ’05), pp. 170–179, Baltimore, Md, USA, November 2005. [19] V. P. Tuzlukov, “A new approach to signal detection theory,” Digital Signal Processing: A Review Journal, vol. 8, no. 3, pp. 166–184, 1998. [20] V. Tuzlukov, Signal Detection Theory, Springer, Boston, Mass, USA, 2001. [21] V. Tuzlukov, “Generalized approach to signal processing in wireless communications: the main aspects and some examples,” in Wireless Communications and Networks- Recent Advances, Ch 11, pp. 305–338, InTech, Rijeka, Croatia, 2012. [22] M. S. Shbat and V. Tuzlukov, “Generalized approach to signal processing in noise for closing vehicle detection application using FMCW radar sensor system,” in Proceedings of the International Radar Symposium (IRS ’11), pp. 459–464, Warsaw, Poland, September 2011. [23] M. S. Shbat and V. Tuzlukov, “Noise power estimation under generalized detector employment in automotive detection and tracking systems,” in Proceedings of 9th IET Data Fusion and Target Tracking Conference (DF & TT ’12), London, UK, 2012. [24] S. L. Loyka, “Channel capacity of MIMO architecture using the exponential correlation matrix,” IEEE Communications Letters, vol. 5, no. 9, pp. 369–371, 2001. [25] G. D. Durgin and T. S. Rappaport, “Effects of multipath angular spread on the spatial cross-correlation of received voltage envelopes,” in Proceedings of the IEEE VTS 49th Vehicular Technology Conference (VTC ’99), pp. 996–1000, Houston, Tex, USA, September 1999. [26] S. Kim, J. Lee, H. Wang, and D. Hong, “Sensing performance of energy detector with correlated multiple antennas,” IEEE Signal Processing Letters, vol. 16, no. 8, pp. 671–674, 2009. [27] V. Tuzlukov, Signal Processing Noise, CRC Press, Taylor & Francis Group, Washington, DC, USA, 2002. [28] M.-S. Alouini, A. Abdi, and M. Kaveh, “Sum of gamma variates and performance of wireless communication systems over Nakagami-fading channels,” IEEE Transactions on Vehicular Technology, vol. 50, no. 6, pp. 1471–1480, 2001. [29] IEEE 802.22 working group on wireless regional area networks (WRAN), http://grouper.ieee.org/groups/802/22/.
International Journal of
Rotating Machinery
Engineering Journal of
Hindawi Publishing Corporation http://www.hindawi.com
Volume 2014
The Scientific World Journal Hindawi Publishing Corporation http://www.hindawi.com
Volume 2014
International Journal of
Distributed Sensor Networks
Journal of
Sensors Hindawi Publishing Corporation http://www.hindawi.com
Volume 2014
Hindawi Publishing Corporation http://www.hindawi.com
Volume 2014
Hindawi Publishing Corporation http://www.hindawi.com
Volume 2014
Journal of
Control Science and Engineering
Advances in
Civil Engineering Hindawi Publishing Corporation http://www.hindawi.com
Hindawi Publishing Corporation http://www.hindawi.com
Volume 2014
Volume 2014
Submit your manuscripts at http://www.hindawi.com Journal of
Journal of
Electrical and Computer Engineering
Robotics Hindawi Publishing Corporation http://www.hindawi.com
Hindawi Publishing Corporation http://www.hindawi.com
Volume 2014
Volume 2014
VLSI Design Advances in OptoElectronics
International Journal of
Navigation and Observation Hindawi Publishing Corporation http://www.hindawi.com
Volume 2014
Hindawi Publishing Corporation http://www.hindawi.com
Hindawi Publishing Corporation http://www.hindawi.com
Chemical Engineering Hindawi Publishing Corporation http://www.hindawi.com
Volume 2014
Volume 2014
Active and Passive Electronic Components
Antennas and Propagation Hindawi Publishing Corporation http://www.hindawi.com
Aerospace Engineering
Hindawi Publishing Corporation http://www.hindawi.com
Volume 2014
Hindawi Publishing Corporation http://www.hindawi.com
Volume 2014
Volume 2014
International Journal of
International Journal of
International Journal of
Modelling & Simulation in Engineering
Volume 2014
Hindawi Publishing Corporation http://www.hindawi.com
Volume 2014
Shock and Vibration Hindawi Publishing Corporation http://www.hindawi.com
Volume 2014
Advances in
Acoustics and Vibration Hindawi Publishing Corporation http://www.hindawi.com
Volume 2014