Aurora database is in turn obtained from the TIDigit database ... filter bank [19] with centre frequencies spaced linearly in ERB- rate from 50 to 3750 Hz. The ...
➠
➡ SPEECH ENHANCEMENT WITH MISSING DATA TECHNIQUES USING RECURRENT NEURAL NETWORKS Shahla Parveen and Phil Green Department of Computer Science, University of Sheffield, Sheffield S1 4DP, UK {s.parveen, p.green}@dcs.shef.ac.uk ABSTRACT This paper presents an application of missing data techniques in speech enhancement. The enhancement system consists of two stages: the first stage uses a Recurrent Neural Network, which is supplied with noisy speech and produces enhanced speech; whereas the second stage uses missing data techniques to further improve the quality of enhanced speech. The results suggest that combining missing data technique with RNN enhancement is an effective enhancement scheme resulting in a 16 dB background noise reduction for all input signal to noise ratio (SNR) conditions from -5 to 20 dB, improved spectral quality and robust automatic speech recognition performance.
networks (ANNs) to approximate any non-linear function also makes them suitable for non-linear transformations commonly used in speech feature extraction e.g. log spectrum, mel frequency cepstral coefficients (MFCCs). Several researchers have used ANNs for speech enhancement [2], [7], [8]. Conventional ANNs, despite their strong generalisation capability, can not easily model the temporal behaviour of speech signal: the only way to address this issue is to use a windowed input of time-neighbouring features. RNN, on the other hand, have the potential to deal naturally with the variable length of speech signal and also can capture long-term contextual effects over time which may be useful for better enhancement. We use RNNs as the primary speech enhancement system. In addition, the use of missing data techniques are exploited in a simplistic manner for speech enhancement in the spectral domain.
1. INTRODUCTION
2. MISSING DATA TECHNIQUES
The operation of automatic speech recognition (ASR) systems, telecommunication applications and cellular phones under varying background noise conditions has made speech enhancement an interesting area of research for the past two decades [1-8]. Various approaches to speech enhancement have been proposed to date [1], [2]. The aim of all state-of-the-art speech enhancement techniques is to improve the perceptual aspects of quality and intelligibility of speech by utilising the estimated noise [3]. Speech enhancement techniques can be divided into two broad categories; parametric and non-parametric. Parametric approaches are based on mathematical models and are able to extract high resolution frequency spectra from relatively short data sets provided that the structure of signal is known. These techniques require more prior knowledge with the increase in the complexity of signal than non-parametric approaches. Nonparametric approaches are, therefore, more suitable for complex signals. Spectral subtraction is a simple and popular nonparametric enhancement method [4], [5]. It makes simplifying assumptions about the shape of noise and its combination with the speech signal. The major drawback of this technique is that it is difficult to deal with non-stationary noises. Another disadvantage is the effect of musical noise in the enhanced speech, which is caused by setting to zero the negative energy values which result from subtraction of overestimated noise. Neural enhancement techniques efficiently reduce the effect of musical noise because neural networks provide a smoother estimate of the signal [6]. The capability of artificial neural
0-7803-8484-9/04/$20.00 ©2004 IEEE
Missing data techniques, primarily developed for robust ASR, [9], [10], [11], [12] deal with speech corrupted by additive noise. They make minimal assumptions about the nature of the noise. They are based on identifying uncorrupted, reliable regions in the frequency domain and adapting recognition algorithms so that classification is based on these regions.
2.1. Missing Data Masks In the ‘missing data’ approach to speech recognition in the presence of other sound sources, the assumption is that some spectral-temporal regions will remain uncorrupted, and the remainder can be thought of as ‘missing’ for the recognition task. See [10] for supporting arguments. Initial processes, based on local signal-to-noise estimates [10], on auditory grouping cues [13], or a combination [9] define a binary ‘missing data mask’: ones in the mask indicate reliable (or ‘present’) features and zeros indicate unreliable (or ‘missing’) features (see Figure 1).
3. SPEECH ENHANCEMENT AND MISSING DATA When noise is added to speech, the effect of noise is insignificant in spectral regions with high speech energy. Missing data techniques in ASR benefit from this information to derive missing data masks by assuming that each time-frequency region is either dominated by the speech signal or the noise source (Figure 1).
I - 733
ICASSP 2004
➡
➡ 32
32
noisy speech 1
0
Time (sec)
0.4
1
32
32
1
1
0
Time (sec)
RNN speech enhancer
0.4
MD masks to replace the unreliable features with the RNN output
enhanced speech
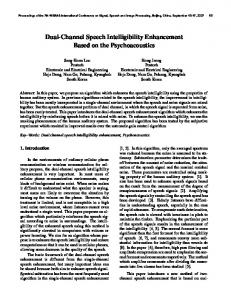
Figure 2: Missing Data based pattern completion with RNN. 0
Time (sec)
0.4
0
Time (sec)
0.4
Figure 1: Auditory spectrograms (row 1) and SNR mask (row 2) for digit ‘One’ with subway noise at various SNRs (left to right: 20 dB, 10 dB) The choice of frequency channels for enhancement can be made by using these missing data masks. Furthermore, • The masks can be used during training of the enhancement net to selectively reduce the error of the output units by using clean values of speech as the target for the unreliable channels. The output error for the channels which are within the mask can be reduced by using noisy speech as the target. • The other way of deploying missing data masks could be to use them with an enhancement net trained in the normal way. In this case, the channels which are highly affected by the noise can be replaced with the output of the enhancement net, (Figure 2). The resulting feature vectors can be supplied to an existing speech recogniser.
vector, i.e. the number of spectral channels (32 channels in the experiments reported). The number of hidden units is determined by experimentation (30 in our experiments). RNN weights are updated using back-propagation through time [17]. The error for the enhanced features is estimated as the sum squared error between the correct targets (the clean spectrum) and the RNN output for each frame. The enhancement phase consists of a forward pass to produce RNN output for enhancement at each time step.
4.2. Missing data filter The second stage chooses the regions of noisy speech with higher levels of corruption by using a missing data mask, MF Y , and replaces them with the enhanced speech, net � Y , coming from RNN enhancer. ˆX = ° net � Y if MF Y = 0 ® Y if MF Y = 1 ° ¯
4. RNN BASED SPEECH ENHANCEMENT RNNs have the potential to capture long-term contextual effects over time which may be useful for better enhancement. Moon [8] has used RNNs for speech enhancement where separate RNNs were trained on 180 isolated words corrupted with white and coloured noise at SNRs 0 dB, 10 dB and 20 dB (resulting in six trained RNNs). The use of RNNs to perform both enhancement and classification using a single net (multitask learning) has been reported in our earlier papers [14, 15]. In the current paper we present an application of missing data in speech enhancement. Figure 2 shows the block diagram of our speech enhancement system. The first stage consists of an RNN which is supplied with noisy speech spectra and produces enhanced speech. In comparison to [8], a single RNN is trained for four different noises at SNRs from 0 dB to 20 dB with a difference of 5 dB. The second stage uses the missing data technique to produce the final enhanced speech spectra.
4.1. RNN architecture The RNN is supplied with noisy speech at time t and produces enhanced speech for the same time. The RNN basically has an Elman architecture [16], where there are fully connected recurrent links from the past hidden layer to the present hidden layer. The number of input and output units depends on the size of feature
(1)
where Y and Xˆ represent noisy and the enhanced feature respectively. Missing data mask was produced by using a local SNR criterion (row 2 of Figure 1) in which noise is estimated from the first few silence frames and then the local SNR is compared with a threshold to define missing spectral-temporal region [10]. The compressive nature of energies in the spectral domain makes the effect of noise insignificant at peaks in the spectrum. Therefore, the enhanced speech after this stage consists perceptually clean speech and is less affected by the distortions produced by the enhancement scheme for relatively clean speech.
5. EXPERIMENTAL SETUP AND DATABASE Experiments were performed using data from male speakers in the isolated digits section of the AURORA database [18]. This database contains about 1200 isolated digits from 55 male speakers, where each speaker spoke 2 examples of the 11 word vocabulary (the digits 1-9, ‘oh’ and ‘zero’). All speech data in the Aurora database is in turn obtained from the TIDigit database after downsampling to 8 KHz and filtering with a G712 characteristic. 1000 examples were chosen for training. A validation set of
I - 734
➡
➡ 100
32
RNN: SS RNN: RNNENH RNN: RNNENH + SNR mask MCRNN: RNNENH + SNR mask HMM: MARG + SNR mask
1
0
Time (sec)
0.38
32
1
0
Time (sec)
Classification error %
90
0.38
80 70 60 50 40 30
25
Noise Reduction (dB)
32
20
32
RNNENH+SNR mask RNNENH SS NP
20
15
10
5
10 0 −5
0
5
10
SNR dB
15
20
0 −5
clean
0
5
(a)
Time (sec)
0.38
32
1
0
Time (sec)
0.38
32
40
0.9
35
0.8
0.6 0.5 0.4 0.3
RNNENH+SNR mask RNNENH SS NP
0.1
1
0
Time (sec)
0.38
1
0
Time (sec)
0 −5
0.38
0
5
10
SNR dB
15
20
clean
25 20 15 10 5 0 −5
0
(c) Figure 3: Auditory spectrograms (row 1), RNN enhanced spectrograms (row 2) and MD based RNN enhanced spectrograms (row 3) for digit ‘Three’ with subway noise at SNRs 20 dB and 0 dB (left to right). 110 examples was used to control the stopping condition in training. Performance was evaluated on the isolated digit section of AURORA test set A and test set B. The speech in test set A is additively corrupted with four noises (subway, babble, car and exhibition hall) at SNRs from 20 dB to -5 dB at 5 dB intervals whereas, test set B consists of speech added with restaurant, street, airport and train station noises. Acoustic vectors were obtained from a 32 channel auditory filter bank [19] with centre frequencies spaced linearly in ERBrate from 50 to 3750 Hz. The instantaneous Hilbert envelope at the output of each filter was smoothed with a first order filter with an 8 ms time constant, and sampled at a frame rate of 10 ms. Finally, a cube root compression was applied to the frame of energy values. Spectral domain acoustic vectors were used because of the requirement of missing data mask generation process.
6. RESULTS Speech enhancement results are evaluated in terms of isolated word recognition performance and pattern completion performance. In order to visualise the effect of enhancement schemes the auditory spectrograms for digit ‘Three’ with subway noise are shown in Figure 3. It is clear from the RNN enhanced spectrograms (row 2 and 3 of Figure 3) that background noise is reduced effectively with and without the use of missing data mask.
6.1. Recognition performance The speech enhanced using missing data filter was supplied to both RNNs trained on clean speech (‘RNN:RNNENH+SNR mask’ curve in figure 4) and an RNN trained on noisy speech
20
NP SS RNNENH RNNENH+SNR mask
30
0.7
0.2
15
(b)
1
Relative error %
0
Correlation coefficient
1
10
SNR dB
5
10
SNR dB
15
20
clean
(d)
Figure 4: Speech enhancement results obtained from RNN for test set A as a measure of (a) Classification error (b) Noise reduction (c) Correlation Coefficient (d) Relative pattern completion error. (‘MCRNN:RNNENH +SNR mask’ curve) for isolated word recognition. The RNNs had 32 input units, 120 hidden units and 11 output units associated with 11 isolated digits. The average classification performance of our systems is shown in Figure 4 (a) for noises in Aurora test A. We compare our results with: 1. A classification RNN trained on clean speech and tested on spectral subtraction enhancement (‘RNN:SS’ curve). 2. A classification RNN trained on clean speech and tested on RNN enhanced speech (‘RNN:RNNENH’ curve). 3. A CDHMM systems trained on clean isolated digits and tested using marginalisation based missing data recognition (‘HMM:MARG+SNR mask’ curve). These systems consisted of eleven whole word HMMs (‘1’ - ‘9’, ‘oh’, ‘zero’), each with 16 states and 2 mixtures per state. The improvement in results compared to spectral subtraction can be seen with the proposed enhancement scheme and results for noises in set B were similar. Cascading the RNN enhanced speech with a classification RNN trained on noisy speech gave higher performance i.e. the average (i.e. for all conditions including clean speech and noisy speech at SNRs from -5 dB to 20 dB) incremental word error rate (WER) reduction of 3.78% (17.36% relative WER reduction) compared to marginalisation.
6.2. Pattern completion performance Speech enhancement results obtained from a separate RNN (‘RNNENH’ curve) and missing data based RNN enhancement (‘RNNENH+SNR mask’ curve) are compared with spectral subtraction (‘SS’ curve) and noisy condition (‘NP’ curve). The average results for speech added with all noises in Aurora test set A are shown at SNRs 20, 15, 10, 5, 0, -5 dB as measures of noise
I - 735
➡
➠ reduction, correlation coefficients between clean & enhanced speech spectra and pattern completion error in Figures 4 (b), 4 (c) and 4 (d) respectively. • RNN enhancement resulted in a higher reduction in noise compared to spectral subtraction for all SNRs except 20 dB. The reason might be that RNN enhancement at high SNRs results in over estimation of the noise. • The correlation coefficient for RNN enhancement was also higher than spectral subtraction at all SNRs down to -5 dB. • Relative error with RNN enhancement was lower than spectral subtraction for all the SNRs. • The effect of cascading RNN enhancement with missing data masks (‘RNNENH+SNR mask’ curve) can be seen clearly in terms of noise reduction i.e., more than 16 dB for all input SNRs. The reason is that using missing data mask prevents the distortion in the spectrum in high SNR regions caused by RNN enhancement. The performance was higher for stationary noises than nonstationary noises like babble noise, recording on the street and at the airport. The reason is that RNN enhancement like most other enhancement methods performs better with stationary noise.
7. CONCLUSION AND FUTURE WORK
In this paper we have demonstrated the effectiveness of missing data techniques in neural speech enhancement. • Our results show that RNNs give better enhancement performance than traditional spectral subtraction and estimate an smoothed enhanced spectrum. • Using missing data masks to selectively enhance the speech helped to boost recognition accuracy of the RNN trained on clean speech. However, the performance improvement was more noticeable with the RNN trained on noisy speech. The results can further be improved by deriving more accurate missing data masks. The drawback of this approach is that it does not work well for non-stationary noises because RNN enhancement needs the noise to be stationary. Using a relatively large number of training samples associated with a particular nonstationary noise may increase the overall performance. Alternatively, the performance of an enhancement system can be improved by employing multiple nets trained on different noises/ SNRs and then applying some model switching method [7]. These ideas can also be extended using multitask learning [20] by defining additional targets at the output of RNN for each noise/ SNR in order to avoid switching problems.
8. ACKNOWLEDGEMENT This work was supported by Nokia Mobile Phones, Denmark and the UK Overseas Research Studentship scheme.
9. REFERENCES [1] Ephraim, Y. (1992). “Statistical-model-based speech enhancement systems.” Proceedings of the IEEE, vol. 80, no. 10, p. 1526-1555, October 1992. [2] Jones, M. and Sridharan, S. (1996). “Improving the effectiveness of existing noise reduction techniques using neural
networks.” In Proceedings of Fourth International Symposium on Signal Processing and its Applications, volume 1, p. 387-388. [3] Gaafar, M., Saleh, K. and Niranjan, M. (1998). “Speech enhancement in a Bayesian framework.” Proc. ICASSP 1998. [4] Berouti, M., Schwartz, R. and Makhoul, J. (1979). “Enhancement of speech corrupted by acoustic noise.” In ICASSP 1979, p. 208-211. [5] Lockwood, P. et al. (1991). “Noise reduction for speech enhancement in cars: Non-linear spectral subtraction/ Kalman filtering.” Proc. EUROSPEECH 1991. [6] Wan, E. A. and Nelson, A. T. (1998). “Networks for Speech Enhancement.” in Handbook of Neural Networks for Speech Processing, Boston, USA, Artech House, Eds. Shigeru Katagiri, 1998, ISBN: 0-89006-954-9. p. 541-541. [7] Tamura, S. and Nakamura, M. (1990). “Improvements to the noise reduction neural network.” Proc. ICASSP 1990, p. 825-828. [8] Moon, S. and Hwang, J.-N. (1993). “Coordinated training of noise removing networks.” In ICASSP 1993, vol. 1, p. 573-76. [9] Barker, J. et al. (2001). “Linking auditory scene analysis and robust ASR by missing data techniques.” Workshop on Innovation in Speech Processing 2001, Stratford-upon-Avon, UK. [10] Cooke, M. et al. (2001). “Robust automatic speech recognition with missing and unreliable acoustic data.” Speech Communication, vol. 34, no. 3, p.267-285. [11] Drygajlo, A. & El-Maliki, M. (1998). “Speaker verification in noisy environment with combined spectral subtraction and missing data theory.” Proc ICASSP 1998, vol. I, p. 121-124. [12] Raj, B., Seltzer, M., & Stern, R. (2000). “Reconstruction of damaged spectrographic features for robust speech recognition.” Proc. ICSLP 2000. [13] Palomäki K. J., Brown G. J. and Barker J. (2002). “Missing data speech recognition in reverberant conditions.” ICASSP 2002, Orlando, Florida, USA. [14] Parveen, S. and Green, P. (2001). “Speech Recognition with Missing data techniques using Recurrent Neural Networks.” Advances in Neural Information Processing Systems 14, (T.G. Dietterich, S. Becker and Z. Ghahramani eds.), MIT Press. [15] Parveen, S. and Green, P. (2003). “Multitask Learning in Connectionist Robust ASR using Recurrent Neural Networks.” EUROSPEECH 2003, Geneva, Switzerland. p. 1813-1816. [16] Elman, J.L. (1990). “Finding structure in time.” Cognitive Science, vol. 14, p. 179-211. [17] Werbos. P. J. (1990). “Backpropagation Through Time: What it does and how to do it.” Proceedings of the IEEE, vol. 78, no. 10, p. 1550-1560. [18] Pearce, D. and Hirsch, H.G. (2000). “The aurora experimental framework for the performance evaluation of speech recognition systems under noisy conditions.” In Proc. ICSLP 2000, Beijing, China. [19] Cooke, M.P. (1991). “Modelling Auditory Processing and organisation”. PhD thesis, Department of Computer Science, University of Sheffield. [20] Caruana, R. (1997). “Multitask Learning.” Machine Learning, PhD Thesis, CMU.
I - 736