International Journal of Exercise Science 10(7): 942-953, 2017. ... in Recovery Oxygen Consumption (ROC) resulting from high-intensity interval training (HIIT).
Original Research
Speed- and Circuit-Based High-Intensity Interval Training on Recovery Oxygen Consumption LINDSAY N. SCHLEPPENBACH*, ANDREAS B. EZER*, SARAH A. GRONEMUS*, KATELYN R. WIDENSKI*, SAORI I. BRAUN‡, JEFFREY M. JANOT‡ Department of Kinesiology, University of Wisconsin-Eau Claire, Eau Claire, WI, USA *Denotes undergraduate student author, ‡Denotes professional author
ABSTRACT International Journal of Exercise Science 10(7): 942-953, 2017. Due to the current obesity epidemic in the United States, there is growing interest in efficient, effective ways to increase energy expenditure and weight loss. Research has shown that high-intensity exercise elicits a higher Excess Post-Exercise Oxygen Consumption (EPOC) throughout the day compared to steady-state exercise. Currently, there is no single research study that examines the differences in Recovery Oxygen Consumption (ROC) resulting from high-intensity interval training (HIIT) modalities. The purpose of this study is to review the impact of circuit training (CT) and speed interval training (SIT), on ROC in both regular exercising and sedentary populations. A total of 26 participants were recruited from the UW-Eau Claire campus and divided into regularly exercising and sedentary groups, according to self-reported exercise participation status. Oxygen consumption was measured during and after two HIIT sessions and was used to estimate caloric expenditure. There was no significant difference in caloric expenditure during and after exercise among individuals who regularly exercise and individuals who are sedentary. There was also no significant difference in ROC between regular exercisers and sedentary or between SIT and CT. However, there was a significantly higher caloric expenditure in SIT vs. CT regardless of exercise status. It is recommended that individuals engage in SIT vs. CT when the goal is to maximize overall caloric expenditure. With respect to ROC, individuals can choose either modalities of HIIT to achieve similar effects on increased oxygen consumption post-exercise.
KEY WORDS: Energy expenditure, exercise participation status, portable O2 analyzer INTRODUCTION Prolonged sedentary behavior and obesity resulting from physical inactivity pose threats to individual health and contribute to a cascade of chronic conditions over the lifespan. The American College of Sports Medicine (ACSM) 2015 pre-participation screening guidelines
Int J Exerc Sci 10(7): 942-953, 2017 define an individual engaging in planned, structured physical activity for at least 30-min of aerobic exercise at moderate intensity on at least 3 days per week for at least the last 3 months, as a regular exerciser (16). This can be accumulated through ≥10-min bouts of exercise and contain both moderate and vigorous intensity activities (10). In today’s society, it has become a challenge to meet and/or exceed this criterion. One of the most commonly cited perceived barriers to exercise is the belief that exercise consumes too much time (7). Current findings show strong evidence in the association between physical inactivity and mortality from all causes including cardiovascular diseases (15). Therefore, Thorp and colleagues discussed the obesity and type II diabetes increase and concluded that physical activity levels, along with the detrimental effects of sedentary behavior, should be addressed (19). Previous research indicates that those with higher fat mass tend to be classified as sedentary individuals (5). According to Clapham, total daily energy expenditure (TDEE) is in relation to the total heat production in the body each day (5). Components of TDEE include resting metabolic rate (RMR), thermic effect of food (dietary component), thermogenesis from cold environments (shivering), and physical activity. RMR is the lowest rate of TDEE. It relates to the amount of fat free mass in the human body and may be used as a variable to determine obesity status. A low RMR in addition to low TDEE can contribute to weight gain. Clapham states that through the process of thermogenesis, heat drives the force in metabolism from oxygen consumption (VO2) (5). Physical activity is shown to be connected with 8-15% of TDEE and muscular activity induces thermogenesis (5). This can include walking, running, stair climbing, etc. Non-exercise activity thermogenesis (NEAT) can be displayed through subconscious physical activity such as fidgeting and upholding posture throughout the day. Those who have greater amounts of NEAT throughout the day tend have less fat gain and are less likely to over eat. These individuals who achieve NEAT and participate in regular physical activity are more likely to have an increased maximal VO2 than those who are physically inactive (5). The current research considers the direct relationship between maximal oxygen consumption (VO2max) and Recovery Oxygen Consumption (ROC). VO2max is the maximum rate of oxygen an individual consumes to supply their muscles and other organs with sufficient oxygen. According to Laforgia, Withers, and Gore, EPOC is referred to as an increased metabolism during recovery from a session of exercise (14). In an attempt to replenish the body and phosphagen system back to resting state, the oxygen rate within the body becomes elevated succeeding physical activity due to an increase in body temperature during exercise (14). Research also shows a relationship between exercise intensity and the extent of one’s EPOC for a given exercise duration (14). EPOC is increased exponentially as exercise intensity increases; as opposed to linear increase as exercise duration increases (14). In addition, according to Weston, Taylor, Batterham, and Hopkins, the same exercise intensity with high-intensity interval training (HIIT) elicits a higher VO2max than steady-state exercise in healthy, active adults (22). Since VO2max is directly correlated to intensity, a higher intensity elicits a higher EPOC (14). International Journal of Exercise Science
943
http://www.intjexersci.com
Int J Exerc Sci 10(7): 942-953, 2017
Previous research examines EPOC and energy expenditure and supports HIIT as a more effective, efficient form of exercise in comparison with steady-state exercise (e.g. endurance training) (22). In regards to energy expenditure, the duration of EPOC is shown to be similar between exercise intensities (17). The importance and relevance of HIIT is addressed through recent evidence on the benefits in relation to health outcomes. However, there is little research done within various modalities of HIIT (e.g. treadmill, elliptical, stationary cycling) and more research is needed to assess the effectiveness of different modalities on ROC. The purpose of this study was to review the impact of two HIIT modalities, circuit training (CT) and speed interval training (SIT), on ROC in those who exercise regularly and those who are sedentary. The results of this study may offer alternative methods of exercise for individuals who suffer from excess weight and have little free time to effectively and efficiently expend enough energy to assist them in their weight loss goals. It was hypothesized that there would be a greater response of ROC in physically inactive populations compared to physically active populations due to lower levels of training and familiarity of elevated exercise intensities (22). Between the various modalities, the participants will most likely not be accustomed to performing CT compared to the self-propelled treadmill SIT. Therefore, the participants will experience a higher ROC after CT because there is a lack in body movement efficiency, which will require more energy and oxygen (18). METHODS Participants Participants in the study included 32 males and females, ages 18-30 years. Sample size was determined through a pre-study power analysis calculation in G-Power. The original sample size, before dropouts occurred were 16 subjects for each group. All of the volunteers completed the Physical Activity Readiness Questionnaire to ensure that participants were eligible to participate in this study. None of the initial participants answered “yes” on potential heart related, joint or bone complications, were on medications for specific heart conditions or blood pressure. Therefore, medical consent was not necessary to participate in the study. In total 6 individuals withdrew from participating in the study prior to initial testing. Among 26 remaining participants, 16 individuals who achieved the ACSM’s 2015 definition of regular exercise participation of 30-min of moderate-intensity activity, 3 times a week, for the last 3 months (16) were classified as regular exercisers, and 10 individuals who did not meet the guidelines were classified as sedentary. Institutional Review Board approval was obtained for the proposed study protocol and an informed consent was signed by each participant prior to participation. Protocol Since equipment training was required, qualified investigators administered the test to ensure validity of the data collected. The Cosmed K4b2 (COSMED Inc., Rome Italy) cardiopulmonary exercise testing equipment was calibrated before each exercise testing session. This consisted of reference air calibration, turbine calibration, and O2/CO2 delay to synchronize participant’s International Journal of Exercise Science
944
http://www.intjexersci.com
Int J Exerc Sci 10(7): 942-953, 2017 breath to a constant rate provided. Participant’s demographic information was entered in the patient data section, which included age, sex, height (in.), and weight (lbs.). Relative humidity percentage of the room was entered for instrumentation purposes, and room air calibration was completed. Validity of the real-time breath-by-breath values, including VO2, respiratory exchange ratio, and heart rate (HR), were checked immediately before testing began. “Enter” was pressed to begin data collection. During the data collection, the “marker” button was pressed when participant stopped exercise and started passive rest. All data were downloaded to an Excel spreadsheet on the laboratory personal computer. The Polar T-31 Transmitter (Polar Electro Oy, Kempele Finland) heart rate monitor was used to measure participant’s heart rate during exercise. Maximum heart rate (HRmax) was calculated through the Gellish formula [(HRmax= 207-(.7 x age)]. Each participant was required to reach 85% of their heart rate reserve (HRR) during high-intensity interval sessions (14). HHR was measured through the formula: [Exercise HR = % of target intensity (HRmax – HRrest) + HRrest ]. The study consisted of three meeting times. The first meeting served as an orientation where participants reviewed the informed consent/cover letter and were informed of expectations for the study. An initial assessment was conducted by obtaining resting heart rate to configure predicted HRmax values and 85% of HRR. Participants wore lightweight clothing for height and weight measurements. These measurements were recorded for references in equipment use. Participants received the opportunity to become familiarized with both self-propelled treadmill SIT and CT exercises, minimizing the “first-day effect.” Participants in this study were recommended to refrain from exercise and consuming caffeine, alcohol, and illegal, non-prescription drugs 24-hrs prior and fast for at least 3-hrs prior to the exercise session (12). Text message reminders were sent out prior to testing to remind participants to adhere to dietary considerations. The first exercise session each participant completed, either SIT or CT, was randomized to control for the carry over effect and increased familiarity with wearing the Cosmed during exercise. The participants completed the alternative modality for their last session. SIT took place in the fitness facility on campus, while CT was completed in the racquetball rooms. Cosmed technology was calibrated before each test to ensure validity. The masks and head strap were fitted appropriately for each participant. The two sessions were approximately one hour in duration. At least a 72-hr rest between sessions was implemented to allow a full recovery (21). After each session was complete and each participant was about to begin ROC collection, time was noted on log in order to confirm the beginning on ROC on raw data collection. Finally, the data was downloaded onto a computer. The VO2 was averaged for 1min intervals and added to obtain the sum for both oxygen consumption during exercise and ROC. Using the caloric estimation formula of [(VO2/1000) *5], VO2 was converted from mL.min-1 to caloric expenditure (kcals) (4, 19, 23). Before each session, participants completed a 5-min warm up. The exercise protocol for both modalities followed a 1:1 exercise to rest ratio (2) with ten 30-sec bouts of exercise interspersed International Journal of Exercise Science
945
http://www.intjexersci.com
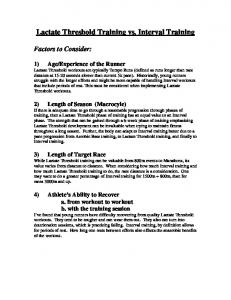
Int J Exerc Sci 10(7): 942-953, 2017 with 30-sec of active rest. Altogether, each exercise session consisted of 10-min of HIIT exercise. For both exercise sessions, participants were required to reach at least 85% of their HRR during the 30-sec exercise bouts (11). After each high-intensity interval, HR and rate of perceived exertion (RPE) were recorded. RPE was used as a subjective measurement of intensity and the 1-10 scale was chosen because it consisted of a rating scale that would be familiar to most participants (3). Verbal encouragement was given during the exercise session to motivate participants throughout the test. Within 30-sec after completing the 10-min exercise session, participants laid down in the supine position for 30-min of passive recovery to collect resting ROC (4, 9, 18). Speed Interval-Training - This routine consisted of ten 30-sec running bouts on a self-propelled treadmill, with 30-sec of active recovery interspersed. The active recovery consisted of slow walking on the treadmill. For this modality, speed was also recorded after each running interval, along with heart rate and RPE. Refer to Figure 1 for visual depiction of SIT.
Figure 1. Speed interval-training.
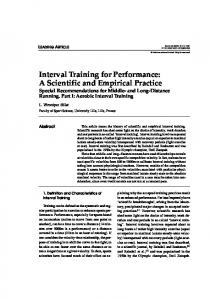
Figure 2. Circuit-training, star jump.
Circuit-Training - The CT session consisted of completing five total aerobic-based exercises, which included star jumps, high knees, burpees, line jumps, and wall taps. Each exercise was completed for 30-sec followed by 30-sec active recovery of walking around the room. These five exercises were performed twice to complete the 10-min circuit. Refer to Figure 2 for a visual depiction of one of the exercises of CT. See Figure 3 for the order in which exercises were engaged during CT. International Journal of Exercise Science
946
http://www.intjexersci.com
Int J Exerc Sci 10(7): 942-953, 2017
Figure 3. Circuit training protocol.
Statistical Analysis A 2x2 factorial repeated measures analysis of variance (RM ANOVA) was employed using SPSS software to analyze the collected data using a significance level of ≤0.05. Oxygen consumption during exercise and ROC measurements were compared between exercise participation status (regular exercise and sedentary). Oxygen consumption during exercise and ROC measurements were also compared between the two different HIIT modalities (SIT and CT). Independent variables in this study included exercise modalities (SIT and CT) and exercise participation status (regular exercise and sedentary). Dependent variables included oxygen consumption and caloric energy expenditure during exercise and post exercise. As a preliminary analysis to examine the difference in weight between regular exercises and sedentary individuals, Independent samples t-test was employed. There was no statistical International Journal of Exercise Science
947
http://www.intjexersci.com
Int J Exerc Sci 10(7): 942-953, 2017 difference in weight between regular exercisers and sedentary group; therefore, weight was not included as a covariate in the two-way repeated measures ANOVAs. RESULTS A total of 26 participants made up the sample size. Data from four participants in the Regular Exerciser group needed to be excluded from analysis because of equipment malfunction or participant’s inability to continue the entire session. Refer to Table 1 for sample characteristics. Table 1. Sample characteristics. Regular Exercise Sedentary Total (n = 12) (n = 10) (N = 22) M ± SD M ± SD M ± SD Age (years) 20.69 ± 1.37 22.20 ± 3.55 21.36 ± 2.65 Height (inches) 67.41 ± 4.07 68.55 ± 3.15 67.93 ± 3.64 Weight (pounds) 159.42 ± 26.87 173.25 ± 45.18 165.71 ± 36.09 HRrest(bpm) 66.17 ± 5.56 70.90 ± 4.82 68.32 ± 5.65 85% HRR (bpm) 174.00 ± 2.17 173.40 ± 2.63 173.73 ± 2.35 % (n) % (n) % (n) Male 41.7 (5) 20.0 (2) 31.8 (7) Female 58.3 (7) 80.0 (8) 68.2 (15) *Note. Values are presented in mean ± standard deviation for continuous variables and in percentage for categorical variable(s); bpm = beats per minutes; HRR = heart rate reserve; HRrest = resting heart rate.
In terms of VO2 during exercise, a two-way RM ANOVA indicated no interaction between modality and exercise participation status, F(1,20) = 1.68, p = 0.209. There was a statistical difference in VO2 during exercise between SIT and CT modalities, F(1,20) = 8.15, p =0.010. There was no difference in VO2 during exercise between regular exercisers and sedentary participants, F(1,20) = 0.001, p = 0.975. Table 2. Means and standard errors of oxygen consumption (VO2) during and post-exercise by groups. 95% Confidence Interval Group During exercise
Modality
Mean
SE
Lower Bound
Upper Bound
Regular Exercise
SIT CT SIT CT
19.761 13.65 17.911 15.62
1.72 1.62 1.87 1.78
16.19 10.26 14.01 11.91
23.32 17.04 21.82 19.33
Sedentary Post-exercise Regular Exercise
SIT 14.70 1.52 11.52 17.88 CT 12.94 2.18 8.39 17.49 Sedentary SIT 13.50 1.67 10.02 16.99 CT 13.47 2.39 8.48 18.45 *Note: VO2 values are in L/10min of exercise; SIT = Speed Interval Training; CT = Circuit Training; 1Denotes significant difference between SIT and CT. VO2 values post exercise are in L/30 minute recovery phase.
With respect to VO2 post- exercise, there was no difference between SIT and CT modalities as well as between regular exercisers and sedentary participants, F(1,20) = 0.30, p = 0.592 and International Journal of Exercise Science
948
http://www.intjexersci.com
Int J Exerc Sci 10(7): 942-953, 2017 F(1,20) = 0.02, p = 0.885, respectively. Refer to Table 2 for means and standard errors of results for VO2 during and post-exercise. Another two-way RM ANOVA indicated no significant interaction between modalities and exercise participation status impacting on caloric expenditure during exercise, F(1,20) = 1.68, p = 0.209. While there was no difference in caloric expenditure during exercise between regular exercisers and sedentary, F(1,20) = 0.001, p = 0.975, there was a difference in caloric expenditure during exercise between the two modalities, F(1,20) = 8.15, p = 0.010. More specifically, the SIT modality displayed significantly greater caloric expenditure during exercise than the CT modality. In terms of caloric expenditure post-exercise, the two-way repeated measures ANOVA indicated modality (SIT, CT) and group (regular exercise, sedentary) were not significant predictors of caloric expenditure post-exercise, F(1,20) = 0.30 p = .592 and F(1,20) = 0.22, p = 0.885, respectively. In addition, no significant interaction effect was evident, F(1,20) = 0.27, p = 0.607. Refer to Table 3 for means and standard errors of caloric expenditure during and postexercise. Table 3. Means and standard errors of caloric expenditure (Kcals) during and post- exercise by groups 95% Confidence Interval Group During exercise
Modality
Mean
SE
Lower Bound
Upper Bound
Regular Exercise
SIT CT SIT CT
98.79 68.25 89.57 78.10
25.64 26.45 33.83 30.06
80.96 51.31 70.04 59.55
116.61 85.19 109.10 96.66
Sedentary Post-exercise Regular Exercise
SIT 73.49 21.20 57.60 89.38 CT 64.68 44.43 41.93 87.43 Sedentary SIT 67.52 31.60 50.11 84.93 CT 67.33 27.54 42.42 92.25 *Note: Kcals calculated from VO2 (mL.min-1/1000)5; SIT = Speed Interval Training; CT = Circuit Training; SE=Standard Error; There was a significant main effect of modality on energy expenditure during exercise.
With respect to the highest rate of perceived exertion reported during SIT and CT, there was a significant interaction between exercise status and modality, F(1,24) = 4.88, p = 0.037. Therefore, data were split by exercise status, and paired samples t test was employed to explore whether or not difference in RPE existed between SIT and CT for each group. While no difference in RPE existed between SIT (7.20 ± 1.40) and CT (7.50 ± 1.08) for the sedentary group, t(9) = 0.90, p = 0.394; among the regular exercisers, RPE reported during SIT (7.25 ± 1.18) was significantly higher than during CT (6.56 ± 1.63), t(15) = 2.42, p = 0.029. Mean ± SD highest %HRR achieved during exercise was 96.7 ± 6.44% for SIT and 93.31 ± 5.95% for CT. When comparing %HRR achieved during exercise between SIT and CT, a two-way RM ANOVA indicated a greater %HRR during SIT than during CT. There was no main effect of
International Journal of Exercise Science
949
http://www.intjexersci.com
Int J Exerc Sci 10(7): 942-953, 2017 exercise status on %HRR. No interaction effect was seen. See Table 4 for means and standard errors of %HRR achieved during SIT and CT by groups. Table 4. Means and standard errors of percent heart rate reserve during exercise by groups. 95% Confidence Interval Group Regular Exercise
Modality Mean SE Lower Bound Upper Bound SIT 95.55 1.60 92.26 98.85 CT 91.60 1.41 88.69 94.51 Sedentary SIT 98.58 2.02 94.41 102.75 CT 96.06 1.78 92.38 99.74 *Note: SIT = Speed Interval Training; CT = Circuit Training; SE=Standard Error; There was a significant main effect for modality (marginal means for SIT was significantly greater than CT).
DISCUSSION The current study incorporates both SIT and CT to elicit a ROC response with the intent of identifying which HIIT modality would be the most efficient form of exercise in regards to caloric expenditure. The main finding of this study is that there is no significant difference in ROC between groups (regular exercise vs. sedentary) or HIIT modalities (SIT vs. CT). However, significance is shown for SIT expending a greater amount of kcals during exercise when compared to CT in both regular exercise and sedentary groups. Means and standard deviations of caloric expenditure for regular exercisers during SIT were 98.79 ± 25.64 kcals; during CT for regular exercisers were 68.25 ± 26.45 kcals; during SIT for sedentary individuals were 89.57 ± 33.83 kcals; during CT for sedentary individuals were 78.10 ± 30.06 kcals. Means and standard deviations for regular exercisers during SIT ROC were 73.49 ± 21.20 kcals; regular exercisers during CT ROC were 64.68 ± 44.43 kcals; sedentary group during SIT EPOC were 67.52 ± 31.60 kcals; sedentary group during CT ROC were 67.33 ± 27.54 kcals. Previous studies indicate that ROC increases exponentially as exercise intensity increases (14). Additionally, research specifies HIIT to be a more effective and efficient form of exercise in relation to energy expenditure when compared to steady-state exercise (19). The HIIT protocols for both SIT and CT include a 1:1 ratio of 30-sec of exercise followed by 30sec of active rest for a total of 10-min. The SIT protocol include speed training on a selfpropelled treadmill, while the CT protocol included five exercises: star jumps, high knees, burpees, line jumps, and wall taps. During the HIIT exercise sessions, there is significance between modalities, where both groups burn more calories during SIT rather than CT. Initially, the hypothesis of this current study and prior research stated that CT would burn more calories than SIT. This was predicted because CT would require more whole body movement and muscle usage. The results from the current study could be a reflection of participants’ inability to maintain their initial intensity throughout the entire 30-sec workout intervals. Prior research conducted by Elmer and colleagues shows that central fatigue is restored more quickly than peripheral fatigue (8). Central fatigue occurs due to failure of the central nervous system to excite motor neurons (8). This relates to the current study findings in that peripheral fatigue in the muscles International Journal of Exercise Science
950
http://www.intjexersci.com
Int J Exerc Sci 10(7): 942-953, 2017 induced by CT exercises may have elicited central fatigue, which at that time, limited the participants from continuously engaging in exercise and sustaining intensity. It is speculated that the SIT during exercise results in greater caloric expenditure due to less muscular fatigue compared to CT. The SIT protocol seems to be a much more natural movement for the participants and may not have been affected by local muscle fatigue as much as CT. As a result, the participants were able to push themselves harder to the point of cardiovascular strain, instead of muscular fatigue, during SIT. Additionally, Dempsey and colleagues concluded that peripheral (localized) muscle fatigue during heavy, intense exercise caused cardiovascular limitations to exercise performance (6). Anecdotally, multiple participants qualitatively stated that SIT elicited a greater cardiovascular response, whereas CT elicited more of a localized muscular fatigue due to the multiple bouts of jumping movements. This resulted in a lower VO2, thus a lower caloric expenditure in CT than during SIT. The hypothesis of the current study regarding ROC relates to prior research which states that a higher intensity during exercise results in a higher EPOC. For instance, prior research shows that there is a relationship between exercise intensity and the extent of one’s EPOC for certain exercise durations, such that EPOC is increased exponentially as exercise intensity increases, as opposed to linearly increased as exercise duration increases (14). The current study found that SIT displayed a greater caloric expenditure during exercise. The increases in energy expenditure during high intensity interval training sessions could be explained by Kelly, King, Goerlach, and Nimmo, who found that energy expenditure increases during a single HIT session; however, the increase in metabolic rate after exercise is relatively insignificant (12). This study shows that HIIT influence energy expenditure and respiratory exchange ratio solely during exercise and not after. Changes in metabolic rate diminish rapidly after exercise. In addition, these findings are consistent with conclusions drawn by Townsend, Couture, and Hazell in which there was no difference in EPOC between running and cycling SIT (21). Ultimately, the results indicate that speed interval-training, as a form of HIIT, is a more effective way of maximizing caloric expenditure than circuit-based HIIT. The results can be applied to most individuals who encounter challenges to meet and/or exceed the 2015 ACSM exercise guidelines of performing planned, structured physical activity for at least 30 min of aerobic exercise at moderate intensity on at least 3 days per week (16). This can be accumulated through ≥10-min bouts of exercise that contain both moderate and vigorous intensity activities (10). By performing multiple 10-min bouts of feasible HIIT modality such as SIT or CT, individuals will be able to meet these requirements and decrease their risk for allcause mortality, including cardiovascular disease (15). This is one of few known studies to compare two different HIIT modalities on energy expenditure, as an extension to comparing HIIT and steady-state exercise. The use of the portable O2 analyzer allows for oxygen consumption during exercise and collection of ROC immediately after exercise. In addition, it provides a unique contribution to the literature
International Journal of Exercise Science
951
http://www.intjexersci.com
Int J Exerc Sci 10(7): 942-953, 2017 because many previous studies involving HIIT and ROC have had a smaller sample size compared to this current study. Although this study contributes to the literature by adding insight on different HIIT modalities and their effect on energy expenditure, there are some limitations to be noted. Caloric expenditure was estimated using the predictive equation [VO2 (mL.min-1)/1000)5] (19, 23). Future studies could use respiratory exchange ratio to more accurately calculate caloric expenditure. In addition, sedentary participants, in particular, stated it felt uncomfortable due to being unfamiliar with the self-propelled treadmill. Researchers attempted to minimize the “first-day effect” by familiarizing participants with the self-propelled treadmill during the orientation session; however, it was not effective among all individuals. In addition, an agepredicted HRmax formula (Gellish) was used to regulate intensity at 85% HRR. A more accurate measure of HRmax would include having each participant complete a VO2max test to obtain their true HRmax. Lastly, increased sample size and a larger range of population (i.e., more than just college students) would have further strengthened our study. Overall, this study found increased energy expenditure during SIT exercise as compared to CT. There was no significant influence of SIT vs. CT on ROC; therefore, to accomplish the most efficient workout to maximize overall caloric expenditure, SIT would be suggested. From a practical standpoint, one could achieve the 2015 ACSM requirements for being a regular exerciser (30-min of moderate-intensity exercise, 3 days per week) by accumulating 3 bouts of 10-min HIIT in a day. REFERENCES 1. American College of Sports Medicine. ACSM's guidelines for exercise testing and prescription. 9th ed. Philadelphia: Wolters Kluwer/Lippincott Williams & Wilkins Health; 2014. 2. Baudry S, Roux P. Specific circuit training in young judokas: Effects of rest duration. Res Q Exerc Sport 80(2): 146-152, 2009. 3. Borg G. Psychophysical bases of perceived exertion. Med Sci Sports Exerc, 14(5): 377-381, 1982. 4. Bryant C, Comana F, Porcari J. Exercise physiology. Philadelphia (Pa): F.A. Davis Company; 2015. 5. Clapham JC. Center control for thermogenesis. Neuropharmacology 63(1): 111-123, 2012. 6. Dempsey JA, Romer L, Rodman J, Miller J, Smith C. Consequences of exercise-induced respiratory muscle work. Respir Physiol Neurobiol 151(2-3) 242-250, 2006. 7. Donovan S, Walters-Edwards M, McPartland L, Nicholson S, Walters L. Perceived barriers to exercise in overweight and obese adults on a university campus. Med Sci Sports Exerc 42(5): 564, 2010. 8. Elmer SJ, Leon CH, Marshall CS, Wehmanen K, Amann M, Martin JC. Effect of central and peripheral fatigue on maximal voluntary function. Med Sci Sports Med 43(5):35, 2011. 9. Farinatti P, Catinheiras Neto AG, Amorim PRS. Oxygen consumption and substrate utilization during and after resistance exercises performed with different muscle mass. Int J Exerc Sci 9(1): 77-88, 2016.
International Journal of Exercise Science
952
http://www.intjexersci.com
Int J Exerc Sci 10(7): 942-953, 2017
10. Garber CE, Blissmer B, Deschenes MR, Franklin BA, Lamonte MJ, Lee IM, Nieman DC, Swain DP. American College of Sports Medicine Position Stand. The quantity and quality of exercise for developing and maintaining cardiorespiratory, musculoskeletal, and neuromotor fitness in apparently healthy adults: guidance for prescribing exercise. Med Sci Sports Exerc 43(7): 1334-1359, 2011. 11. Henry RN, Anshel MH, Michael T. Effects of aerobic and circuit training on fitness and body image among women. Journal of Sport Behavior 29(4): 281-303, 2006. 12. Kelly B, King JA, Goerlach J, Nimmo MA. The impact of high-intensity intermittent exercise on resting metabolic rate in healthy males. Eur J Appl Physiol 113(12): 3039-3047, 2013. 13. Laforgia J, Withers RT, Shipp NJ, Gore CJ. Comparison of energy expenditure elevations after submaximal and supramaximal running. J Appl Physiol 82: 661-666, 1997. 14. Laforgia J, Withers RT, Gore CJ. Effects of exercise intensity and duration on the excess post-exercise oxygen consumption. J Sports Sci 24(12): 1247-1264, 2006. 15. Proper KI, Singh AS, Van Mechelen W, Chinapaw MJM. Sedentary behaviors and health outcomes among adults: A systematic review of prospective students. Am J Prev Med 40(2): 174-182, 2011. 16. Riebe D, Franklin B, Thompson P, Garber C, Witfield G, Magal M, Pescatello L. Updating ACSM’s Recommendations for Exercise Preparticipation Health Screenings. Med Sci Sports Exerc 47(11): 2473-2478, 2015. 17. Sedlock DA, Fissinger JA, Melby CL. Effect of exercise intensity and duration on post exercise energy expenditure. Med Sci Sport Exerc 21 (6): 662-666, 1989. 18. Sparrow WA, Newell KM. Metabolic energy expenditure and the regulation of movement economy. Psychonomic Bulletin & Review 5(2): 173-196, 1998. 19. Thornton KM, Potteiger JA. Effects of resistance exercise bouts of different intensities but equal work on EPOC. Med Sci Sports Exerc 34(4): 715-722, 2002. 20. Thorp AA, Owen N, Neuhaus M, Dunstan DW. Sedentary behaviors and subsequent health outcomes in adults. Am J Prev Med 41(2): 207-215, 2011. 21. Townsend LK, Couture KM, Hazell TJ. Mode of exercise and sex are not important for oxygen consumption during and in recovery from sprint interval training. Appl Physiol Nutr and Metab 39(12): 1388, 2014. 22. Weston M, Taylor KL, Batterham AM, Hopkins WG. Effects of low-volume high-intensity interval training (HIT) on fitness in adults: A meta-analysis of controlled and non-controlled trials. Sports Med 44(7): 1005-1017, 2014. 23. Williams CB, Zelt JGE, Catellani LN, Little JP, Jung ME, Wright DC, Tschakovsky ME, Gurd BJ. Changes in mechanisms proposed to mediate fat loss following an acute bout of high-intensity interval and endurance exercise. Appl Physiol Nutr Metab 38: 1236–1244, 2013.
International Journal of Exercise Science
953
http://www.intjexersci.com