reduction methods in the DDS will be presented: modifi- cated Nicholas phase accumulator, a high-pass filtered am- plitude dither and a tunable amplitude error ...
1996 IEEE INTERNATIONAL FREQUENCY CONTROL SYMPOSIUM SPUR REDUCTION TECHNIQUES IN SINE OUTPUT DIRECT DIGITAL SYNTHESIS Jouko Vankka Laboratory of Signal Processing and Computer Technology Helsinki University of Technology, Otakaari 5A, FIN42150 Espoo, Finland
Abstract: This paper reviews the spur reduction techniques usedinthe sine output direct digital synthesizers (DDSs). In each method the spur reduction properties and trade-offs are investigated. The analysis is restricted only to phase and amplitude quantization errors. Three novel spur reduction methods in the DDS will be presented: modificated Nicholas phase accumulator, a high-pass filtered amplitude dither and a tunable amplitude error feedback structure.
quencycouldbeanyfrequency up to somewhatbelowthe Nyquist frequency. The coefficients of the EF aretuned according to the output frequency.
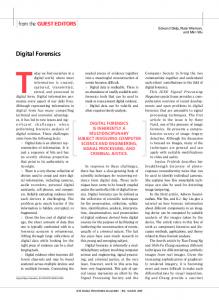
Conventional Direct Dieital Svnthesizer The direct digital frequency synthesizer is shown in a simplified form in Figure 1. The digital input phase increment is entered in the frequency register. At each clock pulse this data is added to the data previously held in the phase register. The phase accumulator operates on the principle of the overflow arithmetic. The rate of the overflows is the output frequency
Introduction The drawback of the direct digital synthesizer (DDS) is the high level of spurious frequencies [l]. In this paper we only concentrate on the spurs, that are caused by the finite wordlength representation of phase and amplitude samples. The numberofwords in the ROM (phase to amplitude converter) will determine the phase quantization error, while the number of the bits in the digital-to-analog converter (D/A-converter) affects amplitude quantization. Therefore, it is desirable to increase the resolution of the ROM and D/A-converter. Unfortunately, larger ROM and D/A-converter resolutions mean higher power consumption, lower reliability, lower speed, and greatly increased costs. Additional digital techniques maybe incorporated in the DDS in order to reduce the presence of spurious signals at the DDS output. Nonsubtractive dither is used to destroy the coherence of the undesired spurious components, but the penalty is that the broadband noise level is quite high after dithering [ l ] , [2]. The novel spur reduction technique in the DDS presented in thispaperuseshigh-pass filtered dither [3], [4], which has most of its powerinanunused spectral region between the band edge of the low-pass filter and the Nyquist frequency. After the DDS output has been passed through the lowpass filter, only a fraction of the dither power will remain. The error feedback (EF) technique is used to suppress low frequencyquantization spurs [5], [ 6 ] . The drawback of conventional EF structures is that the output frequency is low with respect to the clock frequency. This is necessary, because the transfer function of the EF has zero(s) at DC. In the proposed architecture the clock frequencyneedonlybemuchgreater than the bandwidth of the output signal, whereas the output fre-
Figure I . Simplified blockdiagram synthesizer.
where A@ is the phase increment, j is the number of accumulator bits, fc,k is the clock frequencyand f,,, is theoutput frequency. The constraint in (1) comes from the sampling theorem. The magnitude of the phase increment can occur only in the integer values, therefore the frequency resolution is
fdk ~$f=-,(A$=l). 2J
The Read Only Memory (ROM) is a sine lookup table which converts the phase information, in digital form, into the values of a sine wave. In the ideal case of infinite precision of the phase and no amplitude quantization, the output sequence of the table is given by
where &I) is a phase register value. The numerical period of the phase accumulator output sequence is defined as the minimum value of P for which @n) = $(n+P) for all n. The numerical period of the phase accumulator sequence is P=
GCD ( A @ ,2 ’ ) ’
(4)
where GCD (A@,2 j ) represents the greatest common divisor of A@ and 2 l . The numericalperiod of the sequence samples recalled from the sine ROM will have the samevalue as the numerical period of the sequence generated by the phase accumulator [7]. Therefore, the spectrum of the output waveform of
Figure 2 . Block diagram of the sources of noise and spurs.
o f the directdigital
95 1 0-7803-3309-8/96 $ 5 . 0 0 0 1996 IEEE
2J
the DDS prior to digital-to-analog conversion is characterized by a discrete spectrum consisting of P points. The ROM output is presented tothe D/A-converter, which develops a quantitized analog sine wave. The filter removes the high frequency s a m pling components and provides a pure sine wave output. As the DDS generates frequencies close to f c k 12, the fiist image ( f c [ k -f,,,) becomesmore difficult to filter. Therefore, the DDS operation is limited to approximately 40 percent of the clock frequency, in practice.
In the second case, there will be no quantization errors if the samples match exactly the quantization levels, g., e. f,, = f, /4.The assumption that the error is evenly distributed in one period is really not valid due to the short period. However, simulations indicate that in general the sumof the discrete spurs is approximately equal to
(7)
Sources of Noise and S D U ~inS DDS The model of thenoiseand spurs in the DDS hassix sources. These sources are depicted symbolically in Figure 2. The sources are: the truncation of the phase accumulator bits addressing the sine ROM (ep), a distortion from compressing the sine ROM (eCoM),the finite precision of the sine samples stored in the ROM (eA),the digital-to-analog conversion (eDA), a smoothing filter (eF), the phase noise of the clock frequency ),n( andthe frequency error (40. Thefrequency error causes a frequency offset (2), but not noise and spurs. The source ep is due to the truncation of the phase accumulator bits addressing the sine ROM. Since the amount of memory required to encode the entire width of the phase accumulator would be usually prohibitive, only k of the most significant bits of the accumulator output are generally used to calculate the sine-wave samples. The worst case carrier-to-spur ratio due to the phase truncation is [7]
(m
(:)-
=2'Sinc
[
GCD(Ag'2i-k I), if GCD (A),2i) 2j-t, 21-k
(5)
where GCD (A@,2J-k ) denotes the greatest common divisor of A@ and 2 J - k . The phase truncation occurs only, whenGCD (A& 2 j ) is smaller than 2j-'. If GCD (A@,2 j ) is equal or greater than 2J-k , then the phase bits are zeros below 2J-k , no phase error occurs. The source eAis introduced by the finite precision of the sine samples stored in the ROM. The sequence of the ROM quantization errors is periodic, repeating every P samples. There are two limiting cases to consider: the numerical period of the output sequence (P)is either long or short. In the first case, the quantization error results inwhat appears to be a white noise floor, but is actually a "sea" of very finely spaced discrete spurs. The signal power of the sine wave is A2/2, where A is the amplitude of the sine wave. When the amplitude error isevenly
This is approximately true even for foul = f c [ k / 8, where the quantization error power is primarily concentrated into just one spur, the third harmonic of the output frequency (Figure 9). A computer program has been created to simulate the DDS in Figure 1. with different spur reduction techniques. All spectra presented in this paper have been generated using a 4096 point FFT. The number of samples has been chosen to bean integer number of cycles in the time record (and equal to the period of the dither source) that problems of leakage in the FFT-analysis can be avoided and unwindowed data can be used (except chapter Tunable &or FeedbackinDDSwhereHanning window is used).
Modificated Nicholas Phase Accumulator This methoddoes not destroy the periodicity of the error sequences, but it spreads the spur power into many spur peaks [7].If GCD (A@,2J-k ) is equal 2j-k-1 in (5). the spur power is concentrated in one peak (Figure 4). Then the worst case carrier-to-spur ratio is from ( 5 ) ($)=(6.02k
- 3.992) dBc,
(8)
where k iswordlength of phase accumulator output used to (A@,2J-k ) is equal to 1, the spur address the ROM. If GCD power is spread over many peaks (Figure 5). Then the carrierto-spur ratio is approximately from (5)
(9) Comparing (8) and (9) shows that the worst case spur can be reduced in magnitude by 3.922 dB by forcing GCD (A@,2j-k ) to be unity, i.e., by forcing the frequency command word to be relatively prime to 2'-'. This causes the phase accumulator output sequence tohave a maximal numerical period for all
distributed over [-AA/2,AA/2), the 2
amplitude error power is A A/12, where AA = 2-m, A = ]h, and m is the wordlength of the sine values stored in the ROM. The DDS output is an odd function therefore the spectrum of the amplitude error only contains odd frequency components (P/2 spurs). The sinusoid generated is a real signal, so its poweris equally divided into negative and positive frequency components. Using these facts and assuming the error to be evenly distributed in one period, the ratio of the carrierto-spur power spectral density is given by
952
I-
Figure 3. The hardware modification to force optional GCD (A@,2'-'+' ) = l .
that the dither signal is canceled during the next sample, otherwise the dither will be accumulated in the phase accumulator and there will befrequency modulation. The circuit will be complex due to the previous dither sample canceling, therefore this method is beyondthe scope of this paper. It is important that the period of the evenly distributed dither source ( L ) satisfies (A2/ 6 L ) P-, where P,, is themaximum acceptable spur power, and A is the step size forboth amplitude and phase quantization [2]. In this paper first order dither signals (evenly distributed) are considered. Theuse of higherorder dither accelerates phasespurreduction with the floor [2], penalty of morecomplex circuit andhighernoise
values of A@ i.e., all possible values of the phase accumulator output sequence are generated, before any values are repeated. It too has an effect of randomizing the errors introduced by the quantizied ROM samples, because in a long output period the error appears as “white noise” (6). If there is no phase huncation error in the original samples (GCD (A4.2’) 2 2J-k ), then this forcing will make the situation worse for the phase error. Therefore, it is good that this spur reduction method is optional depending on the frequency control word. In Figure 3 for reset = 1 , the carry input toggles between 0 and 1 periodically, with the equivalent effect adding !4 LSB weight to the phase accumulator. This modifies the existing j bit phase accumulator structure to emulate the operation of a phase accumulator with a word length of j+l bits under the assumption that the least significant bitof the frequency control word is one. The disadvantage of adding ‘A LSB is that it introduces an offset of fofi,,, = fclk /2J+’ into the output frequency of the DDS. For reset = 0 (and carry input = 0), the phase accumulator operates normally. In the Nicholas phase accumulator the bit below the least significant bit is always one [7].
Figure 6. Different ways of dithering in the DDS.
Nonsubtractive Dither
Nonsubtractive Phase Dither An evenly distributed random quantity (source 2 in Figure 6.) is added to the phase address prior to the phase truncation [2], [9], then the output sequence of the DDS is given by 2n s i n ( - ( A ~ n - e p ( n ) + z p ( n ) ) )- eA(n), (10) 2J where z,(n) is the phase dither evenly distributed on [0, 2kk ), e,(n) is the error associated with the phase truncation and e,(n) is the quantization error due to the finite ROM data word. The analysis reported in [2] reveals that worst case carrierto-phase spur ratio is
In this section methods of reducing the spurs by destroying the periodicity of the error sequence will be represented. The correlation between the quantization errors can be removed by the addition of a random dither to the sine wave. The random word reduces spurious sidebands, because it randomizes the behavior associated with the quantization process, thereby destroying the coherence of the error term, which is necessary to produce the spurious sidebands. There are different ways to dither: some designs have dithered the frequency control word [g], the address of the sine wave table [9], [lo] and the sinewave amplitude [2], [ l l ] , [l21 with pseudo random numbers in order to randomize the phase or amplitude quantization error. The dither is summed with the frequency control word in the square wave output DDS [g]. The technique could be applied for sine output DDS (source 1 in Figure 6.), too. It is important
[:]=(12.04t-7.84)
dBc, whenGCD(A0,2i-L)=2J-k-1,(11)
when the evenly distributed dither is applied. The phase dithering provides for an acceleration beyond the normal 6 dB per
POWERSPECTRUM
F%OUENCY (k]
x 10’
Figure 4. Spur due to the phase truncation, m.carrier-tospur ratio 44.24 dBc (44.17 &c (8)). Simulation parameters: j = 12, k = 8,m = 10. A4 = 264, fclk = I MHz. four = 64453 Hz.
953
Figure 5. Spurs due to the phase truncation, man. carrierto-spur ratio 48.08 dBc (48.16 dBc (9)). Simulation parameters same as Figure 4 but AI$ = 265,fOu= 64697 H z .
bit spur reduction (8)to a 12 dB per bit spur reduction (11). Since the size of the ROM ( 2k X m) is exponentially related to the number of the phase bits, the technique results to a dramatic decrease in the ROM size. The expense of the phase dithering isthe increased noise floor. However, the noise power is spread throughout the sampling bandwidth, so the ratio of the carrier-to-noise spectral density could be made high by increasing S (the length of the DFT) in (12), (13). The upper bound for the ratio of the carrierto-noise power spectral density after the phase dithering is [2] ($)=6.02k
- 9.94 + lOloglo(S) dBc,
where z,(n) is the amplitude dither [2], [ l l ] , [12]. The spurious performance of the D/A-converter input is the same asif the D/A-converter input werequantized to (m+ x ) bits [2], because the zA(n)randomizes a part of the quantization error (x bits) in Figure 6. If the zA(n) is evenly distributed on [-AA / 2 , A A /2) and independent of the e,(n), then the total amplitude noise power after dithering will be [ 141
(12) -m
where AA= 2 , and E{e2,} is from (6) or (7). The amplitude error power is doubled after dithering, but the error power is divided to all discrete frequency components. If the spur power is divided to the P/2 spurs ( 6 ) , thenafter dithering the total noise power is divided P spurs and the ratio of the carrier-tospur power spectral density is not changed in same measurement period (P).Then the ratio of the carrier-to-noise power spectral density is same as in (6)
where S is the length of the DFT and the period of the dither source is longer than S. The length of the DFT is 4096 in all figures in this paper. The upper bound is achieved, when GCD (A@,2J-' ) = 2J-'-l, New bound for the ratio of the carrier-tonoise spectral density after phase dithering is derived in appendix. The lower bound for the ratio of the carrier-to-noise power spectral density after the phase dithering is (see appendix) ($)=6.02k
($)=(1.76+6.02m+1010g10(3 - dBc.
- 11.19 + IOloglo(S) dBc.
)
The lower bound is achieved, when j >> k and GCD (A@,2j-' ) = 1. The phase dithering requires the dither generation and an adder, that makes the circuit more complex. The overflows due to the dithering cause no problems in the phase address, because the phase accumulator works in overflow principle. The ratio of the carrier-to-noise power spectral density in Figure 7 is 74.35 dBc per FFT bin,in agreement with the lower bound 74.34 dBc (13). In Figure 8 the carrier-to-spur ratio is 28.47 dBc (28.28dBc (ll)), and the ratio of the carrier-tonoise power spectral density is 44.20 dBc, in agreement with the upper bound 44.24 dBc (12).
The penalty of the amplitude dithering is a more complex circuit and reduced dynamic range. In this method the size of the ROM increases by 2k X x, where k is the wordlength of the phase address and x is the wordlength of the amplitude error. The output of the ROM must be reduced (scaled) so that the original signal plus the dither will stay within the nonsaturating region. The loss is small, when the number of the quantization levels is large. For example, QUALCOMM has used the nonsubtractive amplitude dither in their device [15].
Subtractive Dither Nonsubtractive dither is used to destroy the coherence of the undesired spurious components, but the penaltyisthatthe broadband noise level is quite high after dithering. To alleviate the increase in noise, subtractive dither canbeused in which
Nonsubtractive Amulitude Dither
A digital dither (from source 3 in Figure 6) is summed with the output of the phase to amplitude converter POWER SPECTRlM
POWER SPECTRUM
-lot
.l201
1
2 3 FREQUENCY (Hz)
I
I
4 X
l
5 IO'
I
2 3 FREQUENCY (e)
4
S
x 10'
Figure 8. The dither is added into the phase address, when GCD (A@,2'-' ) = 2J-'-' = 256. Simulation pararnerers: j = 12, k = 3, m = I O , A@= 256, fclk = l MHz, fout= 62.5
Figure 7. The dither is added into the phase address, when GCD (A@,2j-' ) = 1. Simulation parameters same as Figure 4 .
wiz.
954
POWER SPECTRUM
O
-"t
-40
I
POWER SPECTRUM
s O
3
I I
2
3
FFEQUENCY (Hz)
L
5
x 10'
Figure 10. With amplitude dithering, the ratio of the carrier-to-mise power spectral density is 80.1 dBc per FFT bin (80.02 dBc (16)).
Figure 9.Withou amplitude dithering, the carrier-to-spur ratio is SI .2 dBc. Simulation parameters: j , k = 12, m = 8, X = 8.A4 = 512,fOu = 125 kHz, fclk = 1 MHz. the dither is added to the digital samples and subtracted from the DDS analog output signal [16]. The requirement of dither subtraction at the DDS output makes the method complex and difficult to implement in practical applications. The technique presented in this paper uses a high-pass filtered dither [3], [4], which has most of its power in an unused spectral region between the band edge of the low-pass filter and the Nyquist frequency. After the DDS output has been passed through the lowpassfilter,only afractionoftheditherpowerwillremain. From this point of view the low-pass filtering is a special implementation of the dither subtraction operation.
DDS outputfrequency frequency.
is low in respect with the used clock
Hinh-Pass Filtered Amditude Dither A digital dither (from source 2 in Figure 11) is summed with the outputof the phase to amplitudeconverter
where zHA(n) is the high-pass filtered amplitude dither, which has most of its power in an unused spectral region between the band edge ofthelow-pass filter and the Nyquistfrequency. After the DDS output has been passedthrough the low-pass filter, only a fraction ofthe ditherpower will remain. Therefore the total noise power will be approximately half lower than in the case of the wideband dither (15). The effect on the ratio of the carrier-to-noise spectraldensity is the same as with doublingthe sampling bandwidth (the clockfrequency of the DDS). The benefits of the high-pass filtered amplitude dither arehigher, when itis used torandomizethe D/A-converter nonlinearities. This is because the magnitude of the dither must be high in order to randomize the nonlinearities of the D/Aconverter [ 171. The high-pass filtered dither has poorer randomization properties than the wide band dither, that could be compensated by increasing the magnitude of high-pass filtered dither [ 3 ] . The spurreductionproperties of the high-passfilteredamplitude dither are difficult to analyze theoretically [3], therefore only simulations are performed. The lossofthe dynamic rangeis greater than in the case of the nonsubtractive dither, because the magnitude of the high-pass filtered dither must be higher. However,the loss is small, when thenumber of thequantization levels is large. Figure 9 shows the power spectrum of a sine wave without 16 bit sidithering. Figure 10 shows the power spectrum of a nusoid amplitude dithered with a random sequence, that is distributed evenly over [- 2-* / 2 ,2-* / 2 ), prior to truncation to 8 bits. Figure 12 shows the same example as Figure 10, but with random a sequence, which is distributed evenly over [-
?It
Figure 1I . The DDS with high-pass filtered phase and amplitude dithering structures. Hinh-Pass Filtered Phase Dither A digital high-pass filtered dither signal zHp(n) (from source 1 in Figure 11) is added to the output of the phase accumulator 2R sin(-(A$n - ep(n)+z,,(n))) - e ~ ( n ) . 2' If both the dither and the phase error is assumed small relative to the phase, then the DDS output signal (17) can be approximated by
where f,,, istheDDS output frequency and fcra is the DDS clock frequency (1). The above phase dithering is in the form of an amplitude modulated sinusoid. The modulation translates the dither spectrum up and down in frequency by f,,,,so that most of the dither power will be inside DDS output bandwidth. So, thehigh-passfiltered phasedither worksonly when the
955
POWER SPECTRUM
POWER SPECTRUM
.
-20 o
O
r
h.t -60
I I
2 3 FFEWENCV (Hz)
4
-120'
5 x to5
Figure 12. With high-pass filtered amplitude dithering, the carrier-to-spur ratio is increased to 69.25 dBc (see the ratio in Figure 9).
The error feedback (EF) technique is used to suppress low frequency quantization spurs in the DDS [ 5 ] , [ 6 ] .The drawback of conventional EF structures is that the output frequency is lowwith respect to theclock frequency. This is necessary, because the transfer function of the EF has zero(s) at DC. In theproposed architecture the clock frequency needonly be much greater than the bandwidth of output signal, whereas the output frequency could beany frequency up to somewhat below the Nyquist frequency. The coefficients of the EF are tuned according to the output frequency.
l
I
x1
with the phase increment (Aq), and therefore we can make the EF filter to be tunable. This is carried out by changing the values of b,, b, which will move the zeros of the filter across the output frequency band. The zero(s) should be placed as near as zero frepossible to the desired output frequency. The quency(ies) can be computed by solving the roots of the filter in the z-plane. Often b, is constrained to have powers-of-two values or zero (0,*l, f 2 ] (so that the implementation requires only binary shift operations and adding/subtraction's). b, could get only values [0,1]. Table 1. lists the properties of the filter with different b,andb,, constrained like this. In Table 1. x is the wordlength of the error.
Tunable Error Feedback in DDS
I
4
Figure 13. With high-parsfiltered amplitude dithering, the ratio of the carrier-to-noise power spectral density is 83.2 dBc (0 to 0.4fclk).
2-7 1 2 , 2-7 / 2 ). It is processed by a digital high-pass filter prior to dithering. In this example the digital high-pass filter is a 4th-order Chebyshev type I filter with the cutoff frequency O.42fc,, . The amplitude range of the high-pass filtered dither / 2 ,2-' I 2 ) to [- 24 / 2 ,24 / 2 ), then is increased from [the spur reduction is accelerated in Figure 13. In Figure 13 the noise power spectral density is about 3 dB (half) lower in the DDS output bandwidth (0 to 0.4 f C u ) than Figure 10.
l
2 3 FREWENCY (Hz)
l
&,
~
1c
-21 1
I O
1
0
I
0
I
0.5 1
The EF has been placed between the phase
3xY
1 LPF
I 3 x Y
IHPF
I
~~~
~
accumulator and
ROM in Figure 14. It is possible to derive the following equa-
Figure 14. The errorfeedback in theDDS. Theidea of theEFisto save the errors createdafter the quantization operation, feeding the errors back through a separate filter, in order to correct the product at the following sampling instants [18]. The EF filter can be a second order finite impulse response (FIR) filter (Figure 14.). The filter creates a zero, which decreases the quantization spurs in a certain part of the frequency band. The output frequency of the DDS changes
tion for the synthesizer output signal sin(-(A.$n-(ep(n)+bl[ep(n-l)]d 2n 2'
+9[ep(n-2)L)))-eA(n),
(20)
where e,@) is the phase quantization error, d is the wordlength of the phase error and e,(n) is the amplitude quantization error. Here, only the phase EF is analyzed (20). Truncation [l, causes a secondary quantization error in the EF network. Simulations showedthatthe phase EFworksonly when the DDS output
956
frequency is low in respect to the used clock frequency. So, the coefficients of the phase EF cannot be tunable, because phase EF does not work in higher frequencies. If the phase error is assumed small relative to the phase, then the output signal (20) can be approximated by
where f,,, is the DDS output frequencyand f C u isthe DDS clock frequency (1). The phase EF, above, is in the form of an amplitudemodulatedsinusoid. The modulationtranslatesthe error spectrum up and down in frequency by f , , , , which explains the simulation results in the higher frequencies. Tunable Amulitude Error Feedback in DDS The EF has been placed after the ROM in Figure 14. It is possible to derive the following equationforthesynthesizer output signal sin(-(Agn-epb)))-([e~(")],+bl[eA(n-1)],+q[eA("-2)],). 2n (22)
where x isthewordlength of theamplitude error.Here, the amplitude EF in (22) is only analyzed. The amplitude EF coefficients, which are given in Figure 15, dependontheoutput frequency of the DDS (Figure 14.). The output frequencies of the DDS with the amplitude EF are divided to the frequency bands, so that the amplitude error variance is minimized (the error term is assumed white). In the DDS the Nicholas phase accumulator (seechapter ModificatedNicholasPhase Accumulator) is used (and j >> l), so that the output period (P) is long, and the amplitude error is approximately white (6) (see Figure 16). The penalty of the amplitude EF is a more complex circuit and reduced dynamic range. The size of the ROM increases by 2k X x , where k is the wordlength of the phase address and x is the wordlength of the amplitude error. The output of the ROM must be reduced(scaled) so that theoriginalsignal plus the maximum value of the EF will stay within the nonsaturating region. The loss is small, when the number of the quantization levels is large.
2, PCWERSPECTRLM O
m
'$mI
{zj x 105
Figure 15. The optimalfrequency b a d for Table l . EF coeflcients.
Figure 16. Withoutthe amplitude EF. Simulation parameters: the Nicholas phase accumulator length j = 12 ( l l + I ) , k = 12, m = 8,fclk = 1 MHz,fout 23.62 kHz, A$ = 15 andx = 8. POWERSPECTRVM
1
2 3 FRMUENCY ( M )
I
S
4 X
1
2
mEaumcY
lo5
Figure 17. The second order amplitude EF with coefjcients b, = -2, b, = 1 (foutlfclk= 0.0037). Simulation parameters same as Figure 16.
957
3
(M)
l
4
5 X
lo5
Figure 18. The second order amplitude EF with coeflicients b, = 1, b2 = 1 (fOutlfclk= 0.3333). Simulation parameters: j = 12, k = 12, m = 8, A@= 1365,fclk = l MHz, fout 333 kHz.
A computer program has been created to simulate the DDS in Figure 14. with EF structures. The phase accumulator length is equal the phase address (no phase truncation) to avoid confusing the sources of the spurs. The output of the sine ROM is scaled with the maximum value of the EF filter magnitude response (3xY in Table 1.). In Figure 17 and Figure 18, the am15, deplitude EF coefficients, which are chosen from Figure pend on the output frequency of the DDS (1). The quantization noise at DDS output frequencies is reduced, so that one would obtain a high signal-to-noise ratio in a band around f,,,. The proposed DDS gets three input parameters: a phase increment, the coefficients of the amplitude EF and the passband of theanalog filter (as inFigure 14. but no phase EF).The proposed architecture usedsecond-orderEFbuttheuse of higher order EF is possible. The tunable analog passband filteringcould be implemented, for example, with a phaselocked-loop, which will tune automatically. In the proposed architecture the output frequency band is much greater than in ordinary DDS with the fixed coefficients of the amplitude EF. The DDSwiththe tunable amplitude EF allows the use of coarse resolution, highly linear D/A-converter, becausespur performance is not limited by the number of bits in the D/Aconverter, but rather by the linearity of the D/A-converter. In purely digital applications the reduced wordlength allows the use of narrower data paths.
e,(n) = ( $ ( n ) ) mod2'-',when
GCD (A@,2'-k)< 2 J - k ,
and the period of the phase truncation error is 2i-k
PE=
(25)
(26)
GCD(A@,2i-k)'
The total phase fluctuation noise will be proportional tothe e,(n) [2], when the random value z,(n) is added to the phase addressbeforetruncationto k-bits in Figure 19. The evenly distributed random quantity z,(n) varies in the range [0,2j-' ). If z,(n) is less than the quantity (2J-' - e,(n)), then (e,(n) + z,(n)) will be truncated (0). The total phase truncation noise will be ~ ( n=)- e p (n) (27) with the probability ( 2 j - k -ep(n)) '
2j-k
(28)
because there are ( 2J-k- e,(n)) values of z,(n) less than (2j-' e,(n)), and there are 2j-k values of z,(n). If z,(n) is equal to or greater than the quantity ( 2jbk- ep(n)),then (e,(n) + z,(n)) will truncated ( 2J-' ). The total phase truncation noise will be ~ ( n=)(2'-k - e p ( n ) )
(29)
with the probability
(30)
ep(n) 2j-k
'
because there are e,(n) values of z,(n) are equal to or greater than (2J-'- e,(n)). At all sample times n the f i s t moment of the total phase truncation noise is zero
Conclusion The reason why the dither techniques have not been much applied to reduce the spurs due to the finite wordlength of digital part of the DDS is that the effect of the D/A-converter nonlinearities nullifies the contribution. It is difficult to implement fast and highly accuracy D/A-converters, because the analog components are difficult to make high accuracy. With the amplitude EF lower accuracy D/A-converter with a better inner spurious performance could be used. The problems with the amplitude EF are the increased circuit complexity and the narrowband passband filtering of the DDS output increases the settling time. The benefits of the high-pass filtered amplitude dither would be higher, when it is used to randomize the D/Aconverter nonlinearities, because the magnitude of the dither mustbehighinorderto randomize the nonlinearities of the D/A-converter.
The second momentof the total phase truncation noise is
Two bounds are derived for the average value of the second moment (the power of the total truncation noise) based on the period of the error term (PE). In the first case GCD (A$, 2J-k ) is j-k-1 and PE is 2 (26), and the average value of the sequence (32) gets its minimumnonzero value. The phase truncation . . . from (25). Then error sequence is 2i-k-1, 0, 2j-'-' , 0, 2J-k-1
Amendix: Ratio of Carrier-to-Noise SDectral Densitv After Phase Dithering
%(44
An evenly distributed random quantity z,(n) (source 2 in
214
Figure 6 . ) is added to the phase address prior to the phase truncation. The output sequence of the DDS is given by 2a (23) W-(@@) + E(n))), 25 where $(n) is a phase register value. The total truncation noise is E@) = ep@) + Z p ( 4 , (24) where the phase truncation error varies periodically
._
L
.
n Figure 19. Thephase truncation errors.
958
22(j-k) 22(j - k ) 22( j - k ) +O+E ( & Z }= -+ O + 4 4 4
...
(33)
in Digital Systems to Provide Improved Signal-to-Noise J. Audio Enn. Soc., Ratio over Conventional Dithering," vol. 35, pp. 446-454, June 1987.
The average value of this sequence is
(34)
[4] L. R. Carley, "An OversamplingAnalog-to-Digital ConverterTopology for High-ResolutionSignalAcquisition CAS-34, pp. Systems,"JEEETrans.CircuitsandSvst., 83-90, Jan. 1987.
In the second case GCD (A@,Zi-' ) is 1 and PE is 2j-' (26), and the average value of the sequence (32) gets its maximum value. In this case the phase truncation error sequence gets all possible error values ([0, 2j-' )) before any is repeated. Then the average value of the sequence (32) is 22'j-k) (35) A v ~ ( E ( & ~ ] ) = - ,when j >> k .
(51 P. 0' Leary andF. Maloberti,"A DirectDigitalSynthesizer with Improved Spectral Performance," IEEE Trans. Commun., vol. COM-39, pp. 1046-1048, July 1991.
6
[6] P. 0' Leary, H. Horvatand F. Maloberti, "DirectDigital SynthesisApplied to ModulatorsforData Communications," Journal of Semicustom ICs, vol. 8, No. 3, pp. 3241, 1991.
Using small angle approximations for (23) ~~
2n
2n sin(2J2'
@(n))
2x + -e(n)cos(-@(n)).
2J
The number of bits, k, must be large enough to satisfy the small k 2 4. Afterditheringtheerror angleassumption,typically, power E is almost spectrally white. Then the signal-to-noise ratio is given by 1 (37) SNR =
[7] H. T. Nicholas and H. Samueli, "An Analysis of the Output Spectrum of Direct Digital Frequency Synthesizers in the Presence of Phase-Accumulator Truncation," in proC. 41st Annu. Freauencv Contr. SvmD., 1987, pp. 495-502.
[8] C.E. Wheatley, m,"DigitalFrequencySynthesiser with Random Jittering for Reducing Discrete Spectral Spurs," U. S. Pat. 4,410,954, Oct. 18, 1983.
4n 2
-Avg(EIE21) 22,
The upper bound to the signal-to-noise ratio is from (34)
-
L SNR 5 10 l O g l ~ ( = ~(6.02 ) k - 6.93) dB. n 2
[9] S . C. Jasper,"FrequencyResolutioninaDigital tor," U. S. Pat. 4,652,832, Mar. 24, 1987.
The lower bound to the signal-to-noise ratio is from (35) S N R = IOl~g,o(-)
6-
4n 2
= (6.02 k -8.18) dB.
Oscilla-
[lo] G. A. Zimmermanand M. J. Flanagan, "Spur Reduced Numerically-Controlled Oscillator for Digital Receivers," Comuut., Dec. Asilomar Conf. on Signals.Svst.and 1992, pp. 517-520.
(39)
The sinusoid generated is a real signal, so its power is equally divided into negative and positive frequency components. The total noise power is divided to S spurs, where S is the length of the DFT and the period of the dither source is longer than S. Using these facts, the upper bound for the ratio of the carrierto-noise power spectral density is same as in [2] (40) = 6.02k - 9.94 + 10loglo(S) dBc.
[ 1 l ] R. J. Kerr and L. A. Weaver, "Pseudorandom Dither for Frequency Synthesis Noise," U. S . Pat. 4,901,265, Feb.
13, 1990. [l21 V. S . Reinhardt et al., "Randomized Digital/Analog ConverterDirectDigitalSynthesiser," U. S . Pat. 5,014,231, May 7, 1991.
(5)
The upper bound is achieved, when GCD (A@ 2j-' ) is 2j-'-l . Thelower bound forthe ratio of thecarrier-to-noisepower spectral density is
[l31 M.J. Flanagan and G. A. Zimmerman, "Spur-Reduced DigitalSinusoidGeneration Using Higher-OrderPhase Dithering,"Asilomar Conf. on Sienals.Svst. andComU,NOV.1993, pp. 826-830.
(2)
= 6.02k - 11.19 + 10loglo(S) dBc.
[l41 R. M. Gray and T. G. Stockholm, "Dithered Quantizers," IEEE Trans. Inform. Theorv., vol. 39, pp. 805-812, May 1993.
The lower bound is achieved, when j >> k and GCD (A& 2j-' ) is 1. The new bound (41) for the ratio of the carrier-to-noise spectral density is derived from these facts.
[ 15) Oualcomm 02334 Technical Data Sheet, June 1991.
[l61 E. R. Twitchell and D. B. Talbot, "Apparatus for Reducing Spurious Frequency Components in the Output Signal of aDirectDigitalSynthesizer," U. S . Pat. 5,291,428, Mar. 1,1994.
References
[ l ] V. S . Reinhardt,"SpurReductionTechniques in Direct Digital Synthesizers," in Proc. IEEE Int. Freauencv Cont. Svmp. 1993, pp. 230-241. [2] M. J. Flanaganand G. A. Zimmerman, "Spur-Reduced Digital Sinusoid Synthesis," IEEE Trans. Commun., vol. COM-43, pp. 2254-2262, July 1995.
[l71 M. P. Wilson and T. C. Tozer, "SpuriousReduction TechniquesforDirectDigitalSynthesis," IEEColl.Digest 1991/172 on Direct Digital Freauencv Svnthesis, 19 Nov. 1991.
[3] B. A. Blesserand B. N. Locanthi, "The Application of Narrow-Band Dither Operating at the Nyquist Frequency
[l81 J. C. Candyand G. C. Temes,"Oversamding DeltaSinma Data Converters," IEEE Press, NewYork, 1992.
959