1
FACTOR BASE : SQL for Learning A Multi-Relational Graphical Model
arXiv:1508.02428v1 [cs.DB] 10 Aug 2015
Oliver Schulte, Zhensong Qian Simon Fraser University, Canada {oschulte,zqian}@sfu.ca
Abstract—We describe FACTOR BASE , a new SQL-based framework that leverages a relational database management system to support multi-relational model discovery. A multi-relational statistical model provides an integrated analysis of the heterogeneous and interdependent data resources in the database. We adopt the BayesStore design philosophy: statistical models are stored and managed as first-class citizens inside a database [30]. Whereas previous systems like BayesStore support multi-relational inference, FACTOR BASE supports multi-relational learning. A case study on six benchmark databases evaluates how our system supports a challenging machine learning application, namely learning a first-order Bayesian network model for an entire database. Model learning in this setting has to examine a large number of potential statistical associations across data tables. Our implementation shows how the SQL constructs in FACTOR BASE facilitate the fast, modular, and reliable development of highly scalable model learning systems.
I. I NTRODUCTION Data science brings together ideas from different fields for extracting value from large complex datasets. The system described in this paper combines advanced analytics from multirelational or statistical-relational machine learning (SRL) with database systems. The power of combining machine learning with database systems has been demonstrated in several systems [11], [15], [3]. The novel contribution of FACTOR BASE is supporting machine learning for multi-relational data, rather than for traditional learning where the data are represented in a single table or data matrix. We discuss new challenges raised by multi-relational model learning compared to single-table learning, and how FACTOR BASE solves them using the resources of SQL (Structured Query Language). The name FACTOR BASE indicates that our system supports learning factors that define a log-linear multi-relational model [14]. Supported new database services include constructing, storing, and transforming complex statistical objects, such as factortables, cross-table sufficient statistics, parameter estimates, and model selection scores. Multi-relational data have a complex structure, that integrates heterogeneous information about different types of entities (customers, products, factories etc.) and different types of relationships among these entities. A statistical-relational model provides an integrated statistical analysis of the heterogeneous and interdependent complex data resources maintained by the database system. Statistical-relational models have achieved state-of-the-art performance in a number of application domains, such as natural language processing,
ontology matching, information extraction, entity resolution, link-based clustering, query optimization, etc. [4], [20], [8]. Database researchers have noted the usefulness of statisticalrelational models for knowledge discovery and for representing uncertainty in databases [28], [30]. They have developed a system architecture where statistical models are stored as firstclass citizens inside a database. The goal is to seamlessly integrate query processing and statistical-relational inference. These systems focus on inference given a statistical-relational model, not on learning the model from the data stored in the RDBMS. FACTOR BASE complements the in-database probabilistic inference systems by providing an in-database probabilistic model learning system. A. Evaluation We evaluate our approach on six benchmark databases. For each benchmark database, the system applies a stateof-the-art SRL algorithm to construct a statistical-relational model. Our experiments show that FACTOR BASE pushes the scalability boundary: Learning scales to databases with over 106 records, compared to less than 105 for previous systems. At the same time it is able to discover more complex cross-table correlations than previous SRL systems. We report experiments that focus on two key services for an SRL client: (1) Computing and caching sufficient statistics, (2) computing model predictions on test instances. For the largest benchmark database, our system handles 15M sufficient statistics. SQL facilitates block-prediction for a set of test instances, which leads to a 10 to 100-fold speedup compared to a simple loop over test instances. B. Contributions FACTOR BASE is the first system that leverages relational query processing for learning a multi-relational log-linear graphical model. Whereas the in-database design philosophy has been previously used for multi-relational inference, we are the first to adapt it for multi-relational model structure learning. Pushing the graphical model inside the database allows us to use SQL as a high-level scripting language for SRL, with the following advantages. 1) Extensibility and modularity, which support rapid prototyping. SRL algorithm development can focus on statistical issues and rely on a RDBMS for data access and model management.
2
2) 3)
Increased scalability, in terms of both the size and the complexity of the statistical objects that can be handled. Generality and portability: standardized database operations support “out-of-the-box” learning with a minimal need for user configuration.
C. Paper Organization We provide an overview of the system components and flow. For each component, we describe how the component is constructed and managed inside an RDBMS using SQL scripts and the SQL view mechanism. We show how the system manages sufficient statistics and test instance predictions. The evaluation section demonstrates the scalability advantages of in-database processing. The intersection of machine learning and database management has become a densely researched area, so we end with an extensive discussion of related work. II.
BACKGROUND ON S TATISTICAL -R ELATIONAL L EARNING We review enough background from statistical-relational models and structure learning to motivate our system design. The extensive survey by Kimmig et al. [14] provides further details. The survey shows that SRL models can be viewed as log-linear models based on par-factors, as follows. A. Log-linear Template Models for Relational Data Par-factor stands for “parametrized factor”. A par factor represents an interaction among parametrized random variables, or par-RVs for short. We employ the following notation for parRVs [14, 2.2.5]. Constants are expressed in lower-case, e.g. joe, and are used to represent entities. A type is associated with each entity, e.g. joe is a person. A first-order variable is also typed, e.g. Person denotes some member of the class of persons. A functor maps a tuples of entities to a value. We assume that the range of possible values is finite. An atom is an expression of the form r(τ1 , . . . , τa ) where each τi is either a constant or a first-order variable. If all of τ1 , . . . , τa are constants, r(τ1 , . . . , τa ) is a ground atom or random variable (RV), otherwise a first-order atom or a par-RV. A par-RV is instantiated to an RV by grounding, i.e. substituting a constant of the appropriate domain for each first-order variable. A par-factor is a pair Φ = (A, φ), where A is a set of parRVs, and φ is a function from the values of the par-RVs to the non-negative real numbers.1 Intuitively, a grounding of a par-factor represents a set of random variables that interact with each other locally. SRL models use parameter tying, meaning that if two groundings of the same par-factor are assigned the same values, they return the same factor value. A set of parfactors F defines a joint probability distribution over the ground par-RVs as follows. Let I(Φi ) denote the set of all ground par-RVs in par-factor Φi . Let x be a joint assignment of values to all ground random variables. Notice that this assignment determines the values of all ground atoms. An assignment X = x is therefore equivalent to a single 1A
par-factor can also include constraints on possible groundings.
database instance. The probability of a database instance is given by the log-linear equation [14, Eq.7]: Y 1 Y P (X = x) = φi (xA ) (1) Z Φi ∈F A∈I(Φi )
where xA represents the values of those variables in A that are necessary to compute φi . Equation 1 can be read as follows. 1) Instantiate all parfactors with all possible constants. 2) For each ground par-factor, apply the values specified by the joint assignment X = x, and compute the corresponding factor term. 3) Multiply all the factors together, and normalize the product. Typically the number of ground par-RVs I(Φi ) will be very large. Equation 1 can be evaluated, without enumerating the ground par-factors, as follows. 1) For each par-factor, for each possible assignment of values, find the number of ground factors with that assignment of values. 2) Raise the factor value for that assignment to the number of instantiating factors. 3) Multiply the exponentiated factor values together, and normalize the product. The number 2) of ground factors with the same assignment of values is known as a sufficient statistic of the log-linear model.
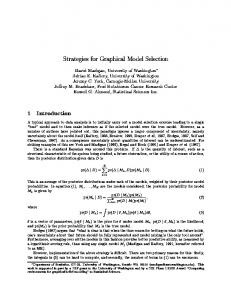
prof_id
Figure 1.
teachingability
salary
intelligence
professor
RA
student
popularity
capability
ranking
A relational ER Design for a university domain.
Student s_id intelligence ranking jack 3 1 kim 2 1 paul 1 2 (a)
Figure 2.
student_id
s_id jack kim paul kim
p_id oliver oliver jim david
RA salary capability high 3 low 1 med 2 high 2
(b)
p_id jim oliver david
Professor popularity teachingability 2 1 3 1 2 2 (c)
Database Table Instances: (a) Student, (b) RA, (c) Professor .
B. Examples SRL has developed a number of formalisms for describing par-factors [14]. First-order probabilistic graphical models are popular both within SRL and the database community [14], [30]. The model structure is defined by edges connecting par-RVs. For instance, a parametrized Bayesian network structure is a directed acyclic graph whose nodes are par-RVs. Figure 3 shows a Bayesian network for a University domain. We use the university example as a toy running example
3
Capability(P,S) Capab bility y( , ) y
Salary(P,S) y((P S) S)
RA RA(P,S) A(((P (P,S) ,S) IIntelligence(S) ntellligen
Popularity(P) ulariity( y(((P)) Teachingability(P) achingab ngab bility(P))
Ranking(S) Ranking king g(S)
(a) Capa(P,S) RA(P,S) Salary(P,S) n/a F n/a 4 T high 5 T high 3 T high 3 T low 2 T low 1 T low 2 T med 3 T med 1 T med
(b)
CP 1.00 0.45 0.36 0.18 0.20 0.40 0.40 0.22 0.44 0.33
that the conjunction Capability(P, S) = n/a, Salary(P, S) = n/a, RA(P, S) = F is instantiated 203 times in the University database (publicly available at [24]). This means that for 203 professor-student pairs, the professor did not employ the student as an RA (and therefore the salary and capability of this RA relationship is undefined or n/a).
Count Capa(P,S) RA(P,S) Salary(P,S) 203 n/a F n/a 5 4 T high 4 5 T high 2 3 T high 1 3 T low 2 2 T low 2 1 T low 2 2 T med 4 3 T med 3 1 T med
(c)
Figure 3. (a) Bayesian network for the University domain. We omit the Registered relationship for simplicity. The network was learned from the University dataset [24]. (b) Conditional Probability table Capability(P, S) CPT , for the node Capability(P, S). Only value combinations that occur in the data are shown. This is an example of a factor table. (c) Contingency Table Capability(P, S) CT for the node Capability(P, S) and its parents. Both CP and CT tables are stored in an RDBMS.
throughout the paper. The schema for the university domain is given in Figure 1. This schema features only one relationship for simplicity; FACTOR BASE learns a model for any number of relationships. While we describe FACTOR BASE abstractly in terms of par-factors, for concreteness we illustrate it using Bayesian networks. The system takes as input a database instance like that shown in Figure 2, and produces as output a graphical model like that shown in Figure 3. A par-factor in a Bayesian network is associated with a family of nodes [14, Sec.2.2.1]. A family of nodes comprises a child node and all of its parents. For example, in the BN of Figure 3, one of the par-factors is associated with the par-RV set A = {Capability(P, S), Salary(P, S), RA(P, S)}. For the database instance of Figure 2, there are 3 × 3 = 9 possible factors associated with this par-RV, corresponding to the Cartesian product of 3 professors and 3 students. The value of the factor φ is a function from an assignment of family node values to a non-negative real number. In a Bayesian network, the factor value represents the conditional probability of the child node value given its parent node values. These conditional probabilities are typically stored in a table as shown in Figure 3(b). This table represents therefore the function φ associated with the family par-factor. Assuming that all par-RVs have finite domains, a factor can always be represented by a factor table of the form Figure 3(b): there is a column for each par-RV in the factor, each row specifies a joint assignment of values to a par-RV, and the factor column gives the value of the factor for that assignment (cf. [14, Sec.2.2.1]). The sufficient statistics for the Capability(P, S) family can be represented in a contingency table as shown in Figure 3(c). For example, the first row of the contingency table indicates
C. SRL Structure Learning Algorithm 1 shows the generic format of a statisticalrelational structure learning algorithm (adapted from [14]). The instantiation of procedures in lines 2, 3, 5 and 8 determines the exact behavior of a specific learning algorithm. The structure algorithm carries out a local search in the hypothesis space of graphical relational models. A set of candidates is generated based on the current model (line 3), typically using a search heuristic. For each candidate model, parameter values are estimated that maximize a model selection score function chosen by the user (line 5). A model selection score is computed for each model given the parameter values, and the best-scoring candidate model is selected (line 7). We next discuss our system design and how it supports model discovery algorithms that follow the outline of Algorithm 1. Figure 4 outlines the system components and dependencies among them. Algorithm 1: Structure learning algorithm Input: Hypothesis space H (describing graphical models), training data D (assignments to random variables), scoring function score (·, D) Output: A graph structure G representing par-factors. 1: G ← ∅ 2: while CONTINUE (G, H, score (·, D) ) do 3: R ← REFINECANDIDATES(G, H) 4: for each R ∈ R do 5: R ← LEARNPARAMETERS(R,score (·, D)) 6: end for 7: G ← argmaxG0 ∈R∪{G} score(G0 , D) 8: end while 9: return G
III. T HE R ANDOM VARIABLE DATABASE Statistical-relational learning requires various metadata about the par-RVs in the model. These include the following. Domain the set of possible values of the par-RV. Types Pointers to the first-order variables in the par-RV. Data Link Pointers to the table and/or column in the input database associated with the par-RV. The metadata must be machine-readable. Following the indatabase design philosophy, we store the metadata in tables so that an SRL algorithm can query it using SQL. The schema analyzer uses an SQL script that queries key constraints in the system catalog database and automatically converts them into metadata stored in the random variable database V DB. In contrast, existing SRL systems require users to
System Pipeline Input DataBase
Variable Manager
Random Variable DataBase: VDB
Count Manager
4
Count Database: Model CDB Manager
Parameters
Contingency Table analyzes schema
MetaData about Random variables
computes sufficient statistics
Cross-table Counts/ Sufficient Statistics
Models Database: MDB
Learns Model Structure
Model Structure Graphical Model + Parameter Values
Figure 4. System Flow. All statistical objects are stored as first-class citizens in a DBMS. Objects on the left of an arrow are utilized for constructing objects on the right. Statistical objects are constructed and managed by different modules, shown as boxes.
TABLE I.
T RANSLATION FROM ER D IAGRAM TO PAR -RV S
ER Diagram Entity Set Relationship Set Entity Attributes Relationship Attributes
Example Student, Course RA intelligence, ranking capability, salary
par-RV equivalent S, C RA(P,S) Intelligence(S), Ranking(S) Capability(P, S), Salary(P, S)
specify information about par-RVs and associated types. Thus FACTOR BASE utilizes the data description resources of SQL to facilitate the “setup task” for relational learning [29]. Due to space constraints, we do not go into the details of the schema analyzer. Instead, we illustrate the general principles with the ER diagram of the University domain (Figure 1). The Appendix provides a full description with MySQL script. The translation of an ER diagram into a set of functors converts each element of the diagram into a functor, except for entity sets and key fields [10]. Table I illustrates this translation. In terms of database tables, attribute par-RVs correspond to columns. Relationship par-RVs correspond to tables, not columns. Including a relationship par-RV in a statistical model allows the model to represent uncertainty about whether or not a relationship exists between two entities [14]. The values of descriptive attributes of relationships are undefined for entities that are not related. We represent this by introducing a new constant n/a in the domain of a relationship attribute [18]; see Figure 5 (right). Table II shows the schema for some of the tables that store metadata for each relationship par-RV, as follows. par-RV and FO-Var are custom types. Relationship The associated input data table. Relationship Attributes Descriptive attributes associated with the relationship and with the entities involved. Relationship FOVariables The first-order variables contained in each relationship par-RV.2 TABLE II.
S ELECTED TABLES I N THE VARIABLE DATABASE S CHEMA .
Table Name Relationship Relationship Attributes Relationship FOvariables
Column Names RVarID: par-RV, TABLE NAME: string RVarID: par-RV, AVarID: par-RV, FO-ID: FO-Var RVarID: par-RV, FO-ID: FO-Var, TABLE NAME: string
While we have described constructing the variable database for an ER model, different structured data models can be 2 The
schema assumes that all relationships are binary.
Figure 5. The metadata about attributes represented in VDB database tables. Left: The table AttributeColumns specifies which tables and columns contain the functor values observed in the data. The column name is also the functor ID. Right: The table Domain lists the domain for each functor.
represented by an appropriate first-order logic vocabulary [14], that is, an appropriate choice of functors. For example, in a star schema, facts can be represented in the form f (D1 , . . . , Dk ), where the first-order variable Di ranges over the primary key of dimension table i. Attributes of dimension i can be represented by a unary functor a(Di ). FACTOR BASE can perform structure learning for different data models after the corresponding data format has been translated into the VDB format. IV. T HE C OUNT M ANAGER The count database CDB stores a set of contingency tables. Contingency tables represent sufficient statistics as follows [19]. Consider a fixed list of par-RVs. A query is a set of (variable = value) pairs where each value is of a valid type for the variable. The result set of a query in a database D is the set of instantiations of the logical variables such that the query evaluates as true in D. For example, in the database of Figure 2 the result set for the query RA(P, S) = T, Capability(P, S) = 3 , Salary(P, S) = high is the singleton {hjack , oliver i}. The count of a query is the cardinality of its result set. Every set of par-RVs V ≡ {V1 , . . . , Vn } has an associated contingency table (CT ) denoted by CT (V). This is a table
5
with a row for each of the possible assignments of values to the variables in V, and a special integer column called count. The value of the count column in a row corresponding to V1 = v1 , . . . , Vn = vn records the count of the corresponding query. Figure 3(b) shows a contingency table for the par-RVs RA(P, S), Capability(P, S), Salary(P, S). The contingency table problem is to compute a contingency table for par-RVs V and an input database D. SQL Implementation With Metaqueries. We describe how the contingency table problem can be solved using SQL. This is relatively easy for a fixed set of par-RVs; the challenge is a general construction that works for different sets of par-RVs. For a fixed set, a contingency table can be computed by an SQL count(*) query of the form CREATE VIEW CT-table() AS SELECT COUNT(*) AS count, FROM TABLE-LIST GROUP BY VARIABLE-LIST WHERE FACTOR BASE uses SQL itself to construct the countconjunction query. We refer to this construction as an SQL metaquery. We represent a count(*) query in four kinds of tables: the Select, From, Where and Group By tables. Each of these tables lists the entries in the corresponding count(*) query part. Given the four metaquery tables, the corresponding SQL count(*) query can be easily constructed and executed in an application to construct the contingency table. Given a list of par-RVs as input, the metaquery tables are constructed as follows from the metadata in the database VDB . FROM LIST Find the tables referenced by the par-RV’s. A par-RV references the entity tables associated with its first-order variables (see VDB.Relationship FOvariables). Relational par-RV’s also reference the associated relationship table (see VDB.Relationship). WHERE LIST Add join conditions on the matching primary keys of the referenced tables in the WHERE clause. The primary key columns are recorded in VDB. SELECT LIST For each attribute par-RV, find the corresponding column name in the original database (see VDB.AttributeColumns). Rename the column with the ID of the par-RV. Add a count column. GROUP BY LIST The entries of the Group By table are the same as in the Select table without the count column. Figure 6 shows an example of a metaquery for the university database. This metaquery defines a view that in turn defines a contingency table for the random variable list associated with the relationship table RA. This list includes the entity attributes of professors and of students, as well as the relationship attributes of the RA relationship. The Bayesian network of Figure 3 was learned from this contingency table. The contingency table defined by the metaquery of Figure 6 contains only rows where the value of RA is true. The M¨obius Virtual Join [25] can be used to extend this contingency table to include counts for when RA is false, like the table shown in Figure 3(c).
Metaqueries
Entries
CREATE VIEW Select_List AS SELECT RVarID, CONCAT(‘COUNT(*)',' as "count"') AS Entries FROM VDB.Relationship UNION DISTINCT SELECT RVarID, AVarID AS Entries FROM VDB.Relationship_Attributes; CREATE VIEW From_List AS SELECT RVarID, CONCAT('@database@.',TABLE_NAME) AS Entries FROM VDB.Relationship_FOvariables UNION DISTINCT SELECT RVarID, CONCAT('@database@.',TABLE_NAME) AS Entries FROM VDB.Relationship;
CREATE VIEW Where_List AS SELECT RVarID, CONCAT(RVarID,'.',COLUMN_NAME,' = ', FO-ID,'.', REFERENCED_COLUMN_NAME) AS Entries FROM VDB.Relationship_FOvariables;
COUNT(*) as “count" `Popularity(P)` `Teachingability(P)` `Intelligence(S)` `Ranking(S)` @
[email protected] AS P
@
[email protected] AS S @
[email protected] AS `RA` `RA`.p_id = P.p_id `RA`.s_id =S.s_id
Figure 6. Example of metaquery results based on university database and the par-RV metadata (Table II).
V.
T HE M ODEL M ANAGER
The Model Manager provides two key services for statistical-relational structure learning: 1) Estimating and storing parameter values (line 5 of Algorithm 1). 2) Computing one or more model selection scores (line 7 of Algorithm 1). FAC TOR BASE uses a store+score design for these services, which is illustrated in Figure 7. A model structure table represents a candidate model. When a candidate model structure is inserted, a view uses the sufficient statistics from a contingency table to compute a table of parameter values. Another view uses the parameter values and sufficient statistics together to compute the score for the candidate model.
Model St Struct Structure ructur ct Parameters mete me ters
Model Score
Contingency Table
Figure 7.
Dependencies Among Key Components of the Model Manager.
A. The MDB Schema The relational schema for the Models Database is shown in Table III. The @par-RVID@ parameter refers to the ID of a par-RV, for instance Capability(P, S). The model manager stores a set of factor tables (cf. Section II-B). In a graphical model, each factor is defined by the local topology of the model template graph. For concreteness, we illustrate how factor tables can be represented for Bayesian networks. The graph structure can be stored straightforwardly in a database table BayesNet whose columns are child and parent. The table entries are the IDs of par-RVs. For each node, the MDB manages a conditional probability table. This is a factor table
6
TABLE III. T HE MAIN TABLES IN THE M ODELS DATABASE MDB . F OR A BAYESIAN NETWORK , THE MDB STORES ITS STRUCTURE , PARAMETER ESTIMATES , AND MODEL SELECTION SCORES . BayesNet(child:par-RV,parent:par-RV) @par-RVID@ CPT(@par-RVID@:par-RV,parent1 :par-RV,. . . , parentk :par-RV,cp:real) Scores(child:par-RV,loglikelihood:real,#par:int,aic:real)
that represents the factor associated with the node’s family (see Figure 3(b)). In a Bayesian network, model selection scores are decomposable. This means that there is a local score associated with each family, such that the total score for the BN model is the sum of the local scores. For each family, the local score is stored in the Scores table indexed by the family’s child node. B. Parameter Manager Deriving predictions from a model requires estimating values for its parameters. Maximizing the data likelihood is the basic parameter estimation method for Bayesian networks. The maximum likelihood estimates equal the observed frequency of a child value given its parent values. SQL Implementation With Natural Join. Given the sufficient statistics in a contingency table, a conditional probability table containing the maximum likelihood estimates can be computed by aggregation using SQL as in the example below. SELECT count/temp.parent_count as CP, capability(P,S), RA(P,S), salary(P,S) FROM capability(P,S)_CT NATURAL JOIN (SELECT sum(Count) as parent_count, RA(P,S), salary(P,S) FROM capability(P,S)_CT GROUP BY RA(P,S), salary(P,S) ) as temp C. Model Score Computation A typical model selection approach is to maximize the likelihood of the data, balanced by a penalty term. For instance, the Akaike Information Criterion (AIC) is defined as follows AIC (G, D) ≡ ln(PGb (D)) − #par (G) b is the BN G with its parameters instantiated to be where G the maximum likelihood estimates given the database D, and #par (G) is the number of free parameters in the structure G. The number of free parameters for a node is the product of (the possible values for the parent nodes) × (the number of the possible values for the child node -1). Given the likelihood and the number of parameters, the AIC column is computed as AIC = loglikelihood − #par . Model selection scores other than AIC can be computed in a similar way given the model likelihood and number of parameters. 1) Parameter Number Computation: To determine the number of parameters of the child node @parVar-ID@, the number of possible child and parent values can be found from the VDB .Domain table in the Random Variable Database.
2) Likelihood Computation: As explained in Section II-A, the log-likelihood can be computed by multiplying the instantiation counts of a factor by its value. Assuming that instantiation counts are represented in a contingency table and factor values in a factor table, this multiplication can be elegantly performed using the Natural Join operator. For instance, the loglikelihood score associated with the Capability(P, S) family is given by the SQL query below. The aggregate computation in this short query illustrates how well SQL constructs support complex computations with structured objects. SELECT Capability(P,S), SUM (MDB.Capability(P,S)_CPT.cp * CDB.Capability(P,S)_CT.count) AS loglikelihood FROM MDB.Capability(P,S)_CPT NATURAL JOIN CDB.Capability(P,S)_CT It is possible to extend the model manager to handle the multi-net structure learning method of the learn-and-join algorithm [26]. The algorithm learns multiple Bayesian networks and propagates edges among them. The MDB schema is easily extended to store multiple Bayesian networks in a single table. The edge propagation can be executed by the RDBMS using the view mechanism. For more details, please see [24]. This completes our description of how the modules of FACTOR BASE are implemented using SQL. We next show how these modules support a key learning task: computing the predictions of an SRL model on a test instance. VI. T EST S ET P REDICTIONS Computing probabilities over the label of a test instance is important for several tasks. 1) Classifying the test instance, which is one of the main applications of a machine learning system for end users. 2) Comparing the class labels predicted against true class labels is a key step in several approaches to model scoring [14]. 3) Evaluating the accuracy of a machine learning algorithm by the train-and-test paradigm, where the system is provided a training set for learning and then we test its predictions on unseen test cases. We first discuss how to compute a prediction for a single test case, then how to compute an overall prediction score for a set of test cases. Class probabilities can be derived from Equation 1 as follows [14, Sec.2.2.2]. Let Y denote a ground par-RV to be classified, which we refer to as the target variable. For example, a ground atom may be Intelligence(jack ). In this example, we refer to jack as the target entity. Write X−Y for a database instance that specifies the values of all ground par-RVs, except for the target, which are used to predict the target node. Let [X−Y , y] denote the completed database instance where the target node is assigned value y. The log-linear model uses the likelihood P ([X−Y , y]) as the joint score of the label and the predictive features. The conditional probability is proportional to this score: P (y|X−Y ) ∝ P ([X−Y , y])
(2)
where the joint distribution on the right-hand side is defined by Equation 1, and the scores of the possible class labels need to be normalized to define conditional probabilities.
7
SQL Implementation. The obvious approach to computing the log-linear score would be to use the likelihood computation of Section V-C for the entire database. This is inefficient because only instance counts that involve the target entity change the classification probability. This means that we need only consider query instantiations that match the appropriate logical variable with the target entity (e.g., S = jack). For a given set of random variables, target entity instantiation counts can be represented in a contingency table that we call the target contingency table. Figure 8 shows the format of a contingency table for target entities jack resp. jill.
VII. E VALUATION Our experimental study describes how FACTOR BASE can be used to implement a challenging machine learning application: Constructing a Bayesian network model for a relational database. Bayesian networks are a good illustration of typical challenges and how RDBMS capabilities can address them because: (1) Bayesian networks are widely regarded as a very useful model class in machine learning and AI, that supports decision making and reasoning under uncertainty. At the same time, they are considered challenging to learn from data. (2) Database researchers have proposed Bayesian networks for combining databases with uncertainty [30]. (3) A Bayesian network with par-RVs can be easily converted to other firstorder representations, such as a Markov Logic Network; see [4]. We describe the system and the datasets we used. Code was written in MySQL Script and Java, JRE 1.7.0. and executed with 8GB of RAM and a single Intel Core 2 QUAD Processor Q6700 with a clock speed of 2.66GHz (no hyper-threading). The operating system was Linux Centos 2.6.32. The MySQL Server version 5.5.34 was run with 8GB of RAM and a single core processor of 2.2GHz. All code and datasets are available on-line [24].
Target Contingency Tables jack_Capability_(P,S)_CT sid Count Cap.(P,S) RA(P,S) Salary(P,S) Jack 5 N/A N/A F Jack 5 4 high T …. …. …. …. …. jill_Capability_(P,S)_CT sid Count Cap.(P,S) RA(P,S) Salary(P,S) Jill 3 N/A N/A F Jill 7 4 high T … …. …. …. …. Figure 8.
Target contingency tables for target = jack and for target = jill.
Assuming that for each node with ID @parRVID@, a target contingency table named CDB .target @parRVID@ CT has been built in the Count Database CDB , the loglikelihood SQL is as in Section V-C. For instance, the contribution of the Capability(P, S) family is computed by the SQL query shown, but with the contingency table jack Capability(P,S) CT in place of Capability(P,S) CT. The new problem is finding the target contingency table. SQL allows us to solve this easily by restricting counts to the target entity in the WHERE clause. To illustrate, suppose we want to modify the contingency table query of Figure 6 to compute the contingency table for S = jack. We add the student id to the SELECT clause, and the join condition S.s id = jack to the WHERE clause; see Table IV.The FROM clause is the same as in Figure 6. The metaquery of Figure 6 is easily changed to produce these SELECT and WHERE clauses. Next consider a setting where a model is to be scored against an entire test set. For concreteness, suppose the problem is to predict the intelligence of a set of students Intelligence(jack ), Intelligence(jill ), Intelligence(student3 ), . . . , Intelligence(studentm ). SQL supports block access where we process the test instances as a block. Intuitively, instead of building a contingency table for each test instance, we build a single contingency table that stacks together the individual contingency tables (Figure 8). Blocked access can be implemented in a beautifully simple manner in SQL: we simply add the primary key id field for the target entity to the GROUP BY list; see Table IV.
A. Datasets We used six benchmark real-world databases. For detailed descriptions and the sources of the databases, please see [24] and the references therein. Table V summarizes basic information about the benchmark datasets. IMDb is the largest dataset in terms of number of total tuples (more than 1.3M tuples) and schema complexity. It combines the MovieLens database3 with data from the Internet Movie Database (IMDb)4 following [22]. TABLE V.
DATASETS CHARACTERISTICS . #T UPLES = TOTAL NUMBER OF TUPLES OVER ALL TABLES IN THE DATASET.
#Relationship Tables/ Total 1/3 2/4 2/4 2/4 3/7 3/7
Dataset Movielens Mutagenesis UW-CSE Mondial Hepatitis IMDb
# par-RV 7 11 14 18 19 17
#Tuples 1,010,051 14,540 712 870 12,927 1,354,134
Table V provides information about the number of par-RVs generated for each database. More complex schemas generate more random variables. B. Bayesian Network Learning For learning the structure of a first-order Bayesian network, we used FACTOR BASE to implement the previously existing learn-and-join algorithm (LAJ). The model search strategy of the LAJ algorithm is an iterative deepening search for 3 www.grouplens.org, 4 www.imdb.com,
1M version July 2013
8
TABLE IV. Access Single Block
SQL QUERIES FOR COMPUTING TARGET CONTINGENCY TABLES SUPPORTING TEST SET PREDICTION . AND ARE AS IN F IGURE 6.
SELECT COUNT(*) AS count, , S.sid COUNT(*) AS count, , S.sid
WHERE AND S.s id = jack
correlations among attributes along longer and longer chains of relationships. For more details please see [26]. The previous implementation of the LAJ algorithm posted at [24], limits the par-factors so they contain at most two relationship par-RVs; FACTOR BASE overcomes this limitation. A major design decision is how to make sufficient statistics available to the LAJ algorithm. In our experiments we followed a pre-counting approach where the count manager constructs a joint contingency table for all par-RVs in the random variable database. An alternative would be on-demand counting, which computes many contingency tables, but only for factors that are constructed during the model search [17]. Pre-counting is a form of data preprocessing: Once the joint contingency table is constructed, local contingency tables can be built quickly by summing (Group By). Different structure learning algorithms can therefore be run quickly on the same joint contingency table. For our evaluation, pre-counting has several advantages. (1) Constructing the joint contingency table presents a maximally challenging task for the count manager. (2) Separating counting/data access from model search allows us to assess separately the resources required for each task. C. Results Table VI reports the number of sufficient statistics for constructing the joint contingency table. This number depends mainly on the number of par-RVs. The number of sufficient statistics can be quite large, over 15M for the largest dataset IMDb. Even with such large numbers, constructing contingency tables using the SQL metaqueries is feasible, taking just over 2 hours for the very large IMDb set. The number of Bayesian network parameters is much smaller than the number of sufficient statistics. The difference between the number of parameters and the number of sufficient statistics measures how compactly the BN summarizes the statistical information in the data. Table VI shows that Bayesian networks provide very compact summaries of the data statistics. For instance for the Hepatitis dataset, the ratio is 12, 374, 892/569 > 20, 000. The IMDb database is an outlier, with a complex correlation pattern that leads to a dense Bayesian network structure. TABLE VI.
Dataset Movielens Mutagenesis UW-CSE Mondial Hepatitis IMDb
1,010,051 14,540 712 870 12,927 1,354,134
# Sufficient Statistics (SS) 252 1,631 2,828 1,746,870 12,374,892 15,538,430
SS Computing Time (s) 2.7 1.67 3.84 1,112.84 3,536.76 7,467.85
number of parameters. The parameter manager provides fast maximum likelihood estimates for a given structure. This is because computing a local contingency table for a BN family is fast given the joint contingency table. TABLE VII.
M ODEL M ANAGER E VALUATION .
# Edges in Bayes Net
Dataset Movielens Mutagenesis UW-CSE Mondial Hepatitis IMDb
Parameter Learning Time (s) 0.57 0.98 1.14 60.55 429.15 505.61
# Bayes Net Parameters
72 124 112 141 207 195
292 721 241 339 569 60,059
Figure 9 compares computing predictions on a test set using an instance-by-instance loop, with a separate SQL query for each instance, vs. a single SQL query for all test instances as a block (Table IV). Table VIII specifies the number of test instances for each dataset. We split each benchmark database into 80% training data, 20% test data. The test instances are the ground atoms of all descriptive attributes of entities. The blocked access method is 10-100 faster depending on the dataset. The single access method did not scale to the large IMDb dataset (timeout after 12 hours). TABLE VIII. Dataset #instance
Movielens 4,742
# OF T EST I NSTANCES
Mutagenesis 3,119
UW-CSE 576
Mondial 505
Hepatitis 2,376
IMDb 46,275
50000 23210.52
18756
5544.01 4052.43
5000
957.37
1064.12 693.42
500
109.2
C OUNT M ANAGER : S UFFICIENT S TATISTICS AND PARAMETERS # Database Tuples
GROUP BY , S.sid
80.18 54.44
61.79
50
Movielens Mutagenesis Mondial
#BN Parameters 292 721 241 339 569 60,059
Table VII shows that the graph structure of a Bayesian network contains a small number of edges relative to the
Blocked Instances
UW-CSE
Hepatitis
IMDB
Instance-by-instance
Figure 9. Times (s) for Computing Predictions on Test Instances. The right red column shows the time for looping over single instances using the Single Access Query of Table IV. The left blue column shows the time for the Blocked Access Query of Table IV.
Table IX reports result for the complete learning of a Bayesian network, structure and parameters. It benchmarks
Related Work
9
FACTOR BASE against functional gradient boosting, a state-ofData Type MultiRelational the-art multi-relational learning approach. MLN Boost learns SingleTable a Markov Logic Network, and RDN Boost a Relational Dependency Network. We used the Boostr implementation [13]. Data Management Data Management Files+ To make the results easier to compare across databases and Files+ Database Main Memory Database systems, we divide the total running time by the number of parMain Memory RVs for the database (Table V). Table IX shows that structure Alchemy MADLib Weka Task PSL learning with FACTOR BASE is fast: even the large complex MLBase R Boostr Bismarck database IMDb requires only around 8 minutes/par-RV. ComProbLog Inference Unipivot Parameter Structure pared to the boosting methods, FACTOR BASE shows excellent MauveDB Learning Learning scalability: neither boosting method terminates on the IMDb FactorBase BayesStore Tuffy database, and while RDN Boost terminates on the MovieLens Tuffy Felix Felix database, it is almost 5,000 times slower than FACTOR BASE. Much of the speed of our implementation is due to quick access to sufficient statistics. As the last column of Table IX Figure 10. A tree structure for related work in the design space of machine learning × data management shows, on the larger datasets FACTOR BASE spends about 80% of computation time on gathering sufficient statistics viaPresentation Title At Venue the count manager. This suggests that a large speedup for to multi-relational data is after a preprocessing step where the boosting algorithms could be achieved if they used the multiple interrelated tables are converted to a single data table. FACTOR BASE in-database design. When the learning task is classification, such preprocessing is We do not report accuracy results due to space constraints often called propositionalization [14]. This “flattening” of the and because predictive accuracy is not the focus of this paper. relational structure typically involves a loss of information. On the standard conditional log-likelihood metric, as defined 1) RDBMS Learning: Leveraging RDBMS capabilities by Equation 2, the model learned by FACTOR BASE performs through SQL programming is the unifying idea of the recent better than the boosting methods on all databases. This is MADLib framework [11]. An advantage of the MADLib consistent with the results of previous studies [26]. approach that is shared by FACTOR BASE is that in-database TABLE IX. L EARNING T IME C OMPARISON ( SEC ) WITH OTHER processing avoids exporting the data from the input database. STATISTICAL - RELATIONAL LEARNING SYSTEMS . NT = NON - TERMINATION The Apache Spark [2] framework includes MLBase and SparkSQL that provide support for distributed processing, SQL, and Dataset RDN Boost MLN Boost FB-Total FB-Count MovieLens 5,562 N/T 1.12 0.39 automatic refinement of machine learning algorithms and modMutagenesis 118 49 1 0.15 els [15]. Other RDBMS applications include gathering suffiUW-CSE 15 19 1 0.27 cient statistics [9], and convex optimization [6]. The MauveDB Mondial 27 42 102 61.82 system [3] emphasizes the importance of several RDBMS Hepatitis 251 230 286 186.15 IMDb N/T N/T 524.25 439.29 features for combining statistical analysis with databases. As in FACTOR BASE, this includes storing models and associated Conclusion. FACTOR BASE leverages RDBMS capabilities parameters as objects in their own right, and using the view for scalable management of statistical analysis objects. It mechanism to update statistical objects as the data change. A efficiently constructs and stores large numbers of sufficient difference is that MauveDB presents model-based views of the statistics and parameter estimates. The RDBMS support for data to the user, whereas FACTOR BASE presents views of the statistical-relational learning translates into orders of magnimodels to machine learning applications. tude improvements in speed and scalability. 2) RDBMS Inference: Wong et al. applied SQL operators such as the natural join to perform log-linear inference with a single-table graphical model [32] stored in an RDBMS. VIII. R ELATED W ORK Monte Carlo methods have also been implemented with an The design space for combining machine learning with data RDBMS to perform inference with uncertain data [12], [31]. management systems offers a number of possibilities, several The MCDB system [12] stores parameters in database tables of which have been explored in previous and ongoing research. like FACTOR BASE . We selectively review the work most relevant to our research. Figure 10 provides a tree structure for the research landscape. B. Multi-Relational Learning A. Single-Table Machine Learning Most machine learning systems, such as Weka or R, support learning from a single table or data matrix only. The singletable representation is appropriate when the data points represent a homogeneous class of entities with similar attributes, where the attributes of one entity are independent of those of others [14]. The only way a single-table system can be applied
For overviews of multi-relational learning please see [7], [4], [14]. Most implemented systems, such as Aleph and Alchemy, use a logic-based representation of data derived from Prolog facts, that originated in the Inductive Logic Programming community [5]. 1) RDBMS Learning: The ClowdFlows system [16] allows a user to specify a MySQL database as a data source, then
10
converts the MySQL data to a single-table representation using propositionalization. Singh and Graepel [28] present an algorithm that analyzes the relational database system catalog to generate a set of nodes and a Bayesian network structure. This approach utilizes SQL constructs as a data description language in a way that is similar to our Schema Analyzer. Differences include the following. (1) The Bayesian network structure is fixed and based on latent variables, rather than learned for observable variables only, as in our case study. (2) The RDBMS is not used to support learning after random variables have been extracted from the schema. Qian et al. [25] discuss work related to the contingency table problem and introduce contingency table algebra. Their paper focuses on a Virtual Join algorithm for computing sufficient statistics that involve negated relationships. They do not discuss integrating contingency tables with other structured objects for multi-relational learning. 2) RDBMS Inference: Database researchers have developed powerful probabilistic inference algorithms for multi-relational models. The BayesStore system [30] introduced the principle of treating all statistical objects as first-class citizens in a relational database as FACTOR BASE does. The Tuffy system [20] achieves highly reliable and scalable inference for Markov Logic Networks (MLNs) with an RDBMS. It leverages inference capabilities to perform MLN parameter learning. RDBMS support for local search parameter estimation procedures, rather than closed-form maximum-likelihood estimation, has also been explored [6], [20], [21]. IX.
C ONCLUSION AND F UTURE W ORK
Compared to traditional learning with a single data table, learning for multi-relational data requires new system capabilities. In this paper we described FACTOR BASE , a system that leverages the existing capabilities of an SQL-based RDBMS to support statistical-relational learning. Representational tasks include specifying metadata about structured firstorder random variables, and storing the structure of a learned model. Computational tasks include storing and constructing sufficient statistics, and computing parameter estimates and model selection scores. We showed that SQL scripts can be used to implement these capabilities, with multiple advantages. These advantages include: 1) Fast program development through high-level SQL constructs for complex table and count operations. 2) Managing large and complex statistical objects that are too big to fit in main memory. For instance, some of our benchmark databases require storing and querying millions of sufficient statistics. While FACTOR BASE provides good solutions for each of these system capabilities in isolation, the ease with which large complex statistical-relational objects can be integrated via SQL queries is a key feature. Because information about random variables, sufficient statistics, and models is all represented in relational database tables, a machine learning application can access and combine the information in a uniform way via SQL queries. Empirical evaluation on six benchmark databases showed significant scalability advantages from utilizing the RDBMS capabilities: Both structure and parameter learning scaled well
to millions of data records, beyond what previous multirelational learning systems can achieve. Future Work. Further potential application areas for FAC TOR BASE include managing massive numbers of aggregate features for classification [23], and collective matrix factorization [27], [28]. While our implementation has used simple SQL plus indexes, there are opportunities for optimizing RDBMS operations for the workloads required by statistical-relational structure learning. These include view materialization and the key scalability bottleneck of computing multi-relational sufficient statistics. NoSQL databases can exploit a flexible data representation for scaling to very large datasets. However, SRL requires count operations for random complex join queries, which is a challenge for less structured data representations. An important goal is a single RDBMS package for both learning and inference that integrates FACTOR BASE with inference systems such as BayesStore and Tuffy. There are several fundamental system design choices whose trade-offs for SRL warrant exploration. These include the choice between pre-counting and post-counting sufficient statistics, and using main memory vs. RDBMS disk storage. For instance, model selection scores can be cached in either main memory or the database. Our SQL-based approach facilitates using distributed computing systems such as SparkSQL [1], which have shown great potential for scalability. In sum, we believe that the succesful use of SQL presented in this paper shows that relational algebra can play the same role for multi-relational learning as linear algebra for single-table learning: a unified language for both representing statistical objects and for computing with them. ACKNOWLEDGEMENT This research was supported by a Discovery grant to Oliver Schulte by the Natural Sciences and Engineering Research Council of Canada. Zhensong Qian was supported by a grant from the China Scholarship Council. A position paper based on this work was presented at the StarAI 2015 workshop. We thank the workshop reviewers and participants for helpful comments. R EFERENCES [1]
[2] [3] [4] [5] [6]
[7] [8]
M. Armbrust, R. S. Xin, C. Lian, Y. Hua, D. Liu, J. K. Bradley, X. Meng, T. Kaftan, M. J. Franklin, A. Ghodsi, and M. Zaharia. Spark SQL: Relational data processing in Spark. In SIGMOD Conference, To Appear, 2015. A. S. P. Contributors. Apache Spark. http://spark.apache.org/. A. Deshpande and S. Madden. MauveDB: supporting model-based user views in database systems. In SIGMOD, pages 73–84. ACM, 2006. P. Domingos and D. Lowd. Markov Logic: An Interface Layer for Artificial Intelligence. Morgan and Claypool Publishers, 2009. S. Dzeroski and N. Lavrac. Relational Data Mining. Springer, Berlin, 2001. X. Feng, A. Kumar, B. Recht, and C. R´e. Towards a unified architecture for in-RDBMS analytics. In SIGMOD Conference, pages 325–336, 2012. L. Getoor and B. Taskar. Introduction to Statistical Relational Learning. MIT Press, 2007. L. Getoor, B. Taskar, and D. Koller. Selectivity estimation using probabilistic models. ACM SIGMOD Record, 30(2):461–472, 2001.
11
[9]
[10] [11]
[12]
[13] [14] [15]
[16] [17]
[18]
[19]
[20]
[21]
[22] [23]
[24] [25] [26] [27] [28] [29]
[30]
[31]
[32]
G. Graefe, U. M. Fayyad, and S. Chaudhuri. On the efficient gathering of sufficient statistics for classification from large SQL databases. In KDD, pages 204–208, 1998. D. Heckerman, C. Meek, and D. Koller. Probabilistic entity-relationship models, PRMs, and plate models. In Getoor and Taskar [7]. J. M. Hellerstein, C. R´e, F. Schoppmann, D. Z. Wang, E. Fratkin, A. Gorajek, K. S. Ng, C. Welton, X. Feng, K. Li, and A. Kumar. The MADlib analytics library: Or MAD skills, the SQL. PVLDB, 5(12):1700–1711, Aug. 2012. R. Jampani, F. Xu, M. Wu, L. L. Perez, C. M. Jermaine, and P. J. Haas. MCDB: a monte carlo approach to managing uncertain data. In SIGMOD Conference, pages 687–700, 2008. T. Khot, J. Shavlik, and S. Natarajan. Boostr. http://pages.cs.wisc.edu/ tushar/Boostr/. A. Kimmig, L. Mihalkova, and L. Getoor. Lifted graphical models: a survey. Machine Learning, 99(1):1–45, 2015. T. Kraska, A. Talwalkar, J. C. Duchi, R. Griffith, M. J. Franklin, and M. I. Jordan. MLbase: A distributed machine-learning system. In CIDR, 2013. N. Lavraˇc, M. Perovˇsek, and A. Vavpetiˇc. Propositionalization online. In ECML, pages 456–459. Springer, 2014. Q. Lv, X. Xia, and P. Qian. A fast calculation of metric scores for learning Bayesian network. Int. J. of Automation and Computing, 9:37– 44, 2012. B. Milch, B. Marthi, S. J. Russell, D. Sontag, D. L. Ong, and A. Kolobov. BLOG: probabilistic models with unknown objects. In IJCAI-05, pages 1352–1359, 2005. A. W. Moore and M. S. Lee. Cached sufficient statistics for efficient machine learning with large datasets. J. Artif. Intell. Res. (JAIR), 8:67– 91, 1998. F. Niu, C. R´e, A. Doan, and J. W. Shavlik. Tuffy: Scaling up statistical inference in Markov Logic Networks using an RDBMS. PVLDB, 4(6):373–384, 2011. F. Niu, C. Zhang, C. R´e, and J. Shavlik. Felix: Scaling Inference for Markov Logic with an Operator-based Approach. ArXiv e-prints, Aug. 2011. V. Peralta. Extraction and integration of MovieLens and IMDb data. Technical report, Technical Report, Laboratoire PRiSM, 2007. A. Popescul and L. Ungar. Feature generation and selection in multirelational learning. In Introduction to Statistical Relational Learning [7], chapter 16, pages 453–476. Z. Qian and O. Schulte. The BayesBase system, 2015. www.cs.sfu.ca/ ∼oschulte/BayesBase/BayesBase.html. Z. Qian, O. Schulte, and Y. Sun. Computing multi-relational sufficient statistics for large databases. In CIKM, pages 1249–1258. ACM, 2014. O. Schulte and H. Khosravi. Learning graphical models for relational data via lattice search. Machine Learning, 88(3):331–368, 2012. A. P. Singh and G. J. Gordon. Relational learning via collective matrix factorization. In SIGKDD, pages 650–658. ACM, 2008. S. Singh and T. Graepel. Automated probabilistic modeling for relational data. In CIKM, pages 1497–1500. ACM, 2013. T. Walker, C. O’Reilly, G. Kunapuli, S. Natarajan, R. Maclin, D. Page, and J. W. Shavlik. Automating the ILP setup task: Converting user advice about specific examples into general background knowledge. In ILP, pages 253–268, 2010. D. Z. Wang, E. Michelakis, M. Garofalakis, and J. M. Hellerstein. BayesStore: managing large, uncertain data repositories with probabilistic graphical models. In VLDB, volume 1, pages 340–351, 2008. M. L. Wick, A. McCallum, and G. Miklau. Scalable probabilistic databases with factor graphs and MCMC. In PVLDB, volume 3, pages 794–804, 2010. S. M. Wong, C. J. Butz, and Y. Xiang. A method for implementing a probabilistic model as a relational database. In UAI, pages 556–564, 1995.
A PPENDIX We provide details about the Schema Analyzer. Table X shows the relational schema of the Random Variable Database. Figure 11 shows dependencies between the tables of this schema. TABLE X.
S CHEMA FOR R ANDOM VARIABLE DATABASE
Table Name AttributeColumns Domain Pvariables 1Variables 2Variables Relationship
Schema TABLE NAME, COLUMN NAME COLUMN NAME, VALUE Pvid, TABLE NAME 1VarID, COLUMN NAME, Pvid 2VarID, COLUMN NAME, Pvid1, Pvid2, TABLE NAME RVarID, TABLE NAME, Pvid1, Pvid2, COLUMN NAME1, COLUMN NAME2
INFORMATION_SCHEMA COLUMNS
TABLES
KEY_COLUMN_USAGE
Schema_Key_Info
Schema_Position_Info
KeyColumns
AttributeColumns
EntityTables
ForeignKeyColumns
PVariables
2Variables
1Variables
RelationTables
ForeignKeys_pvars
RNodes_MM_Selff
RNodes_MM_NotSelf
Relationship
Figure 11.
Tables Dependency in the Random Variable Database VDB .
/*AchemaAnalyzer.sql*/ DROP SCHEMA IF EXISTS @database@_AchemaAnalyzer; CREATE SCHEMA @database@_AchemaAnalyzer; CREATE SCHEMA CREATE SCHEMA
if not exists @database@_BN; if not exists @database@_CT;
USE @database@_AchemaAnalyzer; SET storage_engine=INNODB; CREATE TABLE Schema_Key_Info AS SELECT TABLE_NAME, COLUMN_NAME, REFERENCED_TABLE_NAME, REFERENCED_COLUMN_NAME, CONSTRAINT_NAME FROM INFORMATION_SCHEMA.KEY_COLUMN_USAGE WHERE (KEY_COLUMN_USAGE.TABLE_SCHEMA = ’@database@’) ORDER BY TABLE_NAME;
12
CREATE TABLE Schema_Position_Info AS SELECT COLUMNS.TABLE_NAME, COLUMNS.COLUMN_NAME, COLUMNS.ORDINAL_POSITION FROM INFORMATION_SCHEMA.COLUMNS, INFORMATION_SCHEMA.TABLES WHERE (COLUMNS.TABLE_SCHEMA = ’@database@’ AND TABLES.TABLE_SCHEMA = ’@database@’ AND TABLES.TABLE_NAME = COLUMNS.TABLE_NAME AND TABLES.TABLE_TYPE = ’BASE TABLE’) ORDER BY TABLE_NAME; CREATE TABLE NoPKeys AS SELECT TABLE_NAME FROM Schema_Key_Info WHERE TABLE_NAME NOT IN (SELECT TABLE_NAME FROM Schema_Key_Info WHERE CONSTRAINT_NAME LIKE ’PRIMARY’); CREATE table NumEntityColumns AS SELECT TABLE_NAME, COUNT(DISTINCT COLUMN_NAME) num FROM Schema_Key_Info WHERE CONSTRAINT_NAME LIKE ’PRIMARY’ OR REFERENCED_COLUMN_NAME IS NOT NULL GROUP BY TABLE_NAME; CREATE TABLE TernaryRelations as SELECT TABLE_NAME FROM NumEntityColumns WHERE num > 2;
CREATE TABLE AttributeColumns AS SELECT TABLE_NAME, COLUMN_NAME FROM Schema_Position_Info WHERE (TABLE_NAME , COLUMN_NAME) NOT IN (SELECT TABLE_NAME, COLUMN_NAME FROM KeyColumns) and TABLE_NAME NOT IN (SELECT TABLE_NAME FROM NoPKeys) and TABLE_NAME NOT IN (SELECT TABLE_NAME FROM TernaryRelations); ALTER TABLE AttributeColumns ADD PRIMARY KEY (TABLE_NAME,COLUMN_NAME); CREATE TABLE InputColumns AS SELECT * FROM KeyColumns WHERE CONSTRAINT_NAME = ’PRIMARY’ ORDER BY TABLE_NAME; CREATE TABLE ForeignKeyColumns AS SELECT * FROM KeyColumns WHERE REFERENCED_COLUMN_NAME IS NOT NULL ORDER BY TABLE_NAME; ALTER TABLE ForeignKeyColumns ADD PRIMARY KEY (TABLE_NAME,COLUMN_NAME, REFERENCED_TABLE_NAME); CREATE TABLE EntityTables AS SELECT distinct TABLE_NAME, COLUMN_NAME FROM KeyColumns T
WHERE 1 = (SELECT COUNT(COLUMN_NAME) FROM KeyColumns T2 WHERE T.TABLE_NAME = T2.TABLE_NAME AND CONSTRAINT_NAME = ’PRIMARY’); ALTER TABLE EntityTables ADD PRIMARY KEY (TABLE_NAME,COLUMN_NAME); CREATE TABLE SelfRelationships AS SELECT DISTINCT RTables1.TABLE_NAME AS TABLE_NAME, RTables1.REFERENCED_TABLE_NAME AS REFERENCED_TABLE_NAME, RTables1.REFERENCED_COLUMN_NAME AS REFERENCED_COLUMN_NAME FROM KeyColumns AS RTables1, KeyColumns AS RTables2 WHERE (RTables1.TABLE_NAME = RTables2.TABLE_NAME) AND (RTables1.REFERENCED_TABLE_NAME = RTables2.REFERENCED_TABLE_NAME) AND (RTables1.REFERENCED_COLUMN_NAME = RTables2.REFERENCED_COLUMN_NAME) AND (RTables1.ORDINAL_POSITION < RTables2.ORDINAL_POSITION); ALTER TABLE SelfRelationships ADD PRIMARY KEY (TABLE_NAME); CREATE TABLE Many_OneRelationships AS SELECT KeyColumns1.TABLE_NAME FROM KeyColumns AS KeyColumns1, KeyColumns AS KeyColumns2 WHERE (KeyColumns1.TABLE_NAME , KeyColumns1.COLUMN_NAME) IN (SELECT TABLE_NAME, COLUMN_NAME FROM InputColumns) AND (KeyColumns2.TABLE_NAME , KeyColumns2.COLUMN_NAME) IN (SELECT TABLE_NAME, COLUMN_NAME FROM ForeignKeyColumns) AND (KeyColumns2.TABLE_NAME , KeyColumns2.COLUMN_NAME) NOT IN (SELECT TABLE_NAME, COLUMN_NAME FROM InputColumns); CREATE TABLE PVariables AS SELECT CONCAT(EntityTables.TABLE_NAME, ’0’) AS Pvid, EntityTables.TABLE_NAME, 0 AS index_number FROM EntityTables UNION SELECT CONCAT(EntityTables.TABLE_NAME, ’1’) AS Pvid, EntityTables.TABLE_NAME, 1 AS index_number FROM EntityTables, SelfRelationships WHERE EntityTables.TABLE_NAME = SelfRelationships.REFERENCED_TABLE_NAME AND EntityTables.COLUMN_NAME = SelfRelationships.REFERENCED_COLUMN_NAME; ALTER TABLE PVariables ADD PRIMARY KEY (Pvid); CREATE TABLE RelationTables AS SELECT DISTINCT ForeignKeyColumns.TABLE_NAME, ForeignKeyColumns.TABLE_NAME IN (SELECT TABLE_NAME FROM SelfRelationships) AS SelfRelationship, ForeignKeyColumns.TABLE_NAME IN (SELECT TABLE_NAME FROM Many_OneRelationships) AS Many_OneRelationship FROM ForeignKeyColumns; ALTER TABLE RelationTables ADD PRIMARY KEY (TABLE_NAME);
13
CREATE TABLE 1Variables AS ForeignKeys_pvars1.TABLE_NAME = ForeignKeys_pvars2.TABLE_NAME SELECT CONCAT(’‘’, COLUMN_NAME, ’(’, Pvid, ’)’, ’‘’) AS 1VarID, AND RelationTables.TABLE_NAME = ForeignKeys_pvars1.TABLE_NAME COLUMN_NAME, AND ForeignKeys_pvars1.ARGUMENT_POSITION < Pvid, ForeignKeys_pvars2.ARGUMENT_POSITION index_number = 0 AS main FROM AND PVariables ForeignKeys_pvars1.index_number < ForeignKeys_pvars2.index_number NATURAL JOIN AND RelationTables.SelfRelationship = 1 AttributeColumns; AND RelationTables.Many_OneRelationship = 0; ALTER TABLE 1Variables ADD PRIMARY KEY (1VarID); ALTER TABLE 1Variables ADD UNIQUE(Pvid,COLUMN_NAME); CREATE TABLE ForeignKeys_pvars AS SELECT ForeignKeyColumns.TABLE_NAME, ForeignKeyColumns.REFERENCED_TABLE_NAME, ForeignKeyColumns.COLUMN_NAME, Pvid, index_number, ORDINAL_POSITION AS ARGUMENT_POSITION FROM ForeignKeyColumns, PVariables WHERE PVariables.TABLE_NAME = REFERENCED_TABLE_NAME; ALTER TABLE ForeignKeys_pvars ADD PRIMARY KEY (TABLE_NAME,Pvid, ARGUMENT_POSITION); CREATE table Relationship_MM_NotSelf AS SELECT CONCAT(’‘’, ForeignKeys_pvars1.TABLE_NAME, ’(’, ForeignKeys_pvars1.Pvid, ’,’, ForeignKeys_pvars2.Pvid, ’)’, ’‘’) AS orig_RVarID, ForeignKeys_pvars1.TABLE_NAME, ForeignKeys_pvars1.Pvid AS Pvid1, ForeignKeys_pvars2.Pvid AS Pvid2, ForeignKeys_pvars1.COLUMN_NAME AS COLUMN_NAME1, ForeignKeys_pvars2.COLUMN_NAME AS COLUMN_NAME2, (ForeignKeys_pvars1.index_number = 0 AND ForeignKeys_pvars2.index_number = 0) AS main FROM ForeignKeys_pvars AS ForeignKeys_pvars1, ForeignKeys_pvars AS ForeignKeys_pvars2, RelationTables WHERE ForeignKeys_pvars1.TABLE_NAME = ForeignKeys_pvars2.TABLE_NAME AND RelationTables.TABLE_NAME = ForeignKeys_pvars1.TABLE_NAME AND ForeignKeys_pvars1.ARGUMENT_POSITION < ForeignKeys_pvars2.ARGUMENT_POSITION AND RelationTables.SelfRelationship = 0 AND RelationTables.Many_OneRelationship = 0; CREATE table Relationship_MM_Self AS SELECT CONCAT(’‘’, ForeignKeys_pvars1.TABLE_NAME, ’(’, ForeignKeys_pvars1.Pvid, ’,’, ForeignKeys_pvars2.Pvid, ’)’, ’‘’) AS orig_RVarID, ForeignKeys_pvars1.TABLE_NAME, ForeignKeys_pvars1.Pvid AS Pvid1, ForeignKeys_pvars2.Pvid AS Pvid2, ForeignKeys_pvars1.COLUMN_NAME AS COLUMN_NAME1, ForeignKeys_pvars2.COLUMN_NAME AS COLUMN_NAME2, (ForeignKeys_pvars1.index_number = 0 AND ForeignKeys_pvars2.index_number = 1) AS main FROM ForeignKeys_pvars AS ForeignKeys_pvars1, ForeignKeys_pvars AS ForeignKeys_pvars2, RelationTables WHERE
CREATE table Relationship_MO_NotSelf AS SELECT CONCAT(’‘’, ForeignKeys_pvars.REFERENCED_TABLE_NAME, ’(’, PVariables.Pvid, ’)=’, ForeignKeys_pvars.Pvid, ’‘’) AS orig_RVarID, ForeignKeys_pvars.TABLE_NAME, PVariables.Pvid AS Pvid1, ForeignKeys_pvars.Pvid AS Pvid2, KeyColumns.COLUMN_NAME AS COLUMN_NAME1, ForeignKeys_pvars.COLUMN_NAME AS COLUMN_NAME2, (PVariables.index_number = 0 AND ForeignKeys_pvars.index_number = 0) AS main FROM ForeignKeys_pvars, RelationTables, KeyColumns, PVariables WHERE RelationTables.TABLE_NAME = ForeignKeys_pvars.TABLE_NAME AND RelationTables.TABLE_NAME = PVariables.TABLE_NAME AND RelationTables.TABLE_NAME = KeyColumns.TABLE_NAME AND RelationTables.SelfRelationship = 0 AND RelationTables.Many_OneRelationship = 1; CREATE table Relationship_MO_Self AS SELECT CONCAT(’‘’, ForeignKeys_pvars.REFERENCED_TABLE_NAME, ’(’, PVariables.Pvid, ’)=’, ForeignKeys_pvars.Pvid, ’‘’) AS orig_RVarID, ForeignKeys_pvars.TABLE_NAME, PVariables.Pvid AS Pvid1, ForeignKeys_pvars.Pvid AS Pvid2, KeyColumns.COLUMN_NAME AS COLUMN_NAME1, ForeignKeys_pvars.COLUMN_NAME AS COLUMN_NAME2, (PVariables.index_number = 0 AND ForeignKeys_pvars.index_number = 1) AS main FROM ForeignKeys_pvars, RelationTables, KeyColumns, PVariables WHERE RelationTables.TABLE_NAME = ForeignKeys_pvars.TABLE_NAME AND RelationTables.TABLE_NAME = PVariables.TABLE_NAME AND RelationTables.TABLE_NAME = KeyColumns.TABLE_NAME AND PVariables.index_number < ForeignKeys_pvars.index_number AND RelationTables.SelfRelationship = 1 AND RelationTables.Many_OneRelationship = 1; CREATE TABLE Relationship AS SELECT * FROM Relationship_MM_NotSelf UNION SELECT * FROM Relationship_MM_Self UNION SELECT * FROM Relationship_MO_NotSelf UNION SELECT * FROM
14
Relationship_MO_Self; ALTER TABLE Relationship ADD PRIMARY KEY (orig_RVarID); ALTER TABLE ‘Relationship‘ ADD COLUMN ‘RVarID‘ VARCHAR(10) NULL , ADD UNIQUE INDEX ‘RVarID_UNIQUE‘ (‘RVarID‘ ASC) ;
CREATE TABLE 2Variables AS SELECT CONCAT(’‘’, COLUMN_NAME, ’(’, Pvid1, ’,’, Pvid2, ’)’, ’‘’) AS 2VarID, COLUMN_NAME, Pvid1, Pvid2, TABLE_NAME, main FROM Relationship NATURAL JOIN AttributeColumns; ALTER TABLE 2Variables ADD PRIMARY KEY (2VarID);