Journal of Computing and Information Technology - CIT 16, 2008, 4, 303–309 doi:10.2498 /cit.1001398
303
Graphical Model: The Means for Simulation-based Learning Nerijus Aukstakalnis, Kazys Baniulis, Jurate Pauliute and Asta Slotkiene Department of Computer Networking, Kaunas University of Technology, Lithuania
Simulation-based e-learning is recently budding demand for the next generation of e-learning. Learning about dynamic phenomena is essential in many domains. That approach allows the student to imitate real processes using models and to obtain knowledge and experience during the process of learning. The proposed graphical modelling method is based on systematic point of view, experiential learning and expert-based modelling requirements. The contextual graph of action specification is used as a basis to set the requirements for service software specification and attributes of learning objects (LO). The paper presents the enhanced architecture of the student self-evaluation and on-line assessment system TestTool (TT). The system is explored as an assessment engine capable of supporting and improving the individualized self-instructional and simulation-based mode of learning, grounded on the GRID distributed service architecture. This architecture, services and method are being examined in study modules for Kaunas University of Technology (KTU) students and some organizations. Keywords: assessment, learning, flexible educational model, domain of knowledge, ontology
1. Introduction Traditional e-learning is mainly based on the information transfer paradigm – which is sometimes referred to as first generation e-learning – is now past the market creation phase and well into a value creation phase. E-learning technologies, on which it is based, are advancing rapidly; new is the recent and budding demand for the next of e-learning – simulation-based e-learning generation.
Several driving forces are influencing the attitude of organizations towards corporate learning and development: global competition, increase of information and communication technology, and rising interest of corporations in attracting and developing human resources. Add to that, work environments change ever more rapidly, and workers must learn gradually while working. These forces naturally lead to the increased use of technology for efficient and effective management of corporate learning. One feature leading the request for e-learning is simulation capability [5]. Learning about dynamic phenomena is essential in many domains. Learners must be able to recognize, perceive, initiate and explain dynamical phenomena flow causes and effects. That approach allows the student to imitate real processes using models and to obtain knowledge and experience during the process of learning.
The paper presents graphical modelling (GM) method, which satisfies systematic point of view, experiential learning and expert-based modelling requirements. The method is implemented by using the enhanced architecture of the student self-evaluation and on-line assessment system TestTool. The system is explored as an assessment engine capable of supporting and improving the individualized self-instructional and Corporations are presently convinced of the benefits of incorporating e-learning in their learn- simulation-based mode of learning, grounded ing and development strategies. Corporations on the GRID distributed service architecture. are utilizing e-learning tools and techniques to This architecture, services and method are betrain and develop their labour force. Corpo- ing examined in study modules for KTU sturate use of e-learning is growing exponentially. dents and some organizations.
304
2. System and Model Any learning subject can be treated as a system. We can define the system as a group of elements interacting between each other, in order to achieve a goal [2]. Particularly emphasized is a systematic point of view, which is controversial to partial or dotted point of view to appearances considered. Systematic point of view to appearances highlights interaction between elements of the system which forms integral system, both in ordinary life, politics, economics or scientific research. We intend to use systematic point of view in models and simulations.
Graphical Model: The Means for Simulation-based Learning
and update the learner model about the domain knowledge. Most systems apply a rule-based approach to induce a procedural model. Both the weaknesses and strengths of procedural knowledge representations are derived from the fact that they are use-specific. Procedural models are as varied as the context they’re applied to, the subject they simulate and the imagination of designers. Consequently, procedural models integration into the other learning content becomes almost impossible.
3.2. Static Graphical Model 3. Simulation-based Learning Simulations have long held great promise in education and in training. Simulation-based learning is a social process of learning of practices [5] that involves building connections: connections among what is being learned and what is important to the actor, connections among what is being learned and those situations in which it is applied. Learning corresponds to an incremental process of acquisition of new knowledge pieces and learning of a new knowledge structure. There are different strategies of simulation-based learning
To achieve teaching goals, static model can be applied, which allows a student to analyze and construct real processes. One of such models is a graphical model. It consists of movable graphical components which can be manipulated by the student on the computer monitor [4]. The graphical models are created by the expert of domain, which systematically describes the knowledge structure of the subject. The graphical modelling approach will help to deliver the right content episodes to the user, basically the decisions they make while using the simulation.
3.1. Procedural Models
3.3. Expert-based Modelling
Mostly, Intelligent Tutoring Systems (ITS) represent domain knowledge as a procedural model or a declarative model. Procedural models represent subject domain by a network of procedures, sub-procedures, etc., down to a set of primitive actions [9]. In this kind of model, the main knowledge to be communicated is procedural, i.e. knowledge about how to perform a task. The aim is to achieve a level of description, which enables learner’s performance to be associated directly with individual components of the procedural network. In this case, the components are not independent, that is, one cannot simply delete any components. This kind of model has strong diagnostic capabilities.
The expert-based modelling is based on the idea that the learner is somehow a mini-expert and his deficiencies are only a lack of quantitative knowledge [9]. An expert-based system has the goal of transferring the expert knowledge to the student, which makes the student and expert knowledge states equal.
In a procedural model, ITS compares the learner’s answer with an intermediate result of an action that an expert performs in order to create
The knowledge domain representation of the tutoring system is thought to be a representation of some expert’s knowledge and it is implemented according to subject rules and contexts. In this way, the student model is simply the representation of whatever knowledge the learner has taken to be a subset of the expert’s knowledge. Furthermore, each of the learners is associated to a specific subset of knowledge states, which define the student’s knowledge.
305
Graphical Model: The Means for Simulation-based Learning
4. The Method of Construction of Graphical Model 4.1. Domain of Knowledge According to Knowledge Space Theory, a domain of knowledge is a collection Q of items (e.g., learning objects, problems, questions, exercises, examples, etc.) in a given field of knowledge (e.g., mathematics, physics, chemistry, biology, etc.) [8]. Then, the knowledge state of a student is the set X of all items in Q that this student actually masters. Knowledge and skills are gained gradually: attending lectures, reading books, performing practical exercises, communicating with colleagues and so on. The learning act performs implication f: Q→P, where P is knowledge and skills gained using didactical knowledge acquisition techniques. Learning objects from set Q can be grouped into difficulty levels, which means defined relation ϕ between elements of this set and its parts (Figure 1). That way we get a knowledge tree of the discipline where we can identify recommended sequence of knowledge mastering. Relation ϕ may be defined as follows: 1. Expert questioning; 2. Didactics and learning plan analysis;
Subject model is a whole of learning objects realized according to collection Q of items. Further on, we analyze the possibilities of LO implementation by making graphical questions so that it meets systematic point of view and didactical requirements. Such set is called a graphical model. 4.2. The Foundation of Graphical Model: Experiential Learning The knowledge construction approach is expressed by the principles of experiential learning, which are based on the analysis of current activity and the decision using the possibilities of experimentations. This way of learning was introduced by D. Kolb [7] and its main feature is that the only active construction of knowledge and skills allows the learner to gain new experience and progressively use it in making more and more complex decisions. Active experimentation allows learners to test what they have learned in the new, more complex situations. The assumption is that individuals seldom learn from experience unless they assess the experience, assigning their own meaning in terms of their own goals and aims. Hence, assessment is one of the key characteristics of experiential learning.
3. Systemically structuring problem scope; 4. Analysis of skill, requirements and competencies. So set Q can be decomposed into a sequence of subsets {Q1, Q2, . . . }, where relation ϕ is valid between them.
4.3. Modified Contextual Graph All decisions which require simulation are based on one or more active operations e.g. change of object properties, change of location, etc. Designer can construct branched model of knowledge acquisition, filling up these models with If Then rules. Brezillon [6] present context-based representation for modelling task accomplishment by users called contextual graphs and its interest for the tasks of incremental acquisition. Contextual graph is a context-based representation of the model execution tasks and it consists of the following three nodes [3, 4]: 1. Contextual node C, which specifies the knowledge and skills that will be adapted to a given situation;
Figure 1. Domain of knowledge illustration.
2. Action node A is an active element, which specifies an operation that must be performed;
306
Graphical Model: The Means for Simulation-based Learning
3. The node of recombination (achievement of partial goal).
5. A Case Study. Simulation-based Learning Environment TestTool
Contextual graph is acyclic. Every contextual element is a pair of nodes: a contextual node and a recombination node [6].
5.1. An Example of Knowledge Construction for Graphical Model
In this paper we present modified contextual graph (CG+). Differently from Brezillon [6] contextual graph definition, CG+ allows the cycles. In a modified contextual graph CG+, contextual and recombination nodes are independent. Each contextual node doesn’t finish with the recombination node.
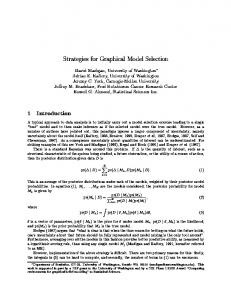
In the nuclear fission, graphical model nuclear reactions are described by the rules. Nuclear reactions exist as follows: α radiate, β radiate, spontaneous nucleus fission, nuclear fission interacting with other nuclear (Figure 2), etc.
4.4. Graphical Model In this paper we describe simulation environment realized by using graphical tests. A student can manipulate the elements of the graphical situation during the process of learning in order to make correct imitation of the real situation [4]. The knowledge structure of graphical model is based on the modified contextual graphs. Statements describing the graphical model: • Satisfies systematic requirements; • Satisfies experiential learning requirements;
Figure 2. Schema of nuclear fission.
Modified contextual graph of nuclear fission (Figure 3) is constructed according to the rules presented in Table 1. There are seven possible scenarios of nuclear fission (Table 2). All scenarios start from contextual node C1. Scenario 7 is cyclic.
• Satisfies expert-based modelling requirements; • The main feature of the graphical situation is the manipulation of the graphical objects: change of location, impact on state, make structure, add required elements and remove unnecessary elements [4]; • A graphical situation is evaluated to be compared with the expert designed decisions; • When a situation is solved, a part of the previous graphical objects is used for solving the next situation; • Learning scenario is defined as a sequence of interrelated graphical situations. The creation of a graphical model shows the structure of knowledge in a particular subject and increases the conceptual understanding in standard situations of the target domain.
Figure 3. Modified contextual graph of nuclear fission.
In the simulating environment, a learner is given the situations, which he solves by manipulating the given objects. For example, in the initial situation (Figure 4) a student evaluates two conditions (Nucleus of an element is not stable – C1.true, particle α is radiated – C2.true) and performs action A1 – nucleus turns to an atomic nucleus that has 2 protons and 2 neutrons less (Figure 5).
Graphical Model: The Means for Simulation-based Learning
Rule
Description of the Rules
R1
If Nucleus of an element is not stable (C1) Then R2 Else R3 If Particle α is radiated (C2) Then Nucleus turns to an atomic nucleus that has 2 protons and 2 neutrons less (A1). Goal G Else Particle β radiated. Nucleus turns to an atomic nucleus that has 1 neutron more (A2). Goal G If Particle α is attached (C3) Then Nucleus turns to an atomic nucleus that has 3 protons more and 1 neutron is radiated (A3). Goal G Else R4 If Neutron is attached (C4) Then R5 Else Goal G
R2
R3
R4 R5
R6
If The chemical element is uranium (C5) Then Nucleus splits to two nucleuses and two neutrons are radiated (A5). R6 Else Nucleus turns to an atomic nucleus that has 3 protons less and helium nucleus is radiated (A4). Goal G If Nucleus division takes place (C6) then R5 Else Goal G
307
Figure 4. The screenshot of initial graphical situation of the β radiate.
Table 1. Rules of modified contextual graph. Scenarios
Decomposition
1 scenario 2 scenario 3 scenario 4 scenario 5 scenario 6 scenario 7 scenario
C1, C2, A1 C1, C2, A2 C1, C3, A3 C1, C3, C4 C1, C3, C4, C5, A4 C1, C3, C4, C5, A5, C6 C1, C3, C4, C5, A5, C6, C5, A4
Table 2. Scenarios of decomposition.
Figure 5. The right decision of graphical situation of the β radiate.
5.2. Graphical Simulation Environment TestTool TestTool Graphical simulation environment consists of two parts: the authoring tool for the author and the simulation environment for the learner. The authoring tool is used by an expert of the domain to implement knowledge structure of graphical model. The authoring tool itself took place many technical facilities (drawing objects, the collection of simulation control elements, explanations of errors in textual and graphical representation, metadata, multimedia and sound effects). It allows creating the active type of learning objects of high interactivity level.
As we mentioned before, static graphical model consists of changeable and not changeable graphical objects and actions of simulation with them. By using them, a student solves given tasks. On the other hand, in the concrete situation not all changeable objects are necessary to achieve the goal. The distribution is judged by the rules of the modified contextual graph. When designing the graphical model according to the modified contextual graph we can create complete possibilities to experiment in the standard situations and to assess student skills used to pursue the goal.
308
5.3. Assessment Web Service and GRID Based on the integrity and interoperability of distributed learning object systems, the experimental TestTool version for GRID was implemented [10, 11] In order to transform the existing TestTool system to the GRIDTT version, the following steps are needed: 1. The TestTool system based on the Web services is created as a distributed system. The GRIDTT system consists of three large subsystems of services: Client, LO Repository closely linked with LO Registry, Learner Repository (LR). A Client is a general subsystem which realizes interfaces for the GRIDTT users. LO repository is the service for the storage, registration and retrieval of LOs. LR is a learners’ database containing individual student data records and testing results. The typical service sequence for a learner is: • a student logs in through LR and chooses an eligible test from the list; • LO Registry is searched for the chosen test, LO Repository address and LO identification data are retrieved; • LR calls LO factory and creates instant aggregated questions; • a learner communicates with the visualized LO to answer the questions; • LO sends the answers and the evaluations to the LR. 2. To fulfill knowledge domain requirements, Course model and Learner model solutions are performed [1]. 6. Conclusions and Discussion Functionally, the general knowledge acquisition process can be divided into three categories of learning goals: to know the theory and methods; to know the theory and methods and be able to use them in standard situations; to know the theory and methods and be able to use them in unknown situations. The first category can be (more or less) considered as contentcentered approach. Graphical modelling belongs to the second category of knowledge acquisition, which enables problem-oriented decisions in standard situations. The latter one in-
Graphical Model: The Means for Simulation-based Learning
cludes more complex simulation models, which enable a user to create more purposeful space of actions. Implementation of graphical models requires having an adequate knowledge model. The proposed method of the structured adapting modified contextual graphs clearly decomposes graphical situations and reasoning process in each process of learning. Knowledge structure of the graphical model is like planning paradigm that accomplishes high-level tasks by decomposing them into simpler tasks during problem solving. The Assessment Web service GRIDTT is explored as an assessment and simulation engine capable of supporting and improving the individualized self-instructional and simulation-based mode of learning, grounded on the GRID distributed service architecture. TestTool graphical assessment and simulation environment has been already used for five years for the Data structures (DS) study module (400 students per year, two universities, five faculties). For two years the TestTool environment has been used by Algorithm construction laboratories in the introductory course “Computer sciences and programming” (four faculties), as well as in the courses “Artificial Intelligence” and “IT in Education”. TT knowledge testing environment is used as a tutorial for mobile phone operators. Teachers of all courses noted, that use of simulation environment in the practice mode and in the assessment mode is a very convenient and helps motivating student. For example, in Data Structure course students work with models of various hierarchical DS algorithms: AVL tree, B-tree, hashing, index files, B-tree in file, etc. Later, students have to program one of these algorithms, using Java programming language. It has been noticed that students willingly choose to program hashing method only when they have worked with graphical models. References [1] N. AUKSTAKALNIS, K. BANIULIS, B. TAMULYNAS, Intelligence and flexibility of learning and knowledge testing environments. WMSCI 2005: The 9th World Multiconference on Systemics, Cybernetics and Informatics, July 10–13, 2005, Orlando, Florida, USA: proceedings. Vol. VII. Orlando: International Institute of Informatics and Systemics, 2005. ISBN 980-6560-59-0. pp. 172–177.
Graphical Model: The Means for Simulation-based Learning
[2] R. ASHBY, An Introduction to Cybernetics. Chapman & Hall, 1964. http://pcp.vub.ac.be/ books/IntroCyb.pdf (Link was valid 2008 April). [3] K. BANIULIS, A. SLOTKIEN˙E, Assessment Web Service as a Tool to Structure the Knowledge. International Conference: Advanced Learning Technologies and Applications. Conference Proceedings, 2007, ISBN 978-9955-751-07-9. pp. 83–89. [4] K. BANIULIS, A. SLOTKIEN˙E, J. PAULIUTE˙ , Knowledge Modelling Dynamic Phenomena. Young Researchers’ Works. – ISSN 1648–8776 – Nr.2(2007), pp. 108–112. [5] M. BAUER, D. WILLIAMSON, R. MISLEVY, J. BEHRENS, Using Evidence-Centered Design to Develop Advanced Simulation-based Assessment and Training. World Conference on elearning in Corp., Govt., Health. & Higher Ed. 2003(1), pp. 1495–1502. [Online]. Available: http://dl.aace.org/13955. [6] P. BREZILLON, Task-realization Models in Contextual Graphs. Modeling and Using Context, 5th International and Interdisciplinary Conference, Contex 2005, Paris, France, July 5–8, 2005, Proceedings. ISBN 3-540-26924-X. pp. 55–58. [7] D. KOLB, Experiential learning: experience as the source of learning and development. Englewood Clifs, NJ: Prentice-Hall, 1984. [8] L. STEFANUTTI, D. ALBERT, C. HOCKEMEYER, Derivation of knowledge structures for distributed learning objects. Proc. of the 3-rd International LeGE-WG Workshop: GRID Infrastructure to support future technology enhanced learning, Berlin, Germany. 2003. [9] X. NIU, Purpose-Based Learner Modeling. Proceedings of the Grad Symposium, CS Dept, University of Saskatchewan. [10] V. REKLAITIS, K. BANIULIS, T. OKAMOTO, Shaping e-Learning applications for a service-oriented GRID. 2nd International LeGE-WG Workshop on e-Learning and Grid Technologies: A Fundamental Challenge for Europe, Paris, France. 3rd & 4th March 2003. [11] B. TAMULYNAS, N. AUKSTAKALNIS, K. T. BANIULIS, Enhanced learning and understanding in knowledge testing environments. ITI 2007: Proceedings of the 29th International Conference on Information Technology Interfaces, June 25-28, 2007, Dubrovnik, Croatia, University of Zagreb, University Computing Centre. 2007, ISBN978-953-7138-09-7, pp. 287–292.
309
Received: June, 2008 Accepted: September, 2008 Contact addresses: Nerijus Aukstakalnis Department of Computer Networking Kaunas University of Technology Studentu 50, 51368 Kaunas Lithuania e-mail:
[email protected] Kazys Baniulis Department of Computer Networking Kaunas University of Technology Studentu 50, 51368 Kaunas Lithuania e-mail:
[email protected], Jurate Pauliute Department of Computer Networking Kaunas University of Technology Studentu 50, 51368 Kaunas Lithuania e-mail:
[email protected] Asta Slotkiene Department of Computer Networking Kaunas University of Technology Studentu 50, 51368 Kaunas Lithuania e-mail:
[email protected]
DR. KAZYS BANIULIS is associate professor at Informatics Faculty in Kaunas University of Technology. He has many years of experience in teaching information technologies in education, instructional design, programming and data structures, as well as supervision of master’s degree and PhD students in the field of technology enhanced learning. Ten years ago he initiated design of graphical testing and modelling system Testtool. Since 1995 he is an active member of the European Tempus, Copernicus, FR5 and FR6 projects: “Flexible and Distance Learning”, “Multimedia Applications in Telematic Educational Networks”, “Learning Grid of Excellence Working Group”, ”European Learning Grid Infrastructure”.
NERIJUS AUKSTAKALNIS currently is a PhD student of informatics engineering at Kaunas University of Technology. His PhD thesis is about learning process control using domain ontology. He has worked as junior research assistant at the Informatics Faculty, Computer Networking Department. His research interests include simulation–based e-learning, learning process control, ontologies and artificial intelligence.
ASTA SLOTKIENE is a PhD student of informatics engineering at Kaunas University of Technology. Her PhD thesis is about active learning object information models. Her research interests include simulation-based elearning, active learning object design and development. Currently, she is a lecturer at the Department of Information Technology, University of Siauliai. JURATE PAULIUTE is currently a lecturer at the Department of Computer Networking in Kaunas University of Technology. She took a degree in mathematics from Vilnius University. Her research interests include structure data, distance learning, medical statistics, multimedia and web design.