Epidemiology Biostatistics and Public Health - 2013, Volume 10, Number 4
Biostatistics
Standardised regression coefficient as an effect size index in summarising findings in epidemiological studies Pentti Nieminen(1), Heli Lehtiniemi(1, 2), Kirsi Vähäkangas(3), Antti Huusko(2), Arja Rautio(2)
Background: a major problem in evaluating and reviewing the published findings of studies on the association between a quantitative explanatory variable and a quantitative dependent variable is that the results are analysed and reported in many different ways. To achieve an effective review of different studies, a consistent presentation of the results is necessary. This paper aims to exemplify the main topics related to summarising and pooling research findings from multivariable models with a quantitative response variable. Methods: we outline the complexities involved in synthesising associations. We describe a method by which it is possible to transform the findings into a common effect size index which is based on standardised regression coefficients. To describe the approach we searched original research articles published before January 2012 for findings of the relationship between polychlorinated biphenyls (PCBs) and birth weight of new-borns. Studies with maternal PCB measurements and birth weight as a continuous variable were included. Results: the evaluation of 24 included articles reveled that there was variation in variable measurement methods, transformations, descriptive statistics and inference methods. Research syntheses were performed summarizing regression coefficients to estimate the effect of PCBs on birth weight. A birth weight decline related to increase in PCB level was found. ConclusionS: the proposed method can be useful in quantitatively reviewing published studies when different exposure measurement methods are used or differential control of potential confounding factors is not an issue. Erratum: the first published version of the study contained an error on page 12 (Appendix A) that was corrected on February 18, 2014.
Key words: Statistical reporting; Standardised regression coefficient; Health outcomes; Meta-analysis; Research synthesis
(1) Medical Informatics and Statistics Research Group, University of Oulu, Finland (2) Thule Institute, University of Oulu, Finland (3) Faculty of Health Sciences, University of Eastern Finland, Finland
Corresponding author: Pentti Nieminen, Medical Informatics and Statistics Research Group, University of Oulu, P.O. Box 5000, FIN-90014 Oulu, Finland. Tel: +358 29 4485109; Fax: +358 8 5375111. e-mail:
[email protected] DOI: 10.2427/8854
Effect size index for epidemiological studies
e8854-1
Epidemiology Biostatistics and Public Health - 2013, Volume 10, Number 4
Biostatistics
Introduction Summarizing the results of published studies is an important part of any research and provides also the essential content for metaanalysis [1]. To achieve an effective review of different studies, a consistent presentation of their results is necessary [2]. There are many different statistical methods to analyse the relation of an explanatory measure with a continuous dependent outcome variable. For a reader this becomes more difficult when research articles include inadequate reporting of research methods and basic statistics. Medical research articles using statistical methods have always been at risk of poor reporting [3]. Results across repeated studies of the same phenomena are rarely identical due to various reasons, for instance size of the study, differences in the used analytical methods and genetic differences between the studied populations [1]. Review of original articles and research synthesis extends our knowledge through the combination and comparison of the original studies. When using systematic literature review to learn from combined studies, we are dependent on the research methodology and reporting of the underlying studies. Although the principal aim of these studies is identical, e.g. to measure the relationship between an explanatory factor and a response variable, different statistical methods are used in different publications. Some studies use correlation coefficients, some apply multivariable regression methods and some studies compare mean values. Often the explanatory factors in original studies are measured with different methods and units of measurement. The quality of reporting also varies: detailed descriptive statistics of the variables under study are not given in all articles, and standard error for regression coefficients or the mean differences are not always available. The task of summarizing these studies in a consistent manner thus appears challenging. The measure used to represent study findings in meta-analysis is called an effect size statistic. Which statistic is appropriate depends upon the nature of the research findings, the statistical forms in which they are reported, and the hypotheses being tested by the metaanalysis [4]. The effect size statistic to evaluate association between the explanatory and e8854-2
dependent variable should embody information about the magnitude of association between these variables with possible adjustment of covariates. Multivariable relationships present special challenges to meta-analysis because effect size statistics of interest depend on what other variables are included in the multivariable analysis. Also, the omission of the full correlation matrix from most reports makes it impossible for the reader to evaluate the dependence between the explanatory variables. As an example, we examine maternal exposure to polychlorinated biphenyls (PCBs) and birth weight of new-borns. Low birth weight is considered to be associated with a variety of adverse effects in childhood and beyond, including poor school performance, high blood pressure, cardiovascular disease, stroke, obesity and depression [5-8]. Therefore even a small increased risk of low birth weight has important public health implications and any knowledge of such an effect on potential reasons is important. Several factors have been proven to be associated with an increased risk of giving birth to low birth weight babies: mother’s age, smoking, race, nutritional status and weight before pregnancy, infections, socioeconomic status and educational level [6, 9, 10]. Premature birth is by far the most common cause of low birth weight. It has been also speculated that exposure to environmental contaminants may have an effect on birth weight [6, 11, 12]. PCBs are persistent organic pollutants ubiquitously present in ecosystems. Associations of exposure to PCBs with low birth weight have been observed in several studies, while other studies have found no convincing evidence of such associations [11-15]. The main purposes of this paper are to point out the complexities and potential problems in a critical review of association between a quantitative response variable and one primary quantitative explanatory variable, and to present an effect size approach based on standardised regression coefficients. To exemplify this we carried out a systematic literature review to ensure a comprehensive summary of the available evidence about the effect of maternal exposure to PCBs on the birth weight of their children.
Effect size index for epidemiological studies
Epidemiology Biostatistics and Public Health - 2013, Volume 10, Number 4
Biostatistics
METHODS Standardised regression coefficient as an effect size index When synthesizing the multivariable associations between quantitative variables the regression coefficients are natural measures of interest. Because exposure is often measured using different methods and metrics across the studies, the direct pooling of regression coefficients is not meaningful. In such a case standardised regression coefficients may offer a solution. They are the estimates resulting from an analysis carried out on variables that have been standardized so that their variances are equal to one [16]. Therefore, standardised coefficients refer to how many standard deviations the response or outcome variable will change per a standard deviation increase in the exposure variable. Thus standardised coefficient can be used as an effect size estimate when the exposure levels in original studies are measured in different units of measurement. Procedures to convert test statistics into effect size index (with SE) In systematic reviews studies addressing the same research question are selected to be included in one research synthesis (or meta-analysis). Often reviewers refer to the problem of different statistical methods and strategies being used to analyse the relationship between the response and exposure variables [4, 17]. In the following, we will show how the results expressed as correlation coefficients, linear regression coefficients or mean differences can be re-expressed as a standardized effect size index measuring the association between response and exposure level. The derivation of standard errors is also described. The different approaches are summarized in Appendix A (Supplementary Materials). Several formulas in Appendix A require the standard deviation (SD) for response and exposure variables. In most of the evaluated articles these are not given. In those articles we can estimate these statistics using various methods depending on the data available in the article. The different approaches are summarized in Appendix B (Supplementary Materials).
Observed standardised regression coefficient β is an easily interpretable effect size measure. It has the following interpretation: • An effect size value not significantly different from zero supports the null hypothesis that there is no association between the exposure level and response variable. • A negative β value supports the hypothesis that high exposure level decreases the response. If the upper limit of confidence interval is below zero then the association is considered statistically significant. • A positive β value supports the hypothesis that high exposure level increases the response. If the lower limit of confidence interval is above zero then the association is considered statistically significant. Pooled estimate of effect size index In meta-analysis one combines the findings (and effect sizes) from reviewed studies. The problem is that every observed effect size is not equal with regard to the reliability of the information it carries. The way this is handled is to weigh each effect size value by a term that represents its precision. An optimal approach is to weigh each effect size by the inverse of the squared standard error of the effect size value. Thus the formula for computing the associated standard error must also be identified. To obtain the summary effect of all reviewed studies, we computed the weighted average effect size using the following formula
where k=number studies, wi is the standard regression coefficient from study i, wi is the inverse of (SE(βi))2. The variance (SE(βi))2 could be calculated using fixed effects or random effects model [17, 18]. The software package Comprehensive Meta-analysis [17] software was used in this study for the meta-analysis. Identification of articles for an example We systematically searched Medline, Scopus
Effect size index for epidemiological studies
e8854-3
Epidemiology Biostatistics and Public Health - 2013, Volume 10, Number 4
Biostatistics
and Web of Science (from inception to January 2012), with no language restrictions, for studies in humans of the association between birth weight and maternal PCB levels. The literature was searched using the terms “polychlorinated biphenyls “and “birth weight”, either as thesaurus terms or in title or as abstract terms with synonyms and closely related words which are available upon request from the authors. In the next step, relevant articles (as judged on basis of the article type, title and abstract) were retrieved for more detailed evaluation. Only original research articles were included. Finally, all retrieved articles were screened to determine which met any of the following criteria for exclusion: 1=birth weight was not an outcome, 2=PCBs were not reported as exposure variables, 3=data about birth weight or PCBs was insufficient, 4=there was overlap with other studies or a repetition of a previous study. From the overlapping studies the most recent with the highest number of cases was included because it had the most comprehensive data. The main outcome measure was birth weight of the newborns measured as a continuous variable. A total of 140 articles were identified in the first screen, for which titles and abstracts were reviewed. In the second step, 51 original articles were considered as relevant studies and they were retrieved for detailed evaluation. After full review, 27 articles met at least one of the exclusion criteria, and thus were excluded. Finally, 24 studies were included in our review. Evaluation of statistical procedures and reporting across studies All 24 included papers were manually reviewed for their content. Two independent reviewers (PN and HL) performed the extraction of data from the full articles. Disagreements were resolved by discussion and consensus. The following study information was collected: place of the study, years of the study, measure of exposure, PCB compounds and characteristics of the parents and adjusted covariates. Types and frequencies of statistical methods were also systematically recorded and classified. Especially, we reviewed whether the effect of several explanatory variables on the outcome variable (birth weight) was simultaneously analysed and which confounding factors were controlled using regression models. e8854-4
To evaluate the quality of reporting, the following information was recorded for each study: (1) whether sample size and data analysis procedures were completely described in the report’s methods section, (2) whether mean value and standard deviation of birth weight were reported, (3) whether location and variation of PCB distribution were reported, and (4) whether the exact P-value was reported.
RESULTS Baseline characteristics of the included studies are reported in Table 1. Note that PCBs were measured using different methods and metrics across the studies. In the evaluated papers several different statistical methods were applied to analyse the identical research question of the relationship between a quantitative response variable (birth weight) and a quantitative exposure variable (maternal PCB level). These included correlation coefficient methods (Pearson correlation and nonparametric correlation coefficients) and linear regression models where the full information from continuous variables is utilized. In almost half of the studies (11 of 24 studies) the PCB levels were categorized to two or more groups, and mean values of the birth weight between exposure groups were compared using t-test, analysis of variance or analysis of covariance. However, categorizing continuous explanatory variables is not recommended in statistical literature [19, 20]. The statistical methods used in the articles were as follows: correlation coefficient in 6 articles (25.0%), univariate linear regression (2 articles, 8.3%), multivariate linear regression (16 articles, 66.7%), analysis of covariance (5 articles, 20.8%), comparison of mean values (8 articles, 33.3%) and nonparametric methods for comparing groups (6 articles, 25.0 %). Note that in some articles more than one method was used. In 18 of the publications included in this review, information was collected on potential confounding variables and the reported regression coefficients were adjusted for these confounding factors. Table 2 provides information about the covariates and adjusted factors included in the estimated regression models of the evaluated articles.
Effect size index for epidemiological studies
Epidemiology Biostatistics and Public Health - 2013, Volume 10, Number 4
Biostatistics
TABLE 1 Baseline characteristics of the included studies Study
Year of data collection
Place of study
Population
PCB assessment
Reported PCB variable
Bergonzi [28]
2006
Province of Brescia, Italy
Caucasian women, resident for >15 years in Brescia, undergoing planned caesarean section at the University Hospital of Brescia
Maternal serum
Sum of 30 PCB congeners
Nice area, France
86 mothers delivering healthy boys (gestational age ≥34 weeks) at two maternity wards in Southern France
Mother’s milk
Sum of seven PCB congeners (28, 52, 101, 118, 138, 153, 180)
Mother’s milk
Sum of six PCB congeners (28, 52, 101, 138, 153, 180)
BruckerDavis [34]
2002-2005
Chao [35]
2001
Taichung, Taiwan
30 primipara mothers without clinical complications between the ages 2035 in Chung Shan Medical University Hospital
Fein [36]
1980-1981
Lake Michigan, USA
Newly delivered mothers in four hospitals located near Lake Michigan, who were asked to report their consumption of Lake Michigan fish
Cord serum
PCBs based on Aroclor 1260
Maternal serum
PCBs based on Aroclor 1254
Givens [37]
1976-1998
Michigan, USA
450 mothers from cohort of 4000 men, women and children who had consumed contaminated food products. These mothers conceived and gave birth from 1973 to 1997 to infants who were potentially exposed in utero
Gladen [38]
1993-1994
Kyiv and Dniprodzerzhinsk, Ukraine
197 singleton infants drawn from the general population born in two cities (participants in Children of Ukraine study)
Mother’s milk
Sum of PCB congeners 153 and 132
Faroe Islands
182 pregnant women with spontaneous singleton term births at the National Hospital in Tórshavn. The cohort was based on the primary catchment area away from the capital area of Tórshavn
Maternal serum
Sum of 28 detectable PCB congeners
Denmark
100 nulliparous women who gave birth to singleton full-term infants, aged 2535 years with normal pre-pregnancy BMI were selected according to their intake of fatty fish from the Danish National Birth Cohort
Maternal serum
Sum of six PCB congeners (105, 118, 138, 153, 156, 180)
1964-1967
San Francisco Bay Area, USA
Subset of the Child Health and Development study, a cohort of about 20000 pregnant women either attending prenatal clinics or giving birth at Kaiser Foundation Health Plan Medical Centers
Maternal serum
Sum of nine PCB congeners
Jackson [42]
1996-1999
16 New York State Counties surrounding Lakes Erie and Ontario, USA
Women enrolled in the Prospective Pregnancy Study of the New York State Angler Cohort Study prior to attempting pregnancy
Maternal serum
Sum of 74 PCB congeners
Karmaus [5]
1973-1991
Michigan, USA
Births that occurred after 1968 in cohort of Michigan anglers (Great Lakes Fish Eater Study)
Maternal serum
PCBs based on Aroclor 1260
Grandjean [39]
Halldorsson [40]
HertzPicciotto [41]
1994-1995
1998-2002
Effect size index for epidemiological studies
e8854-5
Epidemiology Biostatistics and Public Health - 2013, Volume 10, Number 4
Biostatistics
TABLE 1 (CONTINUED) Baseline characteristics of the included studies Study
Year of data collection
Place of study
Population
PCB assessment
Reported PCB variable
Maternal serum
Sum of 12 dioxinlike PCB congeners
Maternal serum
Sum of 11 PCB congeners
Cord serum
Sum of 14 PCB congeners
Maternal serum
Sum of 76 PCB congeners
Cord serum
Sum of four PCB congeners (118, 138, 153, 180)
Konishi [43]
2002-2005
Sapporo, Hokkaido, Japan
Inborn Infants delivered at the Sapporo Toho Hospital. Mothers were approached if they were 23rd35th weeks of gestation, and no serious illness or any other medical complications
Longnecker [11]
1959-1965
12 U.S. study centres
Pregnant women, delivery of a live-born singleton and availability of a 3 mL aliquot of third-trimester maternal serum
Lucas [44]
1993-1996
Nunavik, Canada
Murphy [12]
1995-1996
New York, USA
1990-1992
Rotterdam, The Netherlands
Patandin [45]
The population under study is represented by Inuit women who lived in 14 coastal villages of Nunavik as well as their infants born at the Tulattavik Health Centre and Inuulitsivik Health Centre A population-based prospective cohort of preconception enrollment of women. Eligibility criteria included age 18-34 years, no physician-diagnosed infertility. Of the eligible women, 69 became pregnant and 55 of these pregnancies resulted in live births Infants born at term 37-42 weeks of gestation, without congenital anomalies or diseases. Participants lived in Rotterdam or its immediate surroundings
Ribas-Fito [46]
1997-1999
Flix, Spain
All children born in the main hospital of the study area
Cord serum
Sum of seven PCB congeners (28, 52, 101, 118, 138, 153, 180)
Sagiv [13]
1993-1998
New Bedford, Massachusetts, USA
A cohort of 722 infants born to mothers residing near a PCB-contaminated harbor and Superfund site
Cord serum
Sum of 51 PCB congeners
Maternal serum
Sum of six PCB congeners (118, 138, 153, 156, 170, 180)
Sonneborn [47]
2002-2004
Eastern Slovakia
Mother-child pairs recruited from two districts: one with high PCB contamination in the environment and one with low levels of PCBs. Mothers were enrolled at the time they came to the hospital for delivery
Tajimi [24]
1999-2000
Tokyo, Japan
Pregnant 240 mothers aged 25-34 years who had resided in Tokyo for more than 5 years
Mother’s milk
Sum of 12 coplanar PCB congeners
Tan [48]
2006
Singapore
41 native Singaporean mothers admitted to the National Hospital of Singapore for cesarean section
Cord serum
Sum of PCBs 132 and 153
Vartiainen [49]
1987
Helsinki and Kuopio, Finland
All consecutive women from one of the maternity clinics in Helsinki and one clinic in Kuopio, a total of 167 mothers
Mother’s milk
No details
Weisskopf [50]
1993-1995
Great Lakes region, USA
Mothers consuming sport-caught fish
Maternal serum
No details
1998-2002
New York City, USA
Ethnically diverse cohort of motherinfant pairs enrolled at Mount Sinai Hospital during pregnancy, n=404
Maternal serum
Sum of four PCB congeners (118, 138, 153, 180)
Wolff [29]
e8854-6
Effect size index for epidemiological studies
Epidemiology Biostatistics and Public Health - 2013, Volume 10, Number 4
Biostatistics
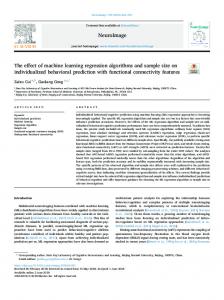
A total of 6 articles reported only a bivariate association between PCB exposure and birth weight. These studies did not adjust the association by other potential factors. In 12 studies gestational age was included as a covariate in the regression model. Other common analysed confounding variables were gender, parity and the following maternal characteristics: smoking, age, height and body mass index (BMI). A complete description of data analysis procedures was not presented in 7 papers (29.2%). Failure to describe the distribution of the primary outcome variable was common; of the 24 evaluated articles, mean value of birth weight was not reported in five articles (20,8%) and standard deviation was missing in 9 articles (37.5%). Location statistics of the PCB level were missing in 3 articles and information about the variation of PCB level was missing in four articles. Furthermore, the exact p-value of the main outcome was not reported in ten of the 24 articles (41.7%). We applied the formulas presented in Appendix A (Supplementary Materials) to transform the reported findings of the reviewed PCB studies to standardized regression coefficients. Table 3 presents the estimated effect size of interest, namely β (standardized regression coefficient) with its standard error for each study. We calculated both unadjusted and adjusted regression coefficients if the required data was reported in the original study. In some studies basic data was not shown and it was impossible to calculate the effect size index. A random-effect meta-analysis was performed to estimate the overall effect sizes for unadjusted and adjusted studies. Figure 1 shows the results of meta-analysis when standardized unadjusted regression coefficient was used as an effect size. The pooled estimate of regression coefficient was -0.046 (95% CI: -0.095, 0.004). Figure 2 shows the meta-analysis of standardized adjusted regression coefficients. The pooled estimate for the adjusted studies is similar to the unadjusted cases: -0.039 (95% CI: -0.076, -0.001). The metaanalyses showed that the high maternal PCB concentration seems to be related with low birth weight.
DISCUSSION Because many original studies for various reasons are relatively small and differ in their statistical content, it is important to have practicable research methods to combine findings from different studies to describe the relationships between exposures and outcomes. Such information is important for policy-makers and authorities when they make recommendations and guidelines for the population. This article presents an approach for the synthesis of an association between a quantitative dependent variable and one main explanatory factor when the exposure measurement methods and controlling of other potential covariates varies between the reviewed studies. We described a method on how it is possible to develop a workable effect size statistic that can be applied to the research findings of interest. We applied this method in a systematic review of studies that evaluated the effect of PCB exposure on infant birth weight. In this meta-analysis we found a weak negative correlation between these variables. Our findings are in line with a recent meta-analysis report within 12 European birth cohorts [15]. In their study, Govarts et al. [15] had access to the original data from the cohorts and used PCB-153 congener as a biomarker of PCB exposure. Using identical exposure variable definitions or conversation factors they estimated for each cohort linear regression model of birth weight on cord serum concentration of PCB-153 adjusted for selected covariates. Meta-analysis produced a combined regression coefficient -0.15 (95% CI: -0.24, -0-05) of cord serum PCB-153 (ug/L), corresponding to a weight decline of 150 g per 1 μg/L increase in cord serum PCB-153. If we apply our estimated regression coefficient (-0.039) to the combined data of Govarts et al. [15] where the standard deviation of combined cord serum PCB-153 was 0.16 μg/L and estimated (given by supplemental material) standard deviation of birth weight was 556 gr then we get a weight decline of 22 g per 0.16 μg/L and a decline of 6.25*22 g = 137.5 g per 1 μg/L. We conclude that our method to combine findings across different published studies with different statistical content support the findings from combined cohorts with identical variables and methods.
Effect size index for epidemiological studies
e8854-7
Epidemiology Biostatistics and Public Health - 2013, Volume 10, Number 4
Biostatistics
TABLE 2 Covariates and adjusted factors used in the evaluated 24 articles Study
Birth outcomes
Maternal factors
Birth GA Gender Parity Smoking Age Education Height Weight BMI Race year
Other
Bergonzi [28]
Unadjusted
BruckerDavis [34]
Unadjusted
Chao [35]
Unadjusted
Fein [36] Givens [37]
X X
Gladen [38]
X
X
X
Halldorsson [40]
X
X
X
X X
X
HertzPicciotto [41]
X
X
Grandjean [39]
Type of delivery, maternal weight gain during pregnancy
X X
X X
X
X
X
X
City
X
Plasma lipid concentration
X
Prenatal care, hypertension, preeclampsia, child’s race, specimen characteristics, medication
X
X
X
X
X
X
X
Jackson [42]
Unadjusted
Karmaus [5]
X
X
Konishi [43]
X
X
Longnecker [11]
X
X
X
X
X
X
X
X
X
X
X
X
X
X X
DDE Inshore fish intake, blood sampling period
X
X
Lucas [44]
Unadjusted
Murphy [12] Patandin [45]
X
Ribas-Fito [46]
X
X
Sagiv [13]
X
X
Sonneborn [47]
X
X
Tajimi [24] Tan [48]
X
X
X X
X Alcohol use, predicted height
X X
X
X
X
X
X
X
X
X
X
X
X
X
Local fish consumption
X
X
X
Inter-pregnancy interval
X
X
Dietary, meat, milk, post pregnancy weight and BMI, previous breastfeeding
X
X
X
X
Vartiainen [49]
Unadjusted
Weisskopf [50]
X
X
Wolff [29]
X
X
e8854-8
Study center, serum level of triglycerides, cholesterol, oxychlordane, DDE
X
X
X X
X
Alcohol use during pregnancy, weeks of breastfeeding
X X
Effect size index for epidemiological studies
X
Pregnancy weight gain
Epidemiology Biostatistics and Public Health - 2013, Volume 10, Number 4
Biostatistics
TABLE 3 Number of study subjects (n), mean value of birth weight (g) (Mean BW) by gender, estimated standard deviation of birth weight (BW SD), statistical method used, unadjusted and adjusted standardized regression coefficient β with standard deviation SE(β) for each evaluated study Study
1
Mean BW
Estimated
Multiple
Bivariate Comparison Unadjusted
n
Boys Girls All
BW SD
Bergonzi [28]
70
3385 3021 3245
466
Brucker-Davis [34]
65
3275
3275
423
X
-0.240 0.122
Chao [35]
30
3140
278
X
- 0.214 0.185
Fein [36]
241
3520
552
-
regression correlation of means
β
dns
1
X
dns
SE(β)
-0.110 0.103
X
Adjusted β
SE(β)
na2
na
-0.136 0.063
Givens [37]
814
3636 3442 3551
533
X
-0.013 0.035 -0.021 0.035
Gladen [38]
162
3433
486
X
-0.004 0.031 -0.101 0.064
Grandjean [39]
182
3801 3537 3672
484
X
Halldorsson [40]
100
3580
435
X
X
-0.161 0.107 -0.273 0.119
Hertz-Picciotto [41]
399
dns
dns
X
-0.180 0.150
Jackson [42]
44
3482
565
Karmaus [5]
168
3457
482
X
-0.067 0.216
-0.035 0.151 -0.104 0.217 -0.444 0.270
Konishi [43]
398
3160 3046 3100
349
X
-0.087 0.053
Longnecker [11]
1034
3193
531
X
0.021 0.071 0.112 0.084
Lucas [44]
351
3567 3438 3502
441
X
0.158 0.102
Murphy [12]
50
3500
580
X
-0.110 0.103
Patandin [45]
179
3514 3411 3466
437
X
-0.091 0.041
Ribas-Fito [46]
70
3245
489
X
Sagiv [13]
722
3416
dns
X
Sonneborn [47]
1057
3325
497
X
Tajimi [24]
240
dns
dns
X
Tan [48]
41
dns
dns
X
Vartiainen [49]
167
3742 3535 3630
527
Weisskopf [50]
143
3544
561
-0.005 0.031 X
na
na
na
0.010 0.0251 X
-0.141 0.064
na
na
-0.080 0.080 X
X
-0.095 0.078 0.028 0.069
Wolff [29] 178 dns dns X dns = data not shown in the article, 2 na = not applicable due to incomplete reporting
El Majidi et al. [14] have also evaluated 20 published epidemiological studies of the relationship between PCBs and birth weight. The reviewed papers were mainly the same as in our study. To facilitate comparisons of results from different papers, El Majidi et al. [14] applied conversion factors to standardize the reported exposure data. Their review of the relationship is more narrative as the authors categorize the studies to those with an observed effect and to ones with non-observed effect on birth weight. They provide no statistical mechanism for synthesizing the data. They conclude that there is a low probability of PCB-related effects on birth weight. However, decisions based on simple counting statistically significant and non-significant studies can be
na
na
na
misleading, especially as the number of studies increases [17, 21]. Approach proposed in our paper allows reviewers to assess the magnitude of the effect, even when direct comparison of studies is difficult. There are some forms of research findings that cannot readily be combined in a metaanalysis using established effect size statistics [4]. These include findings generated by multivariable analysis, e.g. multiple regression, discriminant analysis, factor analysis and structural equation models. Their complexity and diversity across studies with regard to the selection of variables and reporting practices has made it difficult to develop effect size statistics for these forms of research.
Effect size index for epidemiological studies
e8854-9
Epidemiology Biostatistics and Public Health - 2013, Volume 10, Number 4
Biostatistics
FIGURE 1 Observed 95% confidence intervals of the unadjusted standardized regression coefficients from 12 studies estimating the relationship between PCB exposure and infant birth weight Study name
Statistics for each study
Point estimate and 95% CI
Point estimate
Lower limit
Upper limit
p-Value
Bergonzi
-0.110
-0.311
0.091
0.283
Brucker-Davis
-0.240
-0.480
-0.000
0.050
Chao
-0.214
-0.576
0.148
0.246
Givens
-0.013
-0.082
0.055
0.704
Gladen
-0.004
-0.065
0.056
0.894
Halldorsson
-0.161
-0.371
0.048
0.132
Jackson
-0.035
-0.330
0.260
0.816
Karmaus
-0.104
-0.528
0.321
0.632
Longnecker
0.021
-0.118
0.160
0.765
Lucas
0.158
-0.041
0.357
0.120
Tajimi
-0.141
-0.267
-0.015
0.028
Vartiainen
-0.095
-0.248
0.057
0.220
Combined effect
-0.046
-0.095
0.004
0.070
FIGURE 2 Observed 95% confidence intervals of the adjusted standardized regression coefficients from 15 studies estimating the relationship between PCB exposure and infant birth weight. The adjusted covariates are reported in Table 2 Study name
Statistics for each study
Point estimate and 95% CI
Point estimate
Lower limit
Upper limit
Fein
-0.136
-0.259
-0.013
0.031
Givens
-0.021
-0.090
0.048
0.546
p-Value
Gladen
0.010
-0.116
0.136
0.875
Grandjean
-0.070
-0.511
0.371
0.756
Halldorsson
-0.273
-0.507
-0.040
0.022
Hertz-Picciotto
-0.088
-0.382
0.206
0.559
Karmaus
-0.444
-0.973
0.085
0.100
Konishi
-0.087
-0.192
0.018
0.105
Longnecker
0.112
-0.054
0.277
0.185
Murphy
-0.110
-0.311
0.092
0.285
Patandin
-0.091
-0.171
-0.011
0.026
Ritas-Fito
-0.005
-0.066
0.056
0.876
Sonneborn
0.010
-0.039
0.059
0.690
Tan
-0.080
-0.237
0.077
0.317
Weiskopf
0.028
-0.107
0.163
0.682
Combined effect
-0.039
-0.076
-0.001
0.042
e8854-10
Effect size index for epidemiological studies
Epidemiology Biostatistics and Public Health - 2013, Volume 10, Number 4
Biostatistics
Multivariable regression is a flexible method of data analysis that may be appropriate whenever a quantitative dependent variable is to be examined in relationship with any other predictor variables [16, 22]. The synthesis of regression coefficients has received increased attention in recent years due to increased use of multivariable methods in medicine [23]. Becker and Wu [23] present a review of existing methods for the synthesis of regression coefficients and summarizes the main strengths and weaknesses of these methods. According to Becker and Wu [23] the main problems with these methods include different measurement scales of explanatory variables across studies and lack of required information in the study reports. To estimate the independent effect of PCBs on birth weight, the effect of these other covariates should be controlled or adjusted for [16]. Our review revealed differences in the choice of adjusted factors. This is partly understandable because many factors related to the mother modify human foetal growth process in different ways [9, 10]. However, two covariates could be of crucial importance for the interpretation of findings, namely gestational age affecting birth weight and mother’s consumption of fish affecting personal PCB level and possibly also birth weight. While results from most of the studies were routinely adjusted for gestational age, two studies decided not to adjust for gestational age because gestational age is in the causal pathway and not a confounder [12, 24]. Schisterman et al. [25] discussed also this issue and argued that adjustment by gestational age is unnecessary or even potential source of bias, because adjustment by gestational age does not alter the expectation of the causal effect between PCB level and birth weight but may affect the precision of the estimated effect. Statistical methods naturally play a significant role in the studies pursuing associations between explanatory variables and health outcomes [22, 26]. Unfortunately, medical research articles have included poor reporting of statistical methods [3, 27]. The existence of this problem was evident in the set of articles evaluated for this review. In some cases [13, 24, 28, 29] incomplete reporting of statistics in the studies limited or prevented the
use of these studies in this systematic review. Most of the shortcomings in reporting of statistical information in the articles reviewed here were related to basic fundamental topics that are covered in basic introductory books of medical statistics. The main outward reporting of an original research paper should consist of statistical expressions, which summarize the raw data used in the research, including location and variability statistics. The reporting of estimated multivariable regression models needs attachments such as tables and figures reporting descriptive statistics about the distributions of response variables and explanatory variables. This would help other researchers to utilize the results in their approaches to summarize and meta-analyse the magnitude of the effects. A standard method of reporting would certainly improve the ability to compare different studies. There are initiatives which provide guidance on how to appropriately report observational research. One of them is the STROBE Statement aimed to establish a checklist of items that should be included in articles reporting such observational studies [30]. Authors should follow these guidelines. Statistical methods used in studies should not be the basis for inclusion of the studies in meta-analysis [31]. Statistical text books note that the same research question can be analysed with different statistical methods [32, 33]. Our evaluation revealed that this applies also to the association between two quantitative variables (birth weight and PCB level) with potential confounding factors involved. There was variation in variable measurement methods, transformations, descriptive statistics and inference methods. We included studies with various designs, analyses or methodological quality. This resulted in variability among the studies, but also reflects the reality when trying to summarize the findings from observational studies. Comparison of the effect sizes produced by different statistical techniques is a challenge for readers, reviewers and especially those wanting to carry out a meta-analysis. Our approach based on standardized regression coefficients provides a workable effect size index when inference about the size and strength of effects in published studies are sought.
Effect size index for epidemiological studies
e8854-11
Epidemiology Biostatistics and Public Health - 2013, Volume 10, Number 4
Biostatistics
Acknowledgments and grant information: the research leading to these results has received funding from the European Community’s Seventh Framework Programme FP7/2007-2013 - Environment (including Climate Change) FP7-ENV-2008-1 - under grant agreement number 226534-ArcRisk.
appendix a In this appendix we describe how to calculate the standardised regression coefficient effect size β and its standard error SE(β) in different research approaches of the original studies. 1. If β value, the standardized regression coefficient, is reported from the estimated linear regression model, it is used as the effect size. Standard error is obtained from model output (if reported), from reported confidence interval, or from test statistic to test the hypotheses: β = 0.
response Y and exposure X. We obtained the effect size statistic β by applying the same formula as in previous item 3 when b was the adjusted regression coefficient [16]. 5. In some articles mean values of the response variable are compared between low and high exposure groups. We can first calculate the (Cohen’s or Hedges) mean difference effect size statistic
where y1 is the mean response value in the low exposure group, y2 is the mean response value in the high exposure group and SD(within) is the within-groups standard deviation, pooled across groups [4, 17]. Then we can convert from mean difference (d) to correlation coefficient r using the formula
2. If in an unadjusted analysis, Pearson or Spearman correlation coefficient r is reported, β equals to r and where a is a correction factor for cases n1 ≠n2, [4, 17]. 3. If a study reports the results of a simple linear regression Y = a + b X, β value can be obtained by applying formula
where SD(Y) is the standard deviation of response variable in the study and SD(X) is the standard deviation of exposure measure used in the study [51, 52]. The standard error for beta is obtained as follows:
4. Several articles have estimated multivariable linear regression model to report the adjusted regression coefficient b between e8854-12
[17]. If n1 ≠n2 then a = 4 [17, 53]. standard error for r is given by
The
where SE(d) is the standard error of mean difference d. 6. In some articles the authors have used analysis of variance to compare the mean response values between more than two groups with different ordered exposure levels. We applied the linear trend test (by performing linear regression analysis with the group means as dependent variable and contrast as explanatory variable)[54]. We obtained the β with SE(β) as follows:
Effect size index for epidemiological studies
Epidemiology Biostatistics and Public Health - 2013, Volume 10, Number 4
Biostatistics
SD(between) is the between groups mean sum of squares (standard deviation) and n=total number of subjects [55].
where SD(contrast) is the SD for explanatory contrast values and SD(X) is standard deviation of the exposure variable X and b is the effect size for trend.
2. If minimum and maximum (or lower and upper quartile) value of response variable was given, we estimated SD by applying formulas
appendix b We have used the following procedures: 1. If SD of response variable was given in k different sub-groups, SD was obtained using formula
where SD(pooled) is the within-groups standard deviation pooled across groups,
[56, 57] 3. If standard error of response Y or confidence interval for mean value of response Y were reported, we obtained SD(Y) by applying the formulas
If SE(Y) was not given, we obtained it from the confidence interval.
References [1] Cooper H, Hedges LV. Research synthesis as a scientific enterprise. In: Cooper H, Hedges LV, editors. The handbook of research synthesis. New York: Russell Sage Foundation; 1994: 3-14 [2] Chene G, Thompson SG. Methods for summarizing the risk associations of quantitative variables in epidemiologic studies in a consistent form. Am J Epidemiol 1996; 144(6): 610-21 [3] Nieminen P, Carpenter J, Rucker G, Schumacher M. The relationship between quality of research and citation frequency. BMC Med Res Methodol 2006; 6: 42 [4] Lipsey MW, Wilson DB. Practical meta-analysis. London: SAGE Publications, 2001 [5] Karmaus W, Zhu X. Maternal concentration of polychlorinated biphenyls and dichlorodiphenyl dichlorethylene and birth weight in Michigan fish eaters: a cohort study. Environ Health 2004; 3(1): 1 [6] Baibergenova A, Kudyakov R, Zdeb M, Carpenter DO. Low birth weight and residential proximity to PCB-contaminated waste sites. Environ Health Perspect 2003; 111(10): 1352-7 [7] Maiorana A, Del BC, Cianfarani S. Adipose Tissue:
[8]
[9]
[10]
[11]
[12]
[13]
A Metabolic Regulator. Potential Implications for the Metabolic Outcome of Subjects Born Small for Gestational Age (SGA). Rev Diabet Stud 2007; 4(3): 134-46 Miles HL, Hofman PL, Cutfield WS. Fetal origins of adult disease: a paediatric perspective. Rev Endocr Metab Disord 2005; 6(4): 261-8 Murphy VE, Smith R, Giles WB, Clifton VL. Endocrine regulation of human fetal growth: the role of the mother, placenta, and fetus. Endocr Rev 2006; 27(2): 141-69 Muthayya S. Maternal nutrition & low birth weight - what is really important? Indian J Med Res 2009; 130(5): 600-8 Longnecker MP, Klebanoff MA, Brock JW, Guo X. Maternal levels of polychlorinated biphenyls in relation to preterm and small-for-gestational-age birth. Epidemiology 2005; 16(5): 641-7 Murphy LE, Gollenberg AL, Buck Louis GM, et al. Maternal serum preconception polychlorinated biphenyl concentrations and infant birth weight. Environ Health Perspect 2010; 118(2): 297-302 Sagiv SK, Tolbert PE, Altshul LM, Korrick SA.
Effect size index for epidemiological studies
e8854-13
Epidemiology Biostatistics and Public Health - 2013, Volume 10, Number 4
Biostatistics
Organochlorine exposures during pregnancy and infant size at birth. Epidemiology 2007; 18(1): 120-9 [14] El Majidi N, Bouchard M, Gosselin NH, Carrier G. Relationship between prenatal exposure to polychlorinated biphenyls and birth weight: a systematic analysis of published epidemiological studies through a standardization of biomonitoring data. Regul Toxicol Pharmacol 2012; 64(1): 161-76 [15] Govarts E, Nieuwenhuijsen M, Schoeters G, et al. Birth Weight and Prenatal Exposure to Polychlorinated Biphenyls (PCBs) and Dichlorodiphenyldichloroethylene (DDE): A Metaanalysis within 12 European Birth Cohorts. Environ Health Perspect 2012; 120(2): 162-70 [16] Vittinghoff E, Glidden DV, Shiboski SC, McCulloch CE. Regression methods in biostatistics: linear, logistic, survival and repeated measures models. Springer, 2005 [17] Borenstein M, Hedges LV, Higgins JPT, Rothstein HR. Introduction to Meta-Analysis. Chichester: Wiley, 2009 [18] Shadish WR, Haddock CK. Combining estimates of effect size. In: Cooper H, Hedges LV, editors. Handbook of research synthesis. New York: Russell Sage Foundation; 1994: 261-81 [19] Royston P, Altman DG, Sauerbrei W. Dichotomizing continuous predictors in multiple regression: a bad idea. Stat Med 2006; 25(1): 127-41 [20] Sauerbrei W, Royston P, Binder H. Selection of important variables and determination of functional form for continuous predictors in multivariable model building. Stat Med 2007; 26(30): 5512-28 [21] Becker BJ. Combining significance levels. In: Cooper H, Hedges LV, editors. The handbook of research synthesis. New York: Russell Sage Foundation; 1994: 215-30 [22] Nieminen P, Miettunen J, Koponen H, Isohanni M. Statistical methodologies in psychopharmacology: a review. Hum Psychopharmacol Clin Exp 2006; 21(3): 195-203 [23] Becker BJ, Wu M-J. The synthesis of regression slopes in meta-analysis. Statistical Science 2007; 22(3): 414-29 [24] Tajimi M, Uehara R, Watanabe M, et al. Relationship of PCDD/F and Co-PCB concentrations in breast milk with infant birthweights in Tokyo, Japan. Chemosphere 2005; 61(3): 383-8 [25] Schisterman EF, Cole SR, Platt RW. Overadjustment bias and unnecessary adjustment in epidemiologic studies. Epidemiology 2009; 20(4): 488-95 [26] Horton NJ, Switzer SS. Statistical methods in the journal. N Engl J Med 2005; 353(18): 1977-9 [27] Altman DG. Statistical reviewing for medical journals. Stat Med 1998; 17(23): 2661-74 [28] Bergonzi R, De PG, Specchia C, et al. Persistent organochlorine compounds in fetal and maternal
e8854-14
[29]
[30]
[32] [33]
[34]
[35]
[36]
[37]
[38]
[39]
[40]
[41]
tissues: evaluation of their potential influence on several indicators of fetal growth and health. Sci Total Environ 2011; 409(15): 2888-93 Wolff MS, Engel S, Berkowitz G, et al. Prenatal pesticide and PCB exposures and birth outcomes. Pediatr Res 2007; 61(2): 243-50 von Elm E, Altman DG, Egger M, et al. The Strengthening the Reporting of Observational Studies in Epidemiology (STROBE) statement: guidelines for reporting observational studies. J Clin Epidemiol 2008; 61(4): 344-9 [31] Blair A, Burg J, Foran J, et al. Guidelines for application of meta-analysis in environmental epidemiology. ISLI Risk Science Institute. Regul Toxicol Pharmacol 1995; 22(2): 189-97 Lang T, Secic M. How to report statistics in medicine. Philadelphia: American College of Physicians, 1997 Royston P, Sauerbrei W. Multivariable modelbuilding: A Pragmatic Approach to Regression Anaylsis based on Fractional Polynomials for Modelling Continuous Variables. Chichester: John Wiley & Sons, 2008 Brucker-Davis F, Wagner-Mahler K, Bornebusch L, et al. Exposure to selected endocrine disruptors and neonatal outcome of 86 healthy boys from Nice area (France). Chemosphere 2010; 81(2): 169-76 Chao HR, Wang SL, Lin LY, et al. Polychlorinated biphenyls in taiwanese primipara human milk and associated factors. Bull Environ Contam Toxicol 2003; 70(6): 1097-103 Fein GG, Jacobson JL, Jacobson SW, et al. Prenatal exposure to polychlorinated biphenyls: effects on birth size and gestational age. J Pediatr 1984; 105(2): 315-20 Givens ML, Small CM, Terrell ML, et al. Maternal exposure to polybrominated and polychlorinated biphenyls: infant birth weight and gestational age. Chemosphere 2007; 69(8): 1295-304 Gladen BC, Shkiryak-Nyzhnyk ZA, et al. Persistent organochlorine compounds and birth weight. Ann Epidemiol 2003; 13(3): 151-7 Grandjean P, Bjerve KS, Weihe P, Steuerwald U. Birthweight in a fishing community: significance of essential fatty acids and marine food contaminants. Int J Epidemiol 2001; 30(6): 1272-8 Halldorsson TI, Thorsdottir I, Meltzer HM, et al. Linking exposure to polychlorinated biphenyls with fatty fish consumption and reduced fetal growth among Danish pregnant women: a cause for concern? Am J Epidemiol 2008; 168(8): 958-65 Hertz-Picciotto I, Charles MJ, James RA, et al. In utero polychlorinated biphenyl exposures in relation to fetal and early childhood growth. Epidemiology 2005; 16(5): 648-56
Effect size index for epidemiological studies
Epidemiology Biostatistics and Public Health - 2013, Volume 10, Number 4
Biostatistics
[42] Jackson LW, Lynch CD, Kostyniak PJ, et al. Prenatal and postnatal exposure to polychlorinated biphenyls and child size at 24 months of age. Reprod Toxicol 2010; 29(1): 25-31 [43] Konishi K, Sasaki S, Kato S, et al. Prenatal exposure to PCDDs/PCDFs and dioxin-like PCBs in relation to birth weight. Environ Res 2009; 109(7): 906-13 [44] Lucas M, Dewailly E, Muckle G, et al. Gestational age and birth weight in relation to n-3 fatty acids among Inuit (Canada). Lipids 2004; 39(7): 617-26 [45] Patandin S, Koopman-Esseboom C, de Ridder MA, et al. Effects of environmental exposure to polychlorinated biphenyls and dioxins on birth size and growth in Dutch children. Pediatr Res 1998; 44(4): 538-45 [46] Ribas-Fito N, Sala M, Cardo E, et al. Association of hexachlorobenzene and other organochlorine compounds with anthropometric measures at birth. Pediatr Res 2002; 52(2): 163-7 [47] Sonneborn D, Park HY, Petrik J, et al. Prenatal polychlorinated biphenyl exposures in eastern Slovakia modify effects of social factors on birthweight. Paediatr Perinat Epidemiol 2008; 22(3): 202-13 [48] Tan J, Loganath A, Chong YS, Obbard JP. Exposure to persistent organic pollutants in utero and related maternal characteristics on birth outcomes: a multivariate data analysis approach. Chemosphere 2009; 74(3): 428-33 [49] Vartiainen T, Jaakkola JJ, Saarikoski S, Tuomisto J.
[50]
[51]
[52] [53]
[54] [55]
[56]
[57]
Birth weight and sex of children and the correlation to the body burden of PCDDs/PCDFs and PCBs of the mother. Environ Health Perspect 1998; 106(2): 61-6 Weisskopf MG, Anderson HA, Hanrahan LP, et al. Maternal exposure to Great Lakes sport-caught fish and dichlorodiphenyl dichloroethylene, but not polychlorinated biphenyls, is associated with reduced birth weight. Environ Res 2005; 97(2): 149-62 DeCoster J. Meta-analysis notes. Statistical notes 2009. Available from: http://www.stat-help.com/notes.html [Accessed May 7, 2012] Draper NR, Smith H. Applied regression analysis. Third edition . New York: John Wiley & Sons, 1998 Rosenthal R. Parametric measures of effect size. In: Cooper H, Hedges LV, editors. The handbook of research synthesis. New York: Russell Sage Foundation; 1994 Altman DG. Practical statistics for medical research. London: Chapman and Hall, 1991 Armitage P, Berry G, Matthews JNS. Statistical methods in medical research. Fourth edition. Oxford: Blackwell Science, 2002 Higgins JPT, Green S. Cochrane handbook for systematic reviews of interventions. Chichester: Wiley-Blackwell, 2009 Hozo SP, Djulbegovic B, Hozo I. Estimating the mean and variance from the median, range, and the size of a sample. BMC Med Res Methodol 2005; 5: 13
Effect size index for epidemiological studies
e8854-15