lion lines of C code, and is run on the commercial VxWorks real-time operating system (RTOS). As stated earlier, the complete data- and control-flow, to-.
Starting Conditions for Post-Mortem Debugging using Deterministic Replay of Real-Time Systems Joel Huselius, Daniel Sundmark and Henrik Thane M¨alardalen Real-Time Research Centre Department of Computer Science and Engineering M¨alardalen University, V¨aster˚as, Sweden {joel.huselius, daniel.sundmark, henrik.thane}@mdh.se
Abstract Repeatable executions are required in order to successfully debug a computer system. However, for real-time systems, interactions with the environment and race conditions in the execution of multitasking real-time systems software make reproducible behavior difficult to achieve. Earlier work on debugging of real-time software has established the use of a deterministic replay, a record/replay solution, as a viable approach to reproduce executions. When combining the deterministic replay approach with infinite loop recorders (similar to black-box recorders in airplanes) for post-mortem debugging, it is essential that the recordings are sufficiently long and detailed in order to be able to re-execute the system. Basic problems however, are how to find a well-defined starting point within the recording, and how to find a reachable state in the rebooted/restarted system to match that instance? Previous work has not presented solutions to these fundamental problems, in this paper we do. We also present some implementation details from an industrial case study.
1. Introduction Traditionally, debugging is performed by means of cyclic debugging [4]. After that a system has failed during test or operation, repeated re-executions of the system together with diagnostics is used to track down the suspected perpetrator, the bug. Typically the diagnostic process is simplified by basic mechanisms in the debugging environment, e.g. interactive breakpoints, tracing, etc. Cyclic debugging of multi-tasking real-time software is distinguished from cyclic debugging of single tasking non-real time software by the need to account for race conditions and potential nondeterministic re-executions, as well as non-deterministic inputs [14]. Earlier work on debugging of real-time soft-
ware has established the use of deterministic replay, a record/replay solution, as a viable solution to create repeatable executions [1, 6, 13, 17, 15, 19]. When combining the deterministic replay approach with infinite loop recorders (analogous to black-box recorders in airplanes) for postmortem debugging of embedded systems, it is essential that the recordings are sufficiently long and detailed in order to be able to re-execute the system. However, while saving sufficient amounts of information, the limited amount of resources (temporally and spatially) available must still be respected. Fundamental problems to solve are: • how to find a well defined starting point in the recording that matches the state of the restarted real-time system, and • how to find/change the startup state of the system to match one instance within the recording? In this paper we explain, and present solutions to the two problems described above, which in previous related works have not been addressed. We will also present details from a recent case-study performed on an industrial robot system that is using the VxWorks operating system. The case-study was a feasibility test of the monitoring/replay methodology in general, and our method in particular. The remainder of this paper is organized as follows: Section 2 present some background to the area, after which Section 3 describe the problems directed in this paper. In Section 4, we present our proposed solution to these problems. In Section 5, we describe an implementation of the proposed method that was a part of a recent case-study. Section 6 provides a short survey of related work. The paper is concluded in Section 7, where we also provide some discussions on future work.
2. Background The general idea behind incremental deterministic replay is to record (to monitor and log) sufficient information about a reference execution, typically one that ended in a failure, of the non-deterministic system to facilitate replay. Replay can be described as the production of a facsimile of the reference execution based on that recording. While cyclically replaying that replay execution of the system it is possible to cyclically debug the system. The level of detail and length of the recording defines the accuracy of the replayed (facsimile-) execution relative to the reference execution. Which level of accuracy required is in turn dictated by the fault hypothesis, i.e. what type of bugs do we assume may exist, and the infrastructure, i.e. what type of bugs are possible [14]. The more intricate bugs we assume can exist in the system, the more information we need to record. By using our method of recording and deterministically replaying executions, we extend the sequential failure fault hypothesis to also include ordering-, synchronization and timing failures [14]. Recordings are facilitated by inserting probes into the system. These probes will produce auxiliary outputs, buffered into logs during the reference execution. Probes can be implemented in hardware, software, or be a hybrid of those two. The difference between the approaches is essentially defined by the amount of perturbation introduced, i.e. clock cycles consumed or amount of memory used. If probes are added, removed, or altered over time, so that the level of perturbation varies, the system will suffer a probe effect [3], which may change the behavior of the system and prove counterproductive (as it will invalidate previous verification efforts). Thus, probes that incur significant perturbation should be left permanently even after deployment [18]. For more elaborate discussions on this see [4, 14]. The fact that the overhead incurred by the probes should be accounted for in the schedulability analysis also suggests that the overhead should be deterministic and limited. A recording consists of two parts [10]: • The data-flow describes variations in local and global variables, as well as inputs or output used by the task set, while • The control-flow describes alterations in the execution, e.g., scheduled preemptions, blocking system calls, or interrupts. Together with the system source code, this information defines the execution of the system. For post-mortem debugging of embedded systems, the information held by the recordings is essential for a successfully produced replay execution. As these systems have long up-times, if this information was to cover the entire ex-
ecution it would consume large quantities of memory. However, a trait of these systems is that the amount of resources (temporally and spatially) available is limited. In order to minimize the amount of memory needed for a recording that captures a reference execution it is possible to apply infinite loop recorders to a system based on finite length cyclic arrays. The problem to solve, however, is how to start the system and make it behave like during the reference execution? This problem can also be described by the two questions formulated in Section 1. Previous related work has not provided us answers to this.
3. Starting points for replay executions To deterministically set up the production of a facsimile - to setup a deterministic replay of a recorded reference execution - we need to do two things: • First, correlate the recordings and identify potential starting points for each task. A starting point consists of a control-flow event and a corresponding and sufficient beginning condition (state, message-body, etc) in the data-flow recording. (The data-flow entry is named saturated point, as it describes a sufficient data-state of the individual task.) • Second, it is necessary to re-execute the restarted/rebooted target system to a point in the program, typically a potentially blocking system call that matches a saturated point in the recording. From this point onwards, the target system can subsequently be deterministically re-executed by a replay-mechanism until the end of the recording.
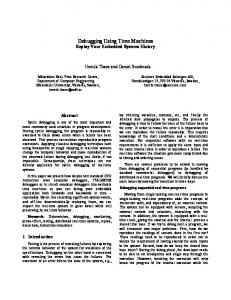
3.1. Finding starting points in the recording To define a starting point for a replay execution it is required that we have a sufficient set of accurate information for replay of the reference execution at the time of that starting point. That is, the recording at that instant must have captured the sufficient conditions for a specific task instance, such that from that instant it is possible, with the remaining information in the recording, to re-execute the system to the end of the recording (e.g. the failure); switching tasks in and out, substituting the contents of state variables, messages, and peripheral inputs with the recorded values. Starting points are defined by the cut set of the data-flow and the control-flow. Thus, there must, for any valid starting point in the control-flow recording, exist a corresponding beginning condition (state, message, etc) in the data-flow recording. Figure 1 illustrates this cut set. As the size of the data that describe the full context of any given task is usually substantial, it is not feasible to allow the replay execution to start at an arbitrary point in the
Ref erence Execution Ref erence Execution :
aq a a
Log Contents :
a
qa a q a
a
-
qa a q a
a
-
a a
-
F easible Replay Executions :
a a qa a
aq
1
6
2
ts
t1
t2
t1
t2
Replay Execution 1
6
2 −Logging control-f low. −Logging data-f low, external input. −Logging data-f low, state variables.
Figure 1. Replay Execution based on Log from a Reference Execution.
reference execution (e.g. at preemptions or interrupt hits) since this would entail saving the entire task context. We select a set of points from which the start of replay can begin: viable starting points are task activation (first time) and blocking system calls. This does not mean that we cannot reproduce preemptions or interrupts, only that we cannot start at such events.
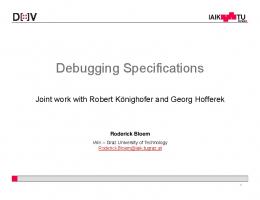
3.2. Finding starting points for the replay execution Using some debugging infrastructure, e.g., an ordinary interactive debugger or a breakpoint interface in the realtime operating system, breakpoints should initially be set for all potential starting points: typically all blocking system calls and task entries in the restarted/rebooted target system. This is usually sufficient since preemptions or interrupt hit points are not valid starting points. Each task in the target system is started with the same parameters as during the reference execution. When, eventually, a task makes a system call, it will hit a breakpoint. As the execution of the task is halted, all entries in the recording with that system call reference and task identity can be used as starting points for a replay. Thus, if at least one saturated starting point that matches the system call is found in the recording, the beginning conditions (e.g., message contents, variable contents, etc.) is substituted with the recorded values. When a starting point has been reached for every task (or desired sub set) in the recording, we can start replaying the system. Note that, as we can see in Figure 2, the replay may begin at different times for different tasks. Replay of task 1 is initiated at time t1 , while replay of task 2 is not initiated until t2 > t1 . In the span between t1 and t2 , task 1 may complete a number of iterations. This implies that a replayed task, which requires input from another task in the set of replayed tasks, may be forced to rely on the contents of the accumulated log for the required input.
ts
Figure 2. Execution-Traces for Reference and Replay Executions.
3.3. Replay When the initialization is ready, the replay will step forward as the time index is incremented at each control-flow event that is successfully matched. In addition, if a subsequent preemption or interrupt event for the current task is found in the control-flow, its corresponding conditional breakpoint is set, making it possible to replay this event as that breakpoint is hit. Once breakpoints representing such asynchronous events as preemptions and interrupts are hit and successfully matched, they can be removed in order to enhance the performance of the replay session. Since we have eliminated the dependency of the external process in real-time and replaced the temporal and functional context of the application with the recorded data- and control-flow timelines, we can replay the system history repeatedly.
4. Starting point prerequisites In this section, we define what constitutes a starting point for a deterministic replay execution in a real-time system.
4.1. Definitions and assumptions We differ between a global and a local starting point. A local starting point is a starting point for a specific task, a global starting point is a set of local starting points which can be used as starting point for the set of tasks that are to be replayed. We define system call references to be calls to the same system call from the same program counter (PC) value, and system call instances to be incarnations of calls to the same system call but possibly from different references. The set of all system calls is labeled C. For local starting points, we assume that: We are able to incorporate probes into the operating system. Some of the probes must be simple kernel probes [14], i.e. integrated into the operating system. These receive some parameters from the operating system, and their execution protected from interrupts.
System call references are monitored. The set of all monitored instances of any system call in C is labeled E. A call by a task from program counter value pc, to a system call c ∈ C is denoted en ∈ E, where n is a unique and temporally ordered identifier for elements in E. Together with the entry, it is possible to store also a data-segment which is a subset of the tasks data-flow. Interrupts, exceptions, and preemptions are monitored. The set of all monitored interrupts, exceptions, and preemptions is labeled I. The union F = E ∪ I is the set of control-flow events. A subset of the events in E are of a set E s that can be used as local starting points, the entry points of these system calls are labeled potential local starting points, the set of which is denoted C s ⊆ C. Simultaneously with the monitoring of potential starting points, the full data-flow is also monitored (e.g. state variables). Thus, a monitored event e ∈ E is a 5-tuple e = hn, c, i, pc, di, where i denotes the task which was executing when the monitoring was performed. The size of the set F is assumed to be large, some of the entries are later evicted from memory as the space available to store them in is relatively small. This eviction is performed by an eviction scheduler [5]. At the end of the monitoring session, Flog ⊆ F denotes the set of entries that still remain in memory - which are still in the log. s A subset Flog of the events at potential local starting points is the set of local starting points. A local starting point is an event which is in E s and which is still in the log.
A started task will always reach a potential local starting point without help from the replay engine or other external process outside the system. The phase of initialization is deterministic for all tasks. When a system is restarted, there is a phase of initialization before the system reaches its first potential local starting point. That phase is deterministic. We define a global starting point as a set of local starting points S where it is true that: There is one and only one local starting point for each task per global starting point S. If there is more then one feasible local starting point, one is chosen. The replay is not dependent on any irreproducible communication. Given an instance of a communication between two tasks, where the event en represents the act of transmitting a message and em the act of receiving the same. If the global starting point for the receiving task is prior to em , it is either true that the global starting point for the sending task is prior to en , or that one of the two events are still represented by entries in the log.
4.2. Finding starting points Using an ordinary interactive debugger, we initially place breakpoints at all potential starting points. Each task to be replayed is started with the same parameters as during the reference execution. As a task calls a system call, such that that system call is a potential starting point, it will hit its first breakpoint. As the execution of the task is halted, all entries in Flog with that system call reference and task identity can be used as starting points for a replay. Thus, if at least one such entry is found in Flog , the data-state d of the task is substituted for the data-state from one such entry, after which it is considered that the data-state of the task and the corresponding data-state of its predecessor from the reference execution are indistinguishable. When a local starting point has been reached for every task in the entire set of tasks to be replayed, the global starting point S has been established. Other schemes for replay have allowed such intermediate messages to be partially supplied by the replayed instance of the producing task [8, 20] by using adaptive logging. However, as previously published solutions make on-line decisions about whether to log or not to log a monitored event originating from high-perturbing software probes, there is an increase of the jitter in the system. Jitter will reduce the testability of the system [16], wherefore gains in time overhead for the logging-procedure must be balanced with respect to this. It would however be possible to make certain gains with regard to memory resources required, without compromising the testability, but that would require eviction strategies such as that presented in [5].
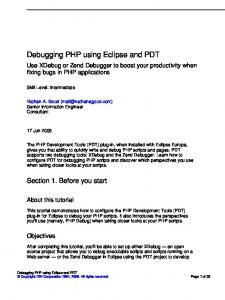
4.3. Multiple consecutive starting points Above, we posted the assumptions that a started task will always reach a potential starting point and that the phase of initialization will always be deterministic. If we assume that tasks are constructed as control-loops; a setup sequence is followed by an infinite loop. This, together with a wish to always be able to replay a reference execution, leads to the requirement that the first feasible starting point must lie at the first instruction of the infinite loop. In addition, the setup sequence cannot be non-deterministic, wherefore it cannot operate on any semaphores or similar. These are clearly unfortunate limitations. If we wish to have other task-constructs, such as the one in Figure 3, we must take additional steps to ensure the presence of local starting points in the log. This can be performed by ensuring that a subset of the collected pool of recordings is conserved in the recordings from the reference execution: If at least one entry of every feasible local starting point that is encountered during the reference execution is kept in the log, together with sufficient information to al-
low a replay to the next consecutive feasible starting point in the execution, we can allow more complex task-constructs. Figure 3 shows a setup where both the states S1 and S2 can be used as local starting points. However, a recording that has spent too many iterations in S2 may no longer have entries from S1 in the log. Wherefore a starting point cannot be found. Thus, we must separate the logs that store entries from the two events. A simple approach could be to have separate circular queues for the two. This will ensure that entries that describe the transition from S1 to S2 are always accessible if they occurred during the reference execution. Thus, entries from S2 can always be replayed if they occurred during the reference execution.
? m - S1 � � �
- S2 m � �
Figure 3. A task with a modechange. Previously proposed schemes for logging data, have either been centralized circular queues [11], which is a FIFOqueue, or have such characteristics that they compromise testability (see Section 4.2 on adaptive logging). Hence, such methods cannot be efficiently used in this context.
4.4. Replay When the global starting point S has been established, conditional breakpoints are set at all unique program counter values where events occurred such that they are in I, and also still in Flog . These breakpoints represents events that should be replayed, but have such properties that the address at which they occur is not deterministic. Breakpoints are also set at the entry points of all system calls which are not potential starting points. Previously positioned breakpoints at the entry points of all potential starting points remain in place. Thereafter, the replay can be commenced. The replay uses the positioned breakpoints to control the preemption order implied by the entries in the accumulated log. Tasks at breakpoints are released in the pattern dictated by the control-flow. As system calls are encountered, for which there is a valid entry in the data-flow, that data is injected into the task at the correct points with respect to the control-flow.
As feasible starting points (which are references to potentially blocking system calls) are encountered, we can choose to start from another instance of that system call reference. This can be describes as jumping forwards or backwards in time.
5. Implementation An implementation of this method was part of an industrial case study [12, 17], which aimed to achieve deterministic replay for post-mortem debugging of an industrial robot control system. The developer of the investigated system is among the largest industrial robot manufacturers in the world, ABB Robotics. Their system consists of several computing control systems, signal processing systems and I/O units. We applied our methods to a part of the system that consists of a plentitude of tasks, approximately 2.5 million lines of C code, and is run on the commercial VxWorks real-time operating system (RTOS). As stated earlier, the complete data- and control-flow, together with the application code defines an unique execution of the application. In our implementation, control-flow and data-flow are monitored separately by the use of software probes inserted in the application code and in the kernel. Although more elaborate schemes have been proposed [5], we use basic cyclic buffers for system control-flow and data-flow logging.
5.1. Data-flow recording The data-flow probes are made up of simple monitoring functions, called within the code of each task. During the reference execution, when called, these probes store the values of selected static variables, messages received, or external sensors read. During the replay execution, however, this operation is reversed, such that the information is read from the data-flow log rather than being stored onto it. As the replay execution is also executing the deterministic phase of initialization, we do not have to record the state of variables that are part of the parameterization. The selection of which data to store/retrieve at each data-flow probing is managed by the use of data filters, defined by the developer.
5.2. Control-flow recording As for the control-flow probes, these are less applicationspecific but much more kernel-bound. Since VxWorks does not ship with complete source-code (yet), we have made use of the kernel hooks included in the RTOS. Using these, code can be inserted for execution in task switches, interrupts, and other kernel events. These hook probes, combined with a set of system call wrappers, allow us to instrument all task
switches in the sense of determining their cause, internal ordering and location of the occurrence.
5.3. Correlating data- and control-flow To be able to perform a replay of the reference execution, the data-flow and the control-flow logs need to be corres lated. For example, a local starting point es ∈ Flog is made up of a log point where the control-flow and data-flow entries for that task coincide. TaskA() { int gvar = 0; while(FOREVER) { msgQReceive(msgQId, &msg, maxNBytes, timeout1); probe(MSG_PROBE); . subr(gvar); gvar++; . semTake(sem, timeout2); . . } } Figure 4. Probed Code Example. Consider, for instance, the example code in Figure 4. The potentially blocking system call msgQReceive is followed by a software probe, storing (or retrieving) the contents of the received message. In addition, the value of the global variable gvar should be stored due to the fact that it helps define the state of the task in each iteration of the loop. If the global variable is not stored, the replay execution will always start with a gvar-value of zero, corrupting the correlation between data- and control-flow of the reference execution facsimile. In the case of an empty message queue, the task will make a transition to a waiting state and thus cause a task switch, which will be logged as an entry in the control-flow log. When a message arrives to the queue, the task will be awakened and the software probe will execute, storing the received message in the data-flow log. This is an example of a situation where control- and data-flow log entries coincide, producing a potential local starting point for this task. On the other hand, look at the next potentially blocking system call, semTake. When executed, if the semaphore is taken, this call will cause a running- to waiting- state transi-
tion for this task as well. This transition will be stored in the control-flow log and will be essential for the deterministic reproduction of the execution. However, since no data-flow is stored in conjunction with this, the task state cannot be restored during the replay execution at this location and the control-flow log entry is not part of the potential local starting point set, F s .
5.4. Starting the replay execution As stated earlier, the replay execution is initiated by breakpoints being set at all potential local starting points in the code of the system. In VxWorks, this is done by issuing breakpoint commands to the on-target debug task. Once these breakpoints are set, the system application can be started and executed up until all tasks have hit their first breakpoint. This will leave the entire application in a suspended state, from which we are able to chose, from local starting points in the log, which task to release for execution first. The chosen task is released and deterministically executed up until its next breakpointed location of task interleaving (blocking system call, preemption or interrupt) in the log. Reaching this location might call for enforcing of synchronization mechanisms, such as semaphores or message queues that did not block during the reference execution. At this point, a new selection is made, based on the log sequence, about which task to choose for execution.
5.5. Concerns about the reproduction of inter-task communication activities By viewing each task in the replay execution as an fairly autonomous and isolated entity, we ensure that the state consistency of the global starting point does not depend on any irreproducible communication. In our implementation, a message sent by a task A to a subsequent task B is logged using a data-flow probe in the execution of task B. Using this approach, tasks A and B operate in isolated environments during the replay execution and task B does not have to rely on the correct deliverance of messages from task A in order to be reproduced deterministically. However, monitoring all inter-task communication explicitly might be a time-consuming and expensive activity and a more thorough analysis of the system task execution behavior could let us identify periodic transactions of tasks, within which some messages can be assumed to be reproducible during replay [9]. We have chosen not to exploit this fact, which may allow a reduction in the overhead from the monitoring activities, as the jitter of current technologies [9] will compromise the testability of the system [16].
6. Related work With respect to related work in the field of replay debugging of concurrent programs and real-time systems most references are quite old. Recent advancement in the field has been meagre. On the special topic of finding starting points for replay of real-time systems, no comprehensive studies have been published hitherto. The only work known to have some similarities [8, 20] is limited to replay of message passing in concurrent software, and does not cover real-time issues like scheduled preemptions, access to critical sections, or interrupts. Also, the jitter of these solutions causes the testability to be compromised. On the general topic of deterministic replay previous work published has either been relying on special hardware [2, 19], or on special compilers generating dedicated instrumented code [2, 7]. This has limited the applicability of their solutions on standard hardware and standard real-time operating system software. Other approaches do not rely on special compilers or hardware but lack in the respect that they can only replay concurrent program execution events like rendezvous, but not real-time specific events like scheduled preemptions, asynchronous interrupts or mutual exclusion operations [1, 13, 20]. For a more elaborate discussion on related work see [4]. Earlier versions of our deterministic replay technique, which supported replay of interrupts, preemption of tasks and distributed transactions, have been presented previously [14, 15, 17]. However, none of those papers elaborated on how to identify starting points.
7. Conclusions In this paper, we presented a method for initiating a replay execution based on a previous reference execution. The replay execution can, deterministically, be cyclically repeated, it is possible to stop the execution by inserting breakpoints at arbitrary positions, and variables used can be inspected. It is therefore possible to use the replay execution when cyclically debugging non-deterministic real-time systems. Previous work with incremental- and deterministic- replay has not been concerned with the problem of initiating the replay execution; to our knowledge, the method presented here is the only known to this date.
7.1. Future work In Section 4.3, we described a simple solution to the problem of allowing replay of more complex task structures then simple control loops. In our future work, we will elaborate on this, and investigate solutions based on the logging structure that we presented in [5].
We will also direct the issue, described in Section 5.5, of re-executing rather then logging intermediate messages.
7.2. Acknowledgements The work presented in this paper was supported by the Swedish Foundation for Strategic Research (SSF) via the research programme SAVE, the Swedish Institute of Computer Science (SICS), and M¨alardalen University. We would like to thank Ingemar Reiyer and Roger Mellander at ABB Robotics for the opportunity to validate the method presented here.
References [1] J.-D. Choi, B. Alpern, T. Ngo, M. Sridharan, and J. Vlissides. A pertrubation-free replay platform for cross-optimized multithreaded applications. In In Proceedings of the 15th International Parallel and Distributed Processing Symposium. IEEE Computer Society, April 2001. [2] P. Dodd and C. Ravishankar. Monitoring and debugging distributed real-time programs. Software-Practice and Experience, 22(10):863 – 877, October 1992. [3] J. Gait. A probe effect in concurrent programs. SoftwarePractice and Experience, 16(3):225–233, March 1986. [4] J. Huselius. Debugging parallel systems: A state of the art report. Technical Report 63, M¨alardalen University, Department of Computer Science and Engineering, September 2002. [5] J. Huselius. Logging without compromising testability. Technical Report 87, M¨alardalen University, Department of Computer Science and Engineering, 2002. [6] T. LeBlanc and J. Mellor-Crummey. Debugging parallel programs with instant replay. Transactions on Computers, 36(4):471 – 482, April 1987. [7] J. Mellor-Crummey and T. LeBlanc. A software instruction counter. In Proceedings of the Third International Conference on Architectural Support for Programming Languages and Operating Systems, pages 78 – 86. ACM, April 1989. [8] R. Netzer and J. Xu. Adaptive message logging for incremental program replay. Parallel & Distributed Technology, 1(4):32–39, November 1993. [9] R. Netzer and Y. Xu. Replaying distributed programs without message logging. In the 6th International Symposium on High Performance Distributed Computing, pages 137–147, August 1997. [10] B. Plattner. Real-time execution monitoring. IEEE Transactions on Software Engineering, SE-10(6):756 – 764, November 1984. [11] D. Stewart and M. Gentleman. Non-stop monitoring and debugging on shared-memory multiprocessors. In Proceedings of the 2nd International Workshop on Software Engineering for Parallel and Distributed Systems, pages 263 – 269. IEEE Computer Society, May 1997. [12] D. Sundmark, H. Thane, J. Huselius, A. Pettersson, R. Mellander, I. Reiyer, and M. Kallvi. Replay debugging of complex real-time systems: Experiences from two industrial case studies. Technical Report 96, M¨alardalen University, Department of Computer Science and Engineering, April 2002.
[13] K.-C. Tai, R. Carver, and E. Obaid. Debugging concurrent ada programs by deterministic execution. IEEE Transactions on Software Engineering, 17(1):280 – 287, Januari 1991. [14] H. Thane. Monitoring, Testing and Debugging of Distributed Real-Time Systems. PhD thesis, Kungliga Tekniska H¨ogskolan, Sweden, May 2000. [15] H. Thane and H. Hansson. Using deterministic replay for debugging of distributed real-time systems. In Proceedings of the 12th EUROMICRO Conference on Real-Time Systems, pages 265 – 272. IEEE Computer Society, June 2000. [16] H. Thane and H. Hansson. Testing distributed real-time systems. Journal of Microprocessors and Microsystems, Elsevier, 24(9):463 – 478, February 2001. [17] H. Thane, D. Sundmark, J. Huselius, and A. Pettersson. Replay Debugging of Real-Time Systems using Time Machines. In 1st International Workshop on Parallel and Distributed Systems: Testing and Debugging, April 2003. [18] J. Tsai, Y. Bi, S. Yang, and R. Smith. Distributed Real-Time Systems: Monitoring Visualization and Debugging and Analysis, chapter 3.1, page 51. Wiley-Interscience, 1996. [19] J. Tsai, K.-Y. Fang, H.-Y. Chen, and Y.-D. Bi. A noninterference monitoring and replay mechanism for real-time software testing and debugging. IEEE Transactions on Software Engineering, 16(8):897 – 916, August 1990. [20] F. Zambonelli and R. Netzer. An efficient logging algorithm for incremental replay of message-passing applications. In Proceedings of the 13th International and 10th Symposium on Parallel and Distributed Processing, pages 392–398. IEEE, April 1999.