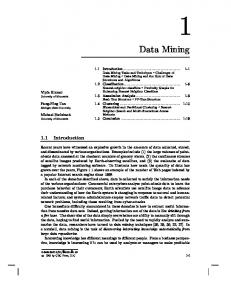
“[Data mining is] the process of discovering meaningful correlations, patterns, ...
Data mining often involves ... Programming experience in R, Matlab, C or Java.
Statistical Data Mining (ORIE 4740)
Spring 2013
“[Data mining is] the process of discovering meaningful correlations, patterns, and trends by sifting through large amounts of data…[it] employs pattern recognition technologies, as well as statistical and mathematical techniques” (The Gartner Group). Data mining often involves datasets with many records and many variables. Frequently little is known about the distribution of any particular variable, or about the relationships between variables. Desirable approaches have few assumptions or are robust to the violation of those assumptions. They also must be computationally tractable on large data sets. By the end of this course, you will be able to take a large commercial or governmental data set, decide on data mining techniques to answer your question of interest, apply those techniques, compare them, and draw conclusions. In order to cement your understanding you will implement some simple techniques, and modify implementations of some more complex techniques. Exams are Mon. 3/11 in class (prelim exam) and Fri. 5/17, 2-4:30 (final exam). Prerequisites - ORIE 2700 and 3500 (statistics and probability) or equivalent. Point and interval estimation, hypothesis testing, p-values. Simple linear regression. Marginal probability, joint probability, conditional probability, Bayes’ theorem (refs include Ross, 2006 and Freedman, Pisani, and Purves, 1998). - Math 2940 (linear algebra) or equivalent. - Programming experience in R, Matlab, C or Java. - Strongly recommended: Background in multiple linear regression and logistic regression First Steps (1) Visit the course website at http://blackboard.cornell.edu to access the course information. (2) Visit the ORIE intranet site to get a departmental account: http://intranet.orie.cornell.edu. (3) Register your iClicker at http://atcsupport.cit.cornell.edu/pollsrvc/. For general information see http://www.it.cornell.edu/services/polling/howto-students.cfm Instructors Prof. D. Woodard Office hours: Tu 3-4 & Thurs 11-12 or by appointment, in Rhodes 228. You can also ask me questions immediately after class. On Tues, Jan. 22 O.H.s are moved to 11-12. Email: Zach Rayfield, TA (wzr2; Wed Sections) Office hours: M 10-11 AM and 5-6 PM in Rhodes 290 Brad Westgate, TA (bsw62; Mon Sections) Office hours: M 11-12 AM and F 4-5 in Rhodes 294 Lectures / Labs Lectures are MWF 1:25-2:15; Mon./Fri. lectures are in Olin Hall 255 and Wed. lectures are in Rhodes 471. Print lecture notes off Blackboard and bring them to class. Labs are on Monday afternoon or Wed morning, in Rhodes 453. Lab participation is crucial to prepare you for the final project! Questions are best addressed during office hours and labs (instead of email), so make sure that several of the office hours are at times that work for you.
Homework There will be about 8 homework assignments. Homework is due at 12 noon on Tuesday a week after it is given out, and must be submitted to the course mailbox (2nd floor Rhodes, visit rm. 206 for directions), NOT by email, under door, etc.. You may discuss the content of the homework with other students in your 4740 class, but the final product must be your own. Your lowest 2 homework grades will be dropped; this accommodates sickness, family emergency, or religious holiday without a formal process. If you miss an assignment for these reasons then it must count as one of your dropped assignments. Software We will use the statistical software package R, latest version. This is on the Windows machines in the ORIE labs, and students can obtain a free copy for their personal Windows / Linux machine at http://www.r-project.org/ Good references for R and its sister language S-PLUS include: - “An Introduction to R”, found at http://www.r-project.org/ - “R Reference Card”, at http://cran.r-project.org/doc/contrib/Short-refcard.pdf - The “User’s Guide” or “Getting Started Guide” for S-PLUS - The book “Data Mining with R” Grading Grade allocation is: 10% homework, 34% final project and 54% exams, and 2% class participation (clicker participation & other). Responding to 80% of clicker questions in class gives 100% clicker grade. In case of a grading error you may resubmit the assignment (to your TA, with permission) or exam (to Prof., with permission) within one week of when it was returned to you, with a written explanation of the grading error. The entire assignment or exam is carefully regraded, so the final grade may be lower due to our finding additional mistakes. Exams There is one in-class preliminary exam (Mon. 3/11 in class) and a final exam in the final exam slot (Fri. 5/17, 2-4:30). There will also be a final project due the last week of classes. Request for special accommodation must be made at least 2 weeks prior to each exam. Final project In the final project, the techniques taught in the class are used to analyze a large business or engineering data set. Students work in teams of 2-3 students. Each team writes a project proposal (due 4/04), finds the necessary data, carries out the project, and writes a project report. The project report is due 5/02; a late project loses 10% credit per day. Textbooks Required: iClicker and Shmueli, Patel, & Bruce (2010). Data Mining for Business Intelligence: Concepts, Techniques, and Applications in Microsoft Office Excel with XLMiner. Second Ed., Wiley: NJ. One copy on reserve in Uris library. Data available at www.dataminingbook.com Hastie, Tibshirani, and Friedman (2009). The Elements of Statistical Learning: Data Mining, Inference, and Prediction. Second Ed., Springer: NY. Freely available at: http://www-stat.stanford.edu/~tibs/ElemStatLearn/ Academic integrity Violations of the Cornell’s Code of Academic Integrity are punished at minimum with failure of the course. There is a link to this code on the course Blackboard page.
Timeline (frequently check updated version on Blackboard) Week 1
Date Jan 21
Topic Classification: Heuristic approaches Case Study: Heart disease detection
2
Jan 28
Naïve Bayes Classifier Case Study: Olive oil quality control
3
Feb 4
Naïve Bayes & Graphical Models Case Study: Automobile accident severity
4
Feb 11
Regression Case: Credit risk
5
Feb 18
6
Feb 25
7
Mar 4
8
Mar 11
Regression Case: Estimating customer income Regression Case: Predicting donations Splines Logistic Regression Principal Components Analysis (PCA) Case: Cereal composition
9 10
Mar 18 Mar 25
11
Apr 1
12
Apr 8
13 14
Apr 15 Apr 22
15
Apr 29 May 17
Reading Chap. 1 & 2 in SPB. Sections 1.7-3.4 in “Introduction to R” SPB: pp. 50-58 and Chap. 8. “Intro to R”: Sec. 5.2, 5.7, 7.1, 9.2, 10.0, 10.1, 10.3. SPB: Chap 5 through p.102 (see lecture for a correction). Also Chap. 7. SPB: Chap 6 skip 6.4. HTF: 3.1-3.2.1 Skip: F-statistic, confidence set for beta vector
Lab/Homework Tutorial in Sec. 1.7-3.4 of Introduction to R.
Lab/HW 1: Heuristic classification
Lab/HW 2: Naïve Bayes classification
Lab/HW 3: Graphical models
Lab/HW 4: Regression
SPB: Chap 10
SPB: Chap 4 HTF: Sec. 14.5 through “handwritten digits” example
Spring Break! Enjoy… PCA Case: Orthopedic device sales Density estimation
HTF: Sec.6.6
Clustering Case: Public utilities
SPB: Chap 14 except 14.4.
Classification and Regression Trees (CART) Neural Networks
HTF: 9.2.1-9.2.2
Lab/HW 5: Regression Lab/HW 6: Regression/ splines No Lab / HW: Prelim Exam
Lab/HW 7: PCA
SPB: Chap. 11
No Lab/ HW: Project groups meet Project proposal due. Lab/HW 8: density estimation & clustering
Final Project Due Final Exam