ccv.wordpress.fos.auckland.ac.nz. 1See last ... Start at pixel p in B, consider its neighborhood defined by a square window ... Middle: Disparity map using a local matcher (block matching, as available ... 2 Aim at âCSG installationâ of cameras.
Corresponding Pixels
Visualization of Results
Matching Process
ADAS
Summary
Stereo Matching, Depth Maps, and an Application1 Lecture 10
See Chapter 8 in Reinhard Klette: Concise Computer Vision Springer-Verlag, London, 2014 ccv.wordpress.fos.auckland.ac.nz
1
See last slide for copyright information. 1 / 24
Corresponding Pixels
Visualization of Results
Matching Process
ADAS
Summary
Agenda
1
Corresponding Pixels
2
Visualization of Results
3
Matching Process
4
Advanced Driver Assistance Systems
5
Summary for Stereo Vision
2 / 24
Corresponding Pixels
Visualization of Results
Matching Process
ADAS
Summary
A Stereo Pair: Two Rectified Images
p
q
p
Start at p and search along the epipolar line for a corresponding q How to detect q? A correct q would be to the right of the shown q 3 / 24
Corresponding Pixels
Visualization of Results
Matching Process
ADAS
Summary
A Difficult Problem and Approximate Solutions
How to detect pairs of corresponding pixels in a stereo pair?
Stereo Matchers Hundreds of techniques have been proposed for detecting “similar” pixels, typically combined with assuming constraints (e.g. adjacent pixels should have about the same disparity) for supporting an optimisation strategy Two Examples of Stereo Matchers Semi-global matching (SGM) and its variant, iterative SGM (iSGM)
4 / 24
Corresponding Pixels
Visualization of Results
Matching Process
ADAS
Summary
Agenda
1
Corresponding Pixels
2
Visualization of Results
3
Matching Process
4
Advanced Driver Assistance Systems
5
Summary for Stereo Vision
5 / 24
Corresponding Pixels
Visualization of Results
Matching Process
ADAS
Summary
SGM Disparity Map for the Shown Stereo Pair
Color: Color-encoded disparity values at pixel locations Black: Pixel location without assigned disparity value 6 / 24
Corresponding Pixels
Visualization of Results
Matching Process
ADAS
Summary
Ground Truth for Synthetic Data Useful for evaluating the accuracy of a stereo matcher
Left: Original rendered image from Set 2 of EISATS Right: Disparity map, here illustrating ground truth (Note: Use of a different color key) 7 / 24
Corresponding Pixels
Visualization of Results
Matching Process
ADAS
Summary
iSGM Depth Map Each disparity defines (via triangulation) a depth or distance value
Left: One of the two input images Right: Depth map using the color key as shown on the right distances are in meters 8 / 24
Corresponding Pixels
Visualization of Results
Matching Process
ADAS
Summary
Agenda
1
Corresponding Pixels
2
Visualization of Results
3
Matching Process
4
Advanced Driver Assistance Systems
5
Summary for Stereo Vision
9 / 24
Corresponding Pixels
Visualization of Results
Matching Process
ADAS
Summary
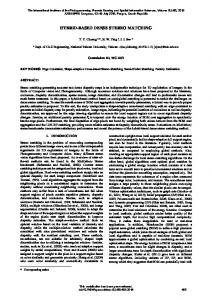
Generic Model for Matching
Given: Left image L and right image R One is the base image B, the other one the match image M Matching Task For (x, y , B(x, y )) search corresponding pixel (x + d, y , M(x + d, y )) Epipolar line identified by row y , and d is the disparity Two pixels are corresponding iff they are projections of the same point P = (X , Y , Z ) in the shown scene
10 / 24
Corresponding Pixels
Visualization of Results
Matching Process
ADAS
Summary
B = L and M = R B
M Wq
Wp p
Wp q
p
Basic Idea Start at pixel p in B, consider its neighborhood defined by a square window Compare with neighborhoods around pixels q on the epipolar line in M Search for best match of pixel neighborhoods 11 / 24
Corresponding Pixels
Visualization of Results
Matching Process
ADAS
Summary
Search Interval for B = L and M = R Initiate search by selecting p = (x, y ) in B Search interval: max{x − dmax , 1} ≤ x + d ≤ x for q = (x + d, y ) in M In other words: 0 ≤ −d ≤ min{dmax , x − 1} Example Start at p = (1, y ) in B Then we can only consider d = 0 (i.e. a point P “at infinity”) If no “reasonable” similarity of neighborhoods of p = (1, y ) in B and q = (1, y ) in M then do not assign disparity 0 to p
12 / 24
Corresponding Pixels
Visualization of Results
Matching Process
ADAS
Summary
If Also Considering Smoothness Cost ... Stereo matcher assigns disparity fp to pixel location p ∈ Ω Edata (p, fp ) = dissimilarity cost (error) between local neighbourhood around p in B and local neighbourhood around pixel in M defined by disparity fp Esmooth (fp , fq ) = dissimilarity cost (error) between disparity fq at an adjacent location q
disparity fp at p and
Goal for a stereo matcher: Minimise the total error X X Edata (p, fp ) + E (f ) = Esmooth (fp , fq ) p∈Ω
q∈A(p)
Stereo matchers solve this optimisation problem approximately 13 / 24
Corresponding Pixels
Visualization of Results
Matching Process
ADAS
Summary
Neighborhoods for Correspondence Search
Consider (2l + 1) × (2k + 1) windows Wpl,k (B) around reference point p in image B and Wql,k (M) around reference point q in image M Consider image row y (the current epipolar line) and compare values in those local neighborhoods of p and q
14 / 24
Corresponding Pixels
Visualization of Results
Matching Process
ADAS
Summary
Examples of Simple Data Cost Terms p = (x, y ) and q = (x + d, y ) SSD data cost measure ESSD (p, d) =
l k X X
[B(x + i, y + j) − M(x + d + i, y + j)]2
i=−l j=−k
SSD for sum of squared differences SAD for sum of absolute differences SAD data cost measure ESAD (p, d) =
l k X X
|B(x + i, y + j) − M(x + d + i, y + j)|
i=−l j=−k 15 / 24
Corresponding Pixels
Visualization of Results
Matching Process
ADAS
Summary
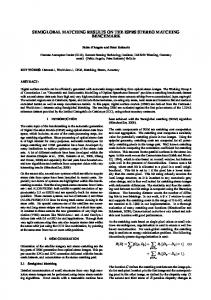
Varying Qualities of Stereo Matchers
16 / 24
Corresponding Pixels
Visualization of Results
Matching Process
ADAS
Summary
Caption to Figure on Page Before
Top: Input image of a stereo sequence recorded at Tamaki campus, The University of Auckland Middle: Disparity map using a local matcher (block matching, as available in OpenCV beginning of 2013 Bottom: Disparity map using iSGM as stereo matcher
17 / 24
Corresponding Pixels
Visualization of Results
Matching Process
ADAS
Summary
Agenda
1
Corresponding Pixels
2
Visualization of Results
3
Matching Process
4
Advanced Driver Assistance Systems
5
Summary for Stereo Vision
18 / 24
Corresponding Pixels
Visualization of Results
Matching Process
ADAS
Summary
Vision-Based Driver Assistance Cameras are used in road vehicles for lane detection, distance analysis, traffic sign recognition, and so forth Since 2013, stereo vision is also used in cars for supporting autonomous driving (at low speed) and other tasks; see websites, for example
ae-plus.com/technology/autoliv-develops-stereo-camera-system 19 / 24
Corresponding Pixels
Visualization of Results
Matching Process
ADAS
Summary
Comparative Evaluations of Stereo Matchers For examples of test data and performance of stereo matchers, see 1
KITTI: www.cvlibs.net/datasets/kitti/index.php
2
HCI: ci.iwr.uni-heidelberg.de/Static/challenge2012
3
EISATS: ccv.wordpress.fos.auckland.ac.nz/eisats
4
Middlebury Stereo Vision: vision.middlebury.edu/stereo/
It is also an important task to evaluate the provided test data (what kind of challenges are given by a set of data); the performance of stereo matchers depends on input data (lighting, complexity of scene, trajectories of moving objects, etc.) For a clip showing iSGM results on HCI test data, see www.mi.auckland.ac.nz/DATA/CCV/VideoStereoGrey 20 / 24
Corresponding Pixels
Visualization of Results
Matching Process
ADAS
Summary
Agenda
1
Corresponding Pixels
2
Visualization of Results
3
Matching Process
4
Advanced Driver Assistance Systems
5
Summary for Stereo Vision
21 / 24
Corresponding Pixels
Visualization of Results
Matching Process
ADAS
Summary
Steps Towards Stereo Vision
1
Choose 2 (or more) cameras appropriate for application
2
Aim at “CSG installation” of cameras
3
Calibrate cameras
4
Rectify recorded images using calibration results
5
Choose a stereo matcher for finding corresponding points
6
Possibly use B = L and M = R, followed by B = R and M = L
7
Evaluate calculated disparities (apply a confidence measure)
8
Calculate depth from disparities
9
Possibly approximate a surface model based on depth values
22 / 24
Corresponding Pixels
Visualization of Results
Matching Process
ADAS
Summary
Example: Stereo Vision for Generating 3D Roadside Views
Analyse ego-motion (of the ego-vehicle) and map calculated 3D points into one world coordinate system 23 / 24
Corresponding Pixels
Visualization of Results
Matching Process
ADAS
Summary
Copyright Information
This slide show was prepared by Reinhard Klette with kind permission from Springer Science+Business Media B.V. The slide show can be used freely for presentations. However, all the material is copyrighted. R. Klette. Concise Computer Vision. c
Springer-Verlag, London, 2014. In case of citation: just cite the book, that’s fine.
24 / 24