geotechnical structures that are in project. Examples of such ... context, and have proven successful in engineering mechanics, both in academia and more ...
Chapter 7
Stochastic finite element methods in geotechnical engineering Bruno Sudret and Marc Berveiller
7.1 Introduction Soil and rock masses naturally present heterogeneity at various scales of description. This heterogeneity may be of two kinds: • •
the soil properties can be considered piecewise homogeneous once regions (e.g. layers) have been identified; no specific regions can be identified, meaning that the spatial variability of the properties is smooth.
In both cases, the use of deterministic values for representing the soil characteristics is poor, since it ignores the natural randomness of the medium. Alternatively, this randomness may be modeled properly using probability theory. In the first of the two cases identified above, the material properties may be modeled in each region as random variables whose distribution (and possibly mutual correlation) have to be specified. In the second case, the introduction of random fields is necessary. Probabilistic soil modelling is a long-term story, see for example Vanmarcke (1977); DeGroot and Baecher (1993); Fenton (1999a,b); Rackwitz (2000); Popescu et al. (2005). Usually soil characteristics are investigated in order to feed models of geotechnical structures that are in project. Examples of such structures are dams, embankments, pile or raft foundations, tunnels, etc. The design then consists in choosing characterictics of the structure (dimensions, material properties) so that it fulfills some requirements (e.g. retain water, support a building, etc.) under a given set of environmental actions that we will call “loading.” The design is carried out practically by satisfying some design criteria which usually apply onto model response quantities (e.g. displacements, settlements, strains, stresses, etc.). The conservatism of the design according to codes of practise is ensured first by introducing safety coefficients, and second by using penalized values of the model parameters.
[17:46 1/2/2008 5108-Phoon-Ch07.tex]
Job No: 5108
PHOON: RB Design in Geo. Eng.
Page: 260
260–297
Stochastic finite element methods 261
In this approach, the natural spatial variability of the soil is completely hidden. From another point of view, when the uncertainties and variability of the soil properties have been identified, methods that allow propagation of these uncertainties throughout the model have to be used. Classically, the methods can be classified according to the type of information on the (random) response quantities they provide. •
•
•
The perturbation method allows computation of the mean value and variance of the mechanical response of the system (Baecher and Ingra, 1981; Phoon et al., 1990). This gives a feeling on the central part of the response probability density function (PDF). Structural reliability methods allow investigation of the tails of the response PDF by computing the probability of exceedance of a prescribed threshold (Ditlevsen and Madsen, 1996). Among these methods, FOSM (first-order second-moment methods) have been used in geotechnical engineering (Phoon et al., 1990; Mellah et al., 2000; Eloseily et al., 2002). FORM/SORM and importance sampling are applied less in this context, and have proven successful in engineering mechanics, both in academia and more recently in industry. Stochastic finite element (SFE) methods, named after the pioneering work by Ghanem and Spanos (1991), aim at representing way the complete response PDF in an intrinsic way. This is done by expanding the response (which, after proper discretization of the problem, is a random vector of unknown joint PDF) onto a particular basis of the probability space called the polynomial chaos (PC). Applications to geotechnical problems can be found in Ghanem and Brzkala (1996); Sudret and Der Kiureghian (2000); Ghiocel and Ghanem (2002); Clouteau and Lafargue (2003); Sudret et al. (2004, 2006); Berveiller et al. (2006)
In the following, we will concentrate on this last class of methods. Indeed, once the coefficients of the expansion have been computed, a straightforward post-processing of these quantities gives the statistical moments of the response under consideration, the probability of exceeding a threshold or the full PDF. The chapter is organized as follows. Section 7.2 presents methods for representing random fields that are applicable for describing the spatial variability of soils. Section 7.3 presents the principles of polynomial chaos expansions for representing both the (random) model response and possibly the non-Gaussian input. Section 7.4 and (respectively, 7.5) reviews the so-called intrusive (respectively, non-intrusive) solving scheme in stochastic finite element problems. Section 7.6 is devoted to the practical post-processing of polynomial chaos expansions. Finally, Section 7.7 presents some application examples.
[17:46 1/2/2008 5108-Phoon-Ch07.tex]
Job No: 5108
PHOON: RB Design in Geo. Eng.
Page: 261
260–297
262 B. Sudret and M. Berveiller
7.2 Representation of spatial variability 7.2.1 Basics of probability theory and notation Probability theory gives a sound mathematical framework to the represention of uncertainty and randomness. When a random phenomenon is observed, the set of all possible outcomes defines the sample space denoted by �. An event E is defined as a subset of � containing outcomes θ ∈ �. The set of events defines the σ -algebra F associated with �. A probability measure allows to associate numbers to events, i.e. their probability of occurrence. Finally the probability space constructed by means of these notions is denoted by (�, F, P). A real random variable X is a mapping X: (�, F, P) −→ R. For continuous random variables, the PDF and cumulative distribution function (CDF) are denoted by fX (x) and FX (x), respectively: FX (x) = P(X ≤ x)
fX (x) =
dFX (x) dx
(7.1)
The mathematical expectation will be denoted by E [·]. The mean, variance and nth moment of X are: � ∞ µ ≡ E [X] = x fX (x) dx (7.2) −∞
�
�
�
σ 2 = E (X − µ)2 = µ�n
�
=E X
n
�
� =
∞
−∞ ∞ −∞
(x − µ)2 fX (x) dx
(7.3)
xn fX (x) dx
(7.4)
A random vector X is a collection of random variables whose probabilistic description is contained in its joint PDF denoted by fX (x). The covariance of two random variables X and Y (e.g. two components of a random vector) is: � � (7.5) Cov [X , Y] = E (X − µX )(Y − µY ) Introducing the joint distribution fX,Y (x , y) of these variables, Equation (7.5) can be rewritten as: � ∞� ∞ Cov [X , Y] = (x − µX )(y − µY ) fX,Y (x , y) dx dy (7.6) −∞ −∞
The space of real random variables with finite second moment � � vectorial (E X 2 < ∞) is denoted by L2 (�, F, P). The expectation operator defines
[17:46 1/2/2008 5108-Phoon-Ch07.tex]
Job No: 5108
PHOON: RB Design in Geo. Eng.
Page: 262
260–297
Stochastic finite element methods 263
an inner product on this space: �X , Y� = E [XY]
(7.7)
This allows in particuler definition of orthogonal random variables (when their inner product is zero). 7.2.2 Random fields A unidimensional random field H(x , θ ) is a collection of random variables associated with a continuous index x ∈ Ω ⊂ Rn , where θ ∈ � is the coordinate in the outcome space. Using this notation, H(x , θo ) denotes a particular realization of the field (i.e. a usual function mapping Ω into R) whereas H(xo , θ ) is the random variable associated with point xo . Gaussian random fields are of practical interest because they are completely described by a mean function µ(x), a variance function σ 2 (x) and an autocovariance function CHH (x , x� ): � � (7.8) CHH (x , x� ) = Cov H(x) , H(x� ) Alternatively, the correlation structure of the field may be prescribed through the autocorrelation coefficient function ρ(x , x� ) defined as: ρ(x , x� ) =
CHH (x , x� ) σ (x) σ (x� )
(7.9)
Random fields are non-numerable infinite sets of correlated random variables, which is computationally intractable. Discretizing the random field ˆ H(x) consists in approximating it by H(x), which is defined by means of a finite set of random variables {χi , i = 1, ... n}, gathered in a random vector denoted by χ : H(x , θ )
Discretization
−→
ˆ , θ ) = G[x , χ (θ )] H(x
(7.10)
Several methods have been developed since the 1980s to carry out this task, such as the spatial average method (Vanmarcke and Grigoriu, 1983), the midpoint method (Der Kiureghian and Ke, 1988) and the shape function method (W. Liu et al., 1986a,b). A comprehensive review and comparison of these methods is presented in Li and Der Kiureghian (1993). These early methods are relatively inefficient, in the sense that a large number of random variables is required to achieve a good approximation of the field. More efficient approaches for discretization of random fields using series expansion methods have been introduced in the past 15 years, including the Karhunen–Loève Expansion (KL) (Ghanem and Spanos, 1991),
[17:46 1/2/2008 5108-Phoon-Ch07.tex]
Job No: 5108
PHOON: RB Design in Geo. Eng.
Page: 263
260–297
264 B. Sudret and M. Berveiller
the Expansion Optimal Linear Estimation (EOLE) method (Li and Der Kiureghian, 1993) and the Orthogonal Series Expansion (OSE) (Zhang and Ellingwood, 1994). Reviews of these methods have been presented in Sudret and Der Kiureghian (2000), see also Grigoriu (2006). The KL and EOLE methods are now briefly presented. 7.2.3 Karhunen–Loève expansion Let us consider a Gaussian random field H(x) defined by its mean value µ(x) and autocovariance function CHH (x , x� ) = σ (x) σ (x� ) ρ(x , x� ). The Karhunen–Loève expansion of H(x) reads: H(x , θ) = µ(x) +
∞ � �
λi ξi (θ ) ϕi (x)
(7.11)
i=1
� where {ξi (θ ), i = 1, ... } are zero-mean orthogonal variables and λi , ϕi (x) are solutions of the eigenvalue problem: � CHH (x , x� ) ϕi (x� ) dΩx� = λi ϕi (x) (7.12) Ω
Equation (7.12) is a Fredholm integral equation. Since kernel CHH (· , ·) is an autocovariance function, it is bounded, symmetric and positive definite. Thus the set of {ϕi } forms a complete orthogonal basis. The set of eigenvalues (spectrum) is moreover real, positive and numerable. In a sense, Equation (7.11) corresponds to a separation of the space and randomness variables in H(x , θ ). The Karhunen–Loève expansion possesses other interesting properties (Ghanem and Spanos, 1991). •
It is possible to order the eigenvalues λi in a descending series converging to zero. Truncating the ordered series (7.11) after the Mth term gives the KL approximated field: ˆ , θ ) = µ(x) + H(x
M � �
λi ξi (θ) ϕi (x)
(7.13)
i=1
•
•
The covariance eigenfunction basis {ϕi (x)} is optimal in the sense that the mean square error (integrated over Ω) resulting from a truncation after the Mth term is minimized (with respect to the value it would take when any other complete basis {hi (x)} is chosen). The set of random variables appearing in (7.11) is orthonormal if and only if the basis functions {hi (x)} and the constants λi are solutions of the eigenvalue problem (7.12).
[17:46 1/2/2008 5108-Phoon-Ch07.tex]
Job No: 5108
PHOON: RB Design in Geo. Eng.
Page: 264
260–297
Stochastic finite element methods 265
•
•
As the random field is Gaussian, the set of {ξi } are independent standard normal variables. Furthermore, it can be shown (Loève, 1977) that the Karhunen–Loève expansion of Gaussian fields is almost surely convergent. For non-Gaussian fields, the KL expansion also exists; however, the random variables appearing in the series are of unknown law and may be correlated (Phoon et al., 2002b, 2005; Li et al., 2007). From Equation (7.13), the error variance obtained when truncating the expansion after M terms turns out to be, after basic algebra: M � � � ˆ Var H(x) − H(x) = σ 2 (x) − λi ϕi2 (x) i=1
� � ˆ = Var [H(x)] − Var H(x) ≥0
(7.14)
The right-hand side of the above equation is always positive because it is the variance of some quantity. This means that the Karhunen–Loève expansion always underrepresents the true variance of the field. The accuracy of the truncated expansion has been investigated in details in Huang et al. (2001). Equation (7.12) can be solved analytically only for few autocovariance functions and geometries of Ω. Detailed closed form solutions for triangular and exponential covariance functions for one-dimensional homogeneous fields can be found in Ghanem and Spanos (1991). Otherwise, a numerical solution to the eigenvalue problem (7.12) can be obtained (same reference, chapter 2). Wavelet techniques have been recently applied for this purpose in Phoon et al. (2002a), leading to a fairly efficient approximation scheme. 7.2.4 The EOLE method The expansion optimal linear estimation method (EOLE) was proposed by Li and Der Kiureghian (1993). It is based on the pointwise regression of the original random field with respect to selected values of the field, and a compaction of the data by spectral analysis. Let us consider a Gaussian random field as defined above and a grid of points {x1 , ... xN } in the domain Ω. Let us denote by χ the random vector {H(x1 ), ... H(xN )}. By construction, χ is a Gaussian vector whose mean value µχ and covariance matrix � χ χ read: µiχ = µ(xi ) � � �
= Cov H(xi ) , H(xj ) = σ (xi ) σ (xj ) ρ(xi , xj ) �χ χ i,j
[17:46 1/2/2008 5108-Phoon-Ch07.tex]
Job No: 5108
PHOON: RB Design in Geo. Eng.
(7.15) (7.16)
Page: 265
260–297
266 B. Sudret and M. Berveiller
The optimal linear estimation (OLE) of random variable H(x) onto the random vector χ reads: �
H(x) ≈ µ(x) + � �Hχ (x) · � −1 χ χ · χ − µχ
(7.17)
where (.)� denotes the transposed matrix and � Hχ (x) is a vector whose components are given by: � � � � j � Hχ (x) = Cov H(x), χj = Cov H(x) , H(xj )
(7.18)
Let us now consider the spectral decomposition of the covariance matrix χχ :
χχ φ i = λi φ i
i = 1, . . . , N
(7.19)
This allows to linearly transform the original vector χ : χ (θ ) = µχ +
N � �
λi ξi (θ ) φ i
(7.20)
i=1
where {ξi , i = 1, ... N} are independent standard normal variables. Substituting for (7.20) in (7.17) and using (7.19) yields the EOLE representation of the field : ˆ , θ ) = µ(x) + H(x
N � ξi (θ) T � φi � H(x)χ λi i=1
(7.21)
As in the Karhunen–Loève expansion, the series can be truncated after r ≤ N terms, the eigenvalues λi being sorted first in descending order. The variance of the error for EOLE is: r � � �2 � 1 T 2 ˆ Var H(x) − H(x) = σ (x) − φ i H(x) χ λi
(7.22)
i=1
As in KL, the second term in the above equation is identical to the variance ˆ of H(x). Thus EOLE also always underrepresents the true variance. Due to the form of (7.22), the error decreases monotonically with r, the minimal error being obtained when no truncation is made (r = N). This allows one to define automatically the cut-off value r for a given tolerance in the variance error.
[17:46 1/2/2008 5108-Phoon-Ch07.tex]
Job No: 5108
PHOON: RB Design in Geo. Eng.
Page: 266
260–297
Stochastic finite element methods 267
7.3 Polynomial chaos expansions 7.3.1 Expansion of the model response Having recognized that the input parameters such as the soil properties can be modeled as random fields (which are discretized using standard normal random variables), it is clear that the response of the system is a nonlinear function of these variables. After a discretization procedure (e.g. finite element or finite difference scheme), the response may be considered as a random vector S, whose probabilistic properties are yet to be determined. Due to the above representation of the input, it is possible to expand the response S onto the so-called polynomial chaos basis, which is a basis of the space of random variables with finite variance (Malliavin, 1997): S=
∞ �
Sj Ψj
� ∞ ξn n=1
(7.23)
j=0
In this expression, the Ψj ’s are the multivariate Hermite polynomials defined by means of the ξn ’s. This basis is orthogonal with respect to the Gaussian measure, i.e. the expectation of products of two different such polynomials is zero (see details in Appendix A). Computationnally speaking, the input parameters are represented using M independent standard normal variables, see Equations (7.13) and (7.21). Considering all M-dimensional Hermite polynomials of degree not exceeding p, the response may be approximated as follows: S≈
P−1 �
Sj Ψj (ξ ) ,
ξ = {ξ1 , . . . , ξM }
(7.24)
j=0
The number of unknown (vector) coefficients in this summation is: � � M+p (M + p)! P= = M! p! p
(7.25)
The practical construction of a polynomial chaos of order M and degree p is described in Appendix A. The problem is now recast as computing the expansion coefficients {Sj , j = 0, . . . , P − 1}. Two classes of methods are presented below in Sections 7.4 and 7.5. 7.3.2 Representation of non-Gaussian input In Section 7.2, the representation of the spatial variability through Gaussian random fields has been shown. It is important to note that many soil
[17:46 1/2/2008 5108-Phoon-Ch07.tex]
Job No: 5108
PHOON: RB Design in Geo. Eng.
Page: 267
260–297
268 B. Sudret and M. Berveiller
properties should not be modeled as Gaussian random variables or fields. For instance, the Poisson ratio is a bounded quantity, whereas Gaussian variables are defined on R. Parameters such as the Young’s modulus or the cohesion are positive in nature: modeling them as Gaussian introduces an approximation that should be monitored carefully. Indeed, when a large dispersion of the parameter is considered, choosing a Gaussian representation can easily lead to negative realizations of the parameter, which have no physical meaning (lognormal variables or fields are often appropriate). As a consequence, if the parameter under consideration is modeled by a non-Gaussian random field, it is not possible to expand it as a linear expression in standard normal variables as in Equations (7.13) and (7.21). Easy-to-define non-Gaussian random fields H(x) are obtained by translation of a Gaussian field N(x) using a nonlinear transform h(.): H(x) = h(N(x))
(7.26)
The discretization of this kind of field is straightforward: the nonlinear transˆ form h(.) is directly applied to the discretized underlying Gaussian field N(x) (see e.g. Ghanem, 1999, for lognormal fields). ˆ ˆ H(x) = h(N(x))
(7.27)
From another point of view, the description of the spatial variability of parameters is in some cases beyond the scope of the analysis. For instance, soil properties may be considered homogeneous in some domain. These parameters are not well known though, and it may be relevant to model them as (usually non-Gaussian) random variables. It is possible to transform any continuous random variable with finite variance in a standard normal variable using the iso-probabilistic transform: denoting by FX (x) (respectively, (x)) the CDF of X (respectively, a standard normal variable ξ ), the direct and inverse transform read: ξ = −1 ◦ FX (x)
−1 X = FX ◦ (ξ )
(7.28)
If the input parameters are modeled by a random vector with independent components, it is possible to represent it using a standard normal random vector of the same size by applying the above transform each component. If the input random vector has a prescribed joint PDF, it is generally not possible to transform it exactly in a standard normal random vector. However, when only marginal PDF and correlations are known, an approximate representation may be obtained by the Nataf transform (Liu and Der Kiureghian, 1986). As a conclusion, the input parameters of the model, which do or do not exhibit spatial variability, may always be represented after some
[17:46 1/2/2008 5108-Phoon-Ch07.tex]
Job No: 5108
PHOON: RB Design in Geo. Eng.
Page: 268
260–297
Stochastic finite element methods 269
discretization process, mapping, or combination thereof, as functionals of standard normal random variables: • • •
for non-Gaussian independent random variables, see Equation (7.28); for Gaussian random fields, see Equations(7.13),(7.21); for non-Gaussian random fields obtained by translation, see Equation (7.27).
Note that Equation (7.28) is an exact representation, whereas the field discretization techniques provide only approximations (which converge to the original field if the number of standard normal variables tends to infinity). In the sequel, we consider that the discretized input fields and non Gaussian random variables are represented through a set of independent standard normal variables ξ of size M and we denote by X(ξ ) the functional that yields the original variables and fields.
7.4 Intrusive SFE method for static problems The historical SFE approach consists in computing the response coefficients of the vector of nodal displacements U(θ) (Equation (7.24)). It is based on the minimization of the residual in the balance equation in the Galerkin sense (Ghanem and Spanos, 1991). To illustrate this method, let us consider a linear mechanical problem, whose finite element discretization leads to the following linear system (in the deterministic case): K·U = F
(7.29)
Let us denote by Nddl the number of degrees of freedom of the structure, i.e. the size of the above linear system. If the material parameters are described by random variables and fields, the stiffness matrix K in the above equation becomes random. Similarly, the load vector F may be random. These quantities can be expanded onto the polynomial chaos basis: K=
∞ �
K j Ψj
(7.30)
Fj Ψ j
(7.31)
j=0
F=
∞ � j=0
In these equations, Kj are deterministic matrices whose complete description can be found elsewhere (e.g. Ghanem and Spanos (1991) in the case when the input Young’s modulus is a random field, and Sudret et al. (2004) when the Young’s modulus and the Poisson ratio non-Gaussian random variables).
[17:46 1/2/2008 5108-Phoon-Ch07.tex]
Job No: 5108
PHOON: RB Design in Geo. Eng.
Page: 269
260–297
270 B. Sudret and M. Berveiller
In the same manner, Fj are deterministic load vectors obtained from the data (Sudret et al., 2004; Sudret et al., 2006). As a consequence, the vector of nodal displacements U is random and may be represented on the same basis: U=
∞ �
U j Ψj
(7.32)
j=0
When the three expansions (7.30)–(7.32) are truncated after P terms and substituted for in Equation (7.29), the residual P in the stochastic balance equation reads:
P =
�P−1 �
� P−1 P−1 � � KΨ · UΨ − FΨ i i
i=0
j j
j=0
j j
(7.33)
j=0
Coefficients {U0 , . . . , UP−1 } are obtained by minimizing the residual using a Galerkin technique. This minimization is equivalent to requiring the residual be orthogonal to the subspace of L2 (�, F, P) spanned by {Ψj }P−1 j=0 : � � E P Ψk = 0 , k = {0, . . . , P − 1}
(7.34)
After some algebra, this leads to the following linear system, whose size is equal to Nddl × P: K0,0 · · · K0,P−1 U0 F0 K1,0 · · · K1,P−1 U F 1 1 · .. = .. .. .. . . . . UP−1 FP−1 KP−1,0 · · · KP−1,P−1
where Kj,k =
P−1 �
(7.35)
dijk Ki and dijk = E[Ψi Ψj Ψk ].
i=0
Once the system has been solved, the coefficients Uj may be post-processed in order to represent the response PDF (e.g. by Monte Carlo simulation), to compute the mean value, standard deviation and higher moments or to evaluate the probability of exceeding a given threshold. The post-processing techniques are detailed in Section 7.6. It is important to note already that the set of Uj ’s contains all the probabilistic information on the response, meaning that post-processing is carried out without additional computation on the mechanical model.
[17:46 1/2/2008 5108-Phoon-Ch07.tex]
Job No: 5108
PHOON: RB Design in Geo. Eng.
Page: 270
260–297
Stochastic finite element methods 271
The above approach is easy to apply when the mechanical model is linear. Although nonlinear problems have been recently addressed (Ghiocel and Ghanem, 2002; Matthies and Keese, 2005), their treatment is still not completely mature. Moreover, this approach naturally yields the expansion of the basic response quantities (such as the nodal displacements in mechanics). When derived quantities such as strains or stresses are of interest, additional work (and approximations) is needed. Note that in the case of non-Gaussian input random variables, expansion of these variables onto the PC basis is needed in order to apply the method, which introduces an approximation of the input. Finally, the implementation of the historical method as described in this section has to be carried out for each class of problem: this is why it has been qualified as intrusive in the literature. All these reasons have lead to the development of so-called non-intrusive methods that in some sense provide an answer to the above drawbacks.
7.5 Non-intrusive SFE methods 7.5.1 Introduction Let us consider a scalar response quantity S of the model under consideration, e.g. a nodal displacement, strain or stress component in a finite element model: S = h(X)
(7.36)
Contrary to Section 7.4, each response quantity of interest is directly expanded onto the polynomial chaos as follows: S=
∞ �
Sj Ψ j
(7.37)
j=0
The P-term approximation reads: S˜ =
P−1 �
S j Ψj
(7.38)
j=0
Two methods are now proposed to compute the coefficients in this expansion from a series of deterministic finite element analysis. 7.5.2 Projection method The projection method is based on the orthogonality of the polynomial chaos. By pre-multiplying Equation (7.38) by Ψi and taking the expectation
[17:46 1/2/2008 5108-Phoon-Ch07.tex]
Job No: 5108
PHOON: RB Design in Geo. Eng.
Page: 271
260–297
272 B. Sudret and M. Berveiller
of both members, it comes: � �∞ � � � E S Ψj = E S j Ψi Ψj
(7.39)
i=0
� � Due to the orthogonality of the basis, E Ψi Ψj = 0 for any i = j. Thus: � � E S Ψj Sj = � � E Ψj2
(7.40)
In this expression, the denominator is known analytically (see Appendix A) and the numerator may be cast as a multidimensional integral: � � � E S Ψj = h(X(ξ )) Ψj (ξ ) ϕM (ξ ) dξ (7.41) RM
where ϕM is the M-dimensional multinormal PDF, and where the dependency of S in ξ through the iso-probabilistic transform of the input parameters X(ξ ) has been given for the sake of clarity. This integral may be computed by crude Monte Carlo simulation (Field, 2002) or Latin Hypercube Sampling (Choi et al., 2004). However the number of samples required in this case should be large enough, say 10,000–100,000, to obtain a sufficient accuracy. In cases when the response S is obtained by a computationally demanding finite element model, this approach is practically not applicable. Alternatively, the use of quasi-random numbers instead of Monte Carlo (Niederreiter, 1992) simulation has been recently investigated in Sudret et al. (2007), and appears promising. An alternative approach presented in Berveiller et al. (2004) and Matthies and Keese (2005) is the use of a Gaussian quadrature scheme to evaluate the integral. Equation (7.41) is computed as a weighted summation of the integrands evaluated at selected points (the so-called integration points): K K � � � ��
�
� E S Ψj ≈ ··· ωi1 . . . ωiM h X ξi1 , . . . , ξiM Ψj ξi1 , . . . , ξiM i1 =1
iM =1
(7.42) In this expression, the integration points {ξij , 1 ≤ i1 ≤ · · · ≤ iM ≤ K} and weights {ωij , 1 ≤ i1 ≤ · · · ≤ iM ≤ K} in each dimension are computed using the theory of orthogonal polynomials with respect to the Gaussian measure. For a Kth order scheme, the integration points are the roots of the Kth order Hermite polynomial (Abramowitz and Stegun, 1970).
[17:46 1/2/2008 5108-Phoon-Ch07.tex]
Job No: 5108
PHOON: RB Design in Geo. Eng.
Page: 272
260–297
Stochastic finite element methods 273
The proper order of the integration scheme K is selected as follows: if the response S in Equation (7.37) was polynomial of order p (i.e. Sj = 0 for j ≥ P), the terms in the integral (7.41) would be of degree less than or equal to 2p. Thus an integration scheme of order K = p + 1 would give the exact value of the expansion coefficients. We take this as a rule in the general case, where the result now is only an approximation of the true value of Sj . As seen from Equations (7.40),(7.42), the projection method allows computation of the expansion coefficients from selected evaluations of the model. Thus the method is qualified as non-intrusive since the deterministic computation scheme (i.e. a finite element code) is used without any additional implementation or modification. Note that in finite element analysis, the response is usually a vector (e.g. of nodal displacements, nodal stresses, etc.). The above derivations are strictly valid for a vector response S, the expectation in Equation (7.42) being computed component by component. 7.5.3 Regression method The regression method is another approach for computing the response expansion coefficients. It is nothing but the regression of the exact solution S with respect to the polynomial chaos basis {Ψj (ξ ), j = 1, . . . , P − 1}. Let us assume the following expression for a scalar response quantity S: ˜ )+ε S = h(X) = S(ξ
˜ )= S(ξ
P−1 �
Sj Ψj (ξ )
(7.43)
j=0
where the residual ε is supposed to be a zero-mean random variable, and S = {Sj , j = 0, . . . , P − 1} are the unknown coefficients. The minimization of the variance of the residual with respect to the unknown coefficients leads to: � � ˜ ))2 (7.44) S = Argmin E (h(X (ξ )) − S(ξ In order to solve Equation (7.44), we choose a set of Q regression points in the standard normal space, say {ξ 1 , . . . ξ Q }. From these points, the isoprobabilistic transform (7.28) gives a set of Q realizations of the input vector X, say {x1 , . . . xQ }. The mean-square minimization (7.44) leads to solve the following problem: 2 Q P−1 � 1 � i S = Argmin h(x ) − Sj Ψj (ξ i ) Q i=1
[17:46 1/2/2008 5108-Phoon-Ch07.tex]
Job No: 5108
(7.45)
j=0
PHOON: RB Design in Geo. Eng.
Page: 273
260–297
274 B. Sudret and M. Berveiller
Denoting by Ψ the matrix whose coefficients are given by Ψ ij = Ψj (ξ i ), i = 1, . . . , Q; j = 0, . . . , P−1, and by S ex the vector containing the exact response values computed by the model S ex = {h(xi ), i = 1, . . . , Q}, the solution to Equation (7.45) reads: S = (Ψ T · Ψ )−1 · Ψ T · S ex
(7.46)
The regression approach detailed above is comparable with the so-called response surface method used in many domains of science and engineering. In this context, the set of {x1 , . . . xQ } is the so-called experimental design. In Equation (7.46), Ψ T · Ψ is the information matrix. Computationally speaking, it may be ill-conditioned. Thus a particular solver such as the Singular Value Decomposition method should be employed (Press et al., 2001). It is now necessary to specify the choice of the experimental design. In the context of PC-based methods, it has been shown in Berveiller (2005) and Sudret (2005) that an efficient design can be built from the roots of the Hermite polynomials as follows. •
• •
If p denotes the maximal degree of the polynomials in the truncated PC expansion, then the p + 1 roots of the Hermite polynomial of degree p + 1 (denoted by Hep+1 ) are computed, say {r1 , . . . , rp+1 }. From this set, M-uplets are built using all possible combinations of the roots: rk = (ri1 , . . . , riM ), 1 ≤ i1 ≤ · · · ≤ iM ≤ p + 1, k = 1, . . . (p + 1)M . The Q points in the experimental design {ξ 1 , . . . , ξ Q } are selected among the r j ’s by retaining those which are closest to the origin of the space, i.e. those with the smallest norm, or equivalently those leading to the largest values of the PDF ϕM (ξ j ).
To choose the size Q of the experimental design, the following empirical rule was proposed by Berveiller (2005) based on a large number of numerical experiments: Q = (M − 1)P
(7.47)
A slightly more efficient rule leading to a smaller value of Q has been recently proposed by Sudret (2006), based on the invertibility of the information matrix.
7.6 Post-processing of the SFE results 7.6.1 Representation of response PDF Once the coefficients Sj of the expansion of a response quantity are known, the polynomial approximation can be simulated using Monte
[17:46 1/2/2008 5108-Phoon-Ch07.tex]
Job No: 5108
PHOON: RB Design in Geo. Eng.
Page: 274
260–297
Stochastic finite element methods 275
Carlo simulation. A sample of standard normal random vector is generated, say {ξ (1) , . . . , ξ (n) }. Then the PDF can be plotted using a histogram representation, or better, kernel smoothing (Wand and Jones, 1995). 7.6.2 Computation of the statistical moments From Equation (7.38), due to the orthogonality of the polynomial chaos basis, it is easy to see that the mean and variance of S is given by: E [S] = S0 Var [S] = σS2 =
P−1 �
(7.48) � � Sj2 E Ψj2
(7.49)
j=1
where the expectation of Ψj2 is given in Appendix A. Moments of higher order are obtained in a similar manner. Namely the skewness and kurtosis coefficients of response variable S (denoted by δS and κS , respectively) are obtained as follows: P−1 P−1 P−1 � 1 ��� 1 � E[Ψi Ψj Ψk ] Si Sj Sk (7.50) δS ≡ 3 E (S − E [S])3 = 3 σS σS i=1 j=1 k=1
κS ≡
P−1 P−1 P−1 P−1 � � 1 ���� 4 = E (S − E E[Ψi Ψj Ψk Ψl ]Si Sj Sk Sl (7.51) [S]) σS4 σS4 i=1 j=1
1
k=1 l=1
Here again, expectation of products of three (respectively four) Ψj ’s are known analytically; see for example Sudret et al. (2006). 7.6.3 Sensitivity analysis: selection of important variables The problem of selecting the most “important” input variables of a model is usually known as sensitivity analysis. In a probabilistic context, methods of global sensitivity analysis aim at quantifying which input variable (or combination of input variables) influences the most the response variability. A state-of-the-art of such techniques is available in Saltelli et al. (2000). They include regression-based methods such as the computation of standardized regression coefficients (SRC) or partial correlation coefficients (PCC) and variance-based methods, also called ANOVA techniques for “ANalysis Of VAriance.” In this respect, the Sobol’ indices (Sobol’, 1993; Sobol’ and Kucherenko, 2005) are known as the most efficient tool to find out the important variables of a model. The computation of Sobol’ indices is traditionnally carried out by Monte Carlo simulation (Saltelli et al., 2000), which may be computationally
[17:46 1/2/2008 5108-Phoon-Ch07.tex]
Job No: 5108
PHOON: RB Design in Geo. Eng.
Page: 275
260–297
276 B. Sudret and M. Berveiller
unaffordable in case of time-consuming models. In the context of stochastic finite element methods, it has been recently shown in Sudret (2006) that the Sobol’ indices can be derived analytically from the coefficients of the polynomial chaos expansion of the response, once the latter have been computed by one of the techniques detailed in Sections 7.4 and 7.5. For instance, the first order Sobol’ indices {δi , i = 1, ... , M}, which quantify what fraction of the response variance is due to each input variable i = 1, ... , M: δi =
�� � � VarXi E S|Xi
(7.52)
Var [S]
can be evaluated from the coefficients of the PC expansion (Equation (7.38)) as follows: � � � Sα2 E Ψα2 /σS2 (7.53) δiPC = α∈Ii
In this equation, σS2 is the variance of the model response computed from the PC coefficients (Equation (7.49)) and the summation set (defined using the multi-index notation detailed in Appendix) reads: !
Ii = α : αi > 0, αj =i = 0
(7.54)
Higher-order Sobol’ indices, which correspond to interactions of the input parameters, can also be computed using this approach; see Sudret (2006) for a detailed presentation and an application to geotechnical engineering. 7.6.4 Reliability analysis Structural reliability analysis aims at computing the probability of failure of a mechanical system with respect to a prescribed failure criterion by accounting for uncertainties arising in the model description (geometry, material properties) or the environment (loading). It is a general theory whose development began in the mid 1970s. The research on this field is still active – see Rackwitz (2001) for a review. Surprisingly, the link between structural reliability and the stochastic finite element methods based on polynomial chaos expansions is relatively new (Sudret and Der Kiureghian, 2000, 2002; Berveiller, 2005). For the sake of completeness, three essential techniques for solving reliability problems are reviewed in this section. Then their application together with (a) a determinitic finite element model and (b) a PC expansion of the model response is detailed.
[17:46 1/2/2008 5108-Phoon-Ch07.tex]
Job No: 5108
PHOON: RB Design in Geo. Eng.
Page: 276
260–297
Stochastic finite element methods 277
Problem statement
� Let us denote by X = X1 , X2 , . . ., XM the set of random variables describing the randomness in the geometry, material properties and loading. This set also includes the variables used in the discretization of random fields, if any. The failure criterion under consideration is mathematically represented by a limit state function g(X) defined in the space of parameters as follows: • • •
g(X) > 0 defines the safe state of the structure. g(X) ≤ 0 defines the failure state. g(X) = 0 defines the limit state surface.
Denoting by fX (x) the joint PDF of random vector X, the probability of failure of the structure is : � Pf = fX (x) dx (7.55) g(x)≤0
In all but academic cases, this integral cannot be computed analytically. Indeed, the failure domain is often defined by means of response quantities (e.g. displacements, strains, stresses, etc.), which are computed by means of computer codes (e.g. finite element code) in industrial applications, meaning that the failure domain is implicitly defined as a function of X. Thus numerical methods have to be employed. Monte Carlo simulation Monte Carlo simulation (MCS) is a universal method for evaluating integrals such as Equation (7.55). Denoting by 1[g(x)≤0] (x) the characteristic function of the failure domain (i.e. the function that takes the value 0 in the safe domain and 1 in the failure domain), Equation (7.55) rewrites: � � � Pf = 1[g(x)≤0] (x) fX (x) dx = E 1[g(x)≤0] (x) (7.56) RM
where E [.] denotes the mathematical expectation. Practically, Equation (7.56) can be evaluated by simulating Nsim realizations !
of � the random
vector X, say X (1) , . . . , X(Nsim ) . For each sample, g X(i)
is evaluated.
An estimation of Pf is given by the empirical mean: Pˆ f =
Nsim N 1 � 1[g(x)≤0] (X(i) ) = fail Nsim Nsim
(7.57)
i=1
[17:46 1/2/2008 5108-Phoon-Ch07.tex]
Job No: 5108
PHOON: RB Design in Geo. Eng.
Page: 277
260–297
278 B. Sudret and M. Berveiller
where Nfail denotes the number of samples that are in the failure domain. As mentioned above, MCS is applicable whatever the complexity of the deterministic model. However, the number of samples Nsim required to get an accurate estimation of Pf may be dissuasive, especially when the value of Pf is small. Indeed, if the order of magnitude of Pf is about 10−k , a total number Nsim ≈ 4.10k+2 is necessary to get accurate results when using Equation (7.57). This number corresponds approximately to a coefficient of variation CV equal to 5% for the estimator Pˆ f . Thus crude MCS is not applicable when small values of Pf are sought and/or when the CPU cost of each run of the model is non-negligible. FORM method The first-order reliability method (Form) has been introduced to get an approximation of the probability of failure at a low cost (in terms of number of evaluations of the limit state function). The first step consists of recasting the problem in the standard normal space by using a iso-probabilistic transformation X → ξ = T (X). The Rosenblatt or Nataf transformations may be used for this purpose. Thus Equation (7.56) rewrites: � Pf =
� ϕM (ξ ) dξ
fX (x) dx =
(7.58)
g(T −1 (ξ ))≤0
g(x)≤0
where ϕM (ξ ) stands for the standard multinormal PDF: �
�
� 1
2 ϕM (ξ ) = √ �n exp − ξ12 + · · · + ξM 2 2π 1
(7.59)
This PDF is maximal at the origin and decreases exponentially with �ξ �2 . Thus the points that contribute at most to the integral in Equation (7.58) are those of the failure domain that are closest to the origin of the space. The second step in FORM thus consists in determining the so-called design point, i.e. the point of the failure domain closest to the origin in the standard normal space. This point P∗ is obtained by solving an optimisation problem:
� ! P∗ = ξ ∗ = Argmin �ξ �2 /g T −1 (ξ ) ≤ 0
(7.60)
Several algorithms are available to solve the above optimisation problem, e.g. the Abdo–Rackwitz (Abdo and Rackwitz, 1990) or the SQP (sequential
[17:46 1/2/2008 5108-Phoon-Ch07.tex]
Job No: 5108
PHOON: RB Design in Geo. Eng.
Page: 278
260–297
Stochastic finite element methods 279
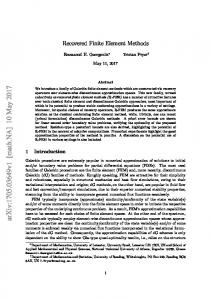
quadratic programming) algorithm. The corresponding reliability index is defined as: � � " " (7.61) β = sign g(T −1 (0)) · "ξ ∗ " It corresponds to the algebraic distance of the design point to the origin, counted as positive if the origin is in the safe domain, or negative in the other case. The third step of FORM consists of replacing the failure domain by the half space HS(P∗) defined by means of the hyperplane which is tangent to the limit state surface at the design point (see Figure 7.1). This leads to: � Pf =
� ϕM (ξ ) dξ ≈
g(T −1 (ξ ))≤0
ϕM (ξ ) dξ
(7.62)
HS(P∗)
The latter integral can be evaluated in a closed form and gives the first order approximation of the probability of failure: Pf ≈ Pf ,FORM = (−β)
(7.63)
where (x) denotes the standard normal CDF. The unit normal vector α = ξ ∗ /β allows definition of the sensitivity of the reliability index with respect to each variable. Precisely the squared components αi2 of α (which sum to one) are a measure of the importance of each variable in the computed reliability index. x2 g(ξ)=0
Failure Domain x2*
P*
β α
x1*
HS(P *)
x1
Figure 7.1 Principle of the first-order reliability method (FORM).
[17:46 1/2/2008 5108-Phoon-Ch07.tex]
Job No: 5108
PHOON: RB Design in Geo. Eng.
Page: 279
260–297
280 B. Sudret and M. Berveiller
Importance sampling FORM as described above gives an approximation of the probability of failure without any measure of its accuracy, in contrary to Monte Carlo simulation which provides an estimator of Pf together with the coefficient of variation thereof. Importance sampling (IS) is a technique that allows to combine both approaches. First the expression of the probability of failure is modified as follows: � (7.64) IDf (X(ξ )) ϕM (ξ ) dξ Pf = RM
where IDf (X(ξ )) is the characteristic function of the failure domain. Let us introduce the sampling density �(ξ ) in the above equation, which may be any valid M-dimensional PDF: � Pf =
RM
IDf (X(ξ ))
# $ ϕM (ξ ) ϕ (ξ ) � (ξ ) dξ = E� IDf (X(ξ )) M � (ξ ) � (ξ )
(7.65)
where E� [.] denotes the expectation with respect to the sampling density �(ξ ). To smartly apply IS after a FORM analysis, the following sampling density is chosen: � � "2 1" (7.66) � (ξ ) = (2π)−M/2 exp − "ξ − ξ ∗ " 2 This allows concentration of the samples around the design point. Then the following estimator of the probability of failure is computed: Pˆ f ,IS =
1 Nsim
N sim � i=1
1Df
� � ϕM ξ (i)
� X(ξ (i) ) � ξ (i)
(7.67)
which may be rewritten as: Nsim
� � � exp[−β 2 /2] � 1Df ξ (i) exp −ξ (i) · ξ ∗ Pˆ f ,IS = Nsim
(7.68)
i=1
As in any simulation method, the coefficient of variation CV of this estimator can be monitored all along the simulation. Thus the process can be stopped as soon as a small value of CV, say less than 5%, is obtained. As the samples are concentrated around the design point, a limited number of samples, say 100–1000, is necessary to obtain this accuracy.
[17:46 1/2/2008 5108-Phoon-Ch07.tex]
Job No: 5108
PHOON: RB Design in Geo. Eng.
Page: 280
260–297
Stochastic finite element methods 281
7.6.5 Reliability methods coupled with FE/SFE models The reliability methods (MCS, FORM and IS) described in the section above are general, i.e. not limited to stochastic finite element methods. They can actually be applied whatever the nature of the model, may it be analytical or algorithmic. •
•
When the model is a finite element model, a coupling between the reliability algorithm and the finite element code is necessary. Each time the algorithm requires the evaluation of the limit state function, the finite element code is called with the current set of input parameters. Then the limit state function is evaluated. This technique is called direct coupling in the next section dealing with application examples. When an SFE model has been computed first, the response is approximately represented as a polynomial series in standard normal random variables (Equation (7.37)). This is an analytical function that can now be used together with any of the reliability methods mentioned above.
In the next section, several examples are presented. In each case when a reliability problem is addressed, the direct coupling and the post-processing of a PC expansion are compared.
7.7 Application examples The application examples presented in the sequel have been originally published elsewhere, namely in Sudret and Der Kiureghian (2000, 2002) for the first example, Berveiller et al. (2006) for the second example and Berveiller et al. (2004) for the third example. 7.7.1 Example #1: Foundation problem – spatial variability Description of the deterministic problem Consider an elastic soil layer of thickness t lying on a rigid substratum. A superstructure to be founded on this soil mass is idealized as a uniform pressure P applied over a length 2 B of the free surface (see Figure 7.2). The soil is modeled as an elastic linear isotropic material. A plane strain analysis is carried out. Due to the symmetry, half of the structure is modeled by finite elements. Strictly speaking, there is no symmetry in the system when random fields of material properties are introduced. However, it is believed that this simplification does not significantly influence the results. The parameters selected for the deterministic model are listed in Table 7.1.
[17:46 1/2/2008 5108-Phoon-Ch07.tex]
Job No: 5108
PHOON: RB Design in Geo. Eng.
Page: 281
260–297
282 B. Sudret and M. Berveiller Table 7.1 Example #1 – Parameters of the deterministic model. Parameter
Symbol
Value
Soil layer thickness Foundation width Applied pressure Soil Young’s modulus Soil Poisson’s ratio Mesh width
t 2B P E ν L
30 m 10 m 0.2 MPa 50 MPa 0.3 60 m
2B
A E, n
t
Figure 7.2 Settlement of a foundation – problem definition.
(a) Mesh
(b) Deformed Shape
Figure 7.3 Finite element mesh and deformed shape for mean values of the parameters by a deterministic analysis.
A refined mesh was first used to obtain the “exact” maximum displacement under the foundation (point A in Figure 7.2). Less-refined meshes were then tried in order to design a mesh with as few elements as possible that yielded no more than 1% error in the computed maximum settlement. The mesh displayed in Figure 7.3(a) was eventually chosen. It contains 99 nodes and 80 elements. The maximum settlement computed with this mesh is equal to 5.42 cm.
[17:46 1/2/2008 5108-Phoon-Ch07.tex]
Job No: 5108
PHOON: RB Design in Geo. Eng.
Page: 282
260–297
Stochastic finite element methods 283
Description of the probabilistic data The assessment of the serviceability of the foundation described in the above paragraph is now investigated under the assumption that the Young’s modulus of the soil mass is spatially varying. The Young’s modulus of the soil is considered to vary only in the vertical direction, so that it is modeled as a one-dimensional random field along the depth. This is a reasonable model for a layered soil medium. The field is assumed to be lognormal and homogeneous. Its second-moment properties are considered to be the mean µE = 50 MPa, the coefficient of variation δE = σE /µE = 0.2. The autocorrelation coefficient function of the underlying Gaussian field (see Equation (7.26)) is ρEE (z , z� ) = exp(−|z − z� |/�), where z is the depth coordinate and � = 30 m is the correlation length. The accuracy of the discretization of the underlying Gaussian field N(x) depends on the number of terms M retained in the expansion. For each value of M, a global indicator of the accuracy of the discretization, ε¯ , is computed from � � � Var N(x) − N(x) ˆ 1 ε¯ = dΩ |Ω| Ω Var [N(x)]
(7.69)
A relative accuracy in the variance of 12% (respectively, 8%, 6%) is obtained when using M = 2 (respectively, 3, 4) terms in the KL expansion of N(x). Of course, these values are closely related to the parameters defining the random field, particularly the correlation length �. As � is comparable here to the size of the domain Ω, an accurate discretization is obtained using few terms. Reliability analysis The limit state function is defined in terms of the maximum settlement uA at the center of the foundation: g(ξ ) = u0 − uA (ξ )
(7.70)
where u0 is an admissible threshold initially set equal to 10 cm and ξ is the vector used for the random field discretization. Table 7.2 reports the results of the reliability analysis carried out either by direct coupling between the finite element model and the FORM algorithm (column #2), or by the application of FORM after solving the SFE problem (column #6, for various values of p). Both results have been validated using importance sampling (columns #3 and #7, respectively). In the direct coupling approach, 1000 samples (corresponding to 1000 deterministic FE runs) were used, leading to a coefficient of variation of the simulation less than 6%. In the SFE approach, the polynomial chaos expansion of the response is used
[17:46 1/2/2008 5108-Phoon-Ch07.tex]
Job No: 5108
PHOON: RB Design in Geo. Eng.
Page: 283
260–297
284 B. Sudret and M. Berveiller Table 7.2 Example #1 – Reliability index β – Influence of the orders of expansion M and p (u0 = 10cm). M
FORM βdirect
IS βdirect
p
P
FORM βSFE
IS βSFE
2
3.452
3.433
3
3.447
3.421
4
3.447
3.449
2 3 2 3 2 3
6 10 10 20 15 35
3.617 3.474 3.606 3.461 3.603 3.458
3.613 3.467 3.597 3.461 3.592 3.459
for importance sampling around the design point obtained by FORM (i.e. no additional finite element run is required), and thus 50,000 samples can be used, leading to a coefficient of variation of the simulation less than 1%. It appears that the solution is not that sensitive to the order of expansion of the input field (when comparing the results for M = 2 with respect to those obtained for M = 4). This can be understood easily by the fact that the maximum settlement of the foundation is related to the global (i.e. homogenized) behavior of the soil mass. Modeling in a refined manner the spatial variability of the stiffness of the soil mass by adding terms in the KL expansion does not significantly influence the results. In contrary, it appears that a PC expansion of third degree (p = 3) is required in order to get a satisfactory accuracy on the reliability index. Parametric study A comprehensive comparison of the two approaches is presented in Sudret and Der Kiureghian (2000), where the influences of various parameters are investigated. Selected results are reported in this section. More precisely, the accuracy of the SFE method combined with FORM is investigated when varying the value of the admissible settlement from 6 to 20 cm, which leads to an increasing reliability index. A two-term (M = 2) KL expansion of the underlying Gaussian field is used. The results are reported in Table 7.3. Column #2 shows the values obtained by direct coupling between FORM and the deterministic finite element model. Column #4 shows the values obtained using FORM after the SFE solution of the problem using an intrusive approach. The results in Table 7.3 show that the “SFE+FORM” procedure obviously converges to the direct coupling results when p is increased. It appears that a third-order expansion is accurate enough to predict reliability indices up to 5. For larger values of β, a fourth-order expansion should be used. Note that a single SFE analysis is carried out to get the reliability indices associated with the various values of the threshold u0 (once p is chosen).
[17:46 1/2/2008 5108-Phoon-Ch07.tex]
Job No: 5108
PHOON: RB Design in Geo. Eng.
Page: 284
260–297
Stochastic finite element methods 285 Table 7.3 Example #1 – Influence of the threshold in the limit state function. u0 (cm)
βdirect
6
0.473
8
2.152
10
3.452
12
4.514
15
5.810
20
7.480
p
βSFE
2 3 4 2 3 4 2 3 4 2 3 4 2 3 4 2 3 4
0.477 0.488 0.488 2.195 2.165 2.166 3.617 3.474 3.467 4.858 4.559 4.534 6.494 5.918 5.846 8.830 7.737 7.561
In contrary, a FORM analysis has to be restarted for each value of u0 when direct coupling is used. As a conclusion, if a single value of β (and related Pf ≈ (−β)) is of interest, direct coupling using FORM is probably the most efficient method. When the evolution of β with respect to a threshold is investigated, the “SFE+FORM” approach may become more efficient. 7.7.2 Example #2 : Foundation problem – non Gaussian variables Deterministic problem statement Let us consider now an elastic soil mass made of two layers of different isotropic linear elastic materials lying on a rigid substratum. A foundation on this soil mass is modeled by a uniform pressure P1 applied over a length 2 B1 = 10 m of the free surface. An additional load P2 is applied over a length 2 B2 = 5 m (Figure 7.4). Due to the symmetry, half of the structure is modeled by finite element (Figure 7.4). The mesh comprises 80 QUAD4 elements as in the previous section. The finite element code used in this analysis is the open source code Code_Aster.1 The geometry is considered as deterministic. The elastic material properties of both layers and the applied loads are modeled by random
[17:46 1/2/2008 5108-Phoon-Ch07.tex]
Job No: 5108
PHOON: RB Design in Geo. Eng.
Page: 285
260–297
286 B. Sudret and M. Berveiller
2B2 = 5m 2B1 = 10m P2 P1 A
t1 = 7,75m
t2 = 22,25m
E1, n1
E2, n2
Figure 7.4 Example #2: Foundation on a two-layer soil mass.
Table 7.4 Example #2: Two-layer soil layer mass – Parameters of the model. Parameter
Notation
Type of PDF
Mean value
Coef. of variation
Upper layer soil thickness Lower layer soil thickness Upper layer Young’s modulus Lower layer Young’s modulus Upper layer Poisson ratio Lower layer Poisson ratio Load #1 Load #2
t1 t2 E1 E2 ν1 ν2 P1 P2
Deterministic Deterministic Lognormal Lognormal Uniform Uniform Gamma Weibull
7.75 m 22.25 m 50 MPa 100 MPa 0.3 0.3 0.2 MPa 0.4 MPa
– – 20% 20% 15% 15% 20 % 20 %
variables, whose PDF are specified in Table 7.4. All six random variables are supposed to be independent. Again the model response under consideration is the maximum vertical displacement at point A (Figure 7.4). The finite element model is thus considered as an algorithmic function h(.) that computes the vertical nodal displacement uA as a function of the six input parameters: uA = h(E1 , E2 , ν1 , ν2 , P1 , P2 )
(7.71)
Reliability analysis The serviceability of this foundation on a layered soil mass vis-à-vis an admissible settlement is studied. Again, two stategies are compared. •
A direct coupling between the finite element model and the probabilistic code PROBAN (Det Norske Veritas, 2000). The limit state function
[17:46 1/2/2008 5108-Phoon-Ch07.tex]
Job No: 5108
PHOON: RB Design in Geo. Eng.
Page: 286
260–297
Stochastic finite element methods 287
given in Equation (7.70) is rewritten is this case as: g(X ) = u0 − h(E1 , E2 , ν1 , ν2 , P1 , P2 )
•
(7.72)
where u0 is the admissible settlement. The failure probability is computed using FORM analysis followed by importance sampling. One thousand samples are used in IS allowing a coefficient of variation of the simulation less than 5%. An SFE analysis using the regression method is carried out, leading to an approximation of the maximal vertical settlement: u˜ A =
P �
uj Ψj ({ξk }6k=1 )
(7.73)
j=0
For this purpose, the six input variables {E1 , E2 , ν1 , ν2 , P1 , P2 } are first transformed into a six-dimensional standard normal gaussian vector ξ ≡ {ξk }6k=1 . Then a third-order (p = 3) PC expansion of the response � � 6+3 is performed which requires the computation of P = = 84 3 coefficients. An approximate limit state function is then considered: g(X) ˜ = u0 −
P �
uj Ψj ({ξk }6k=1 )
(7.74)
j=0
Then FORM analysis followed by importance sampling is applied (one thousand samples, coefficient of variation less than 1% for the simulation). Note that in this case, FORM as well as IS are performed using the analytical limit state function Equation (7.74). This computation is almost costless compared to the computation of the PC expansion coefficients {uj }P−1 j=0 in Equation (7.73). Table 7.5 shows the probability of failure obtained by direct coupling and by SFE/regression using various numbers of points in the experimental design (see Section 7.5.3). Figure 7.5 shows the evolution of the ratio between the logarithm of the probability of failure (divided by the logarithm of the converged probability of failure) versus the number of regression points for several values of the maximum admissible settlement u0 . Accurate results are obtained when using 420 regression points or more for different values of the failure probability (from 10−1 to 10−4 ). When taking less than 420 points, results are inaccurate. When taking more than 420 points, the accuracy is not improved. Thus this number seems to be the best compromise between accuracy and efficiency. Note that it corresponds to 5 × 84 points, as pointed out in Equation (7.47).
[17:46 1/2/2008 5108-Phoon-Ch07.tex]
Job No: 5108
PHOON: RB Design in Geo. Eng.
Page: 287
260–297
288 B. Sudret and M. Berveiller Table 7.5 Example #2: Foundation on a two-layered soil – probability of failure Pf . Threshold Direct coupling u0 (cm)
Non-intrusive SFE/regression approach
12 3.09.10−1 15 6.83.10−2 20 2.13.10−3 22 4.61.10−4 Number of FE runs required
84 pts
168 pts
336 pts
420 pts
4096 pts
1.62.10−1 6.77.10−2 – – 84
2.71.10−1 6.90.10−2 9.95.10−5 7.47.10−7 168
3.31.10−1 8.43.10−2 8.22.10−4 1.31.10−4 336
3.23.10−1 6.73.10−2 2.01.10−3 3.80.10−4 420
3.32.10−1 6.93.10−2 1.98.10−3 4.24.10−4 4096
1.9
12 cm 15 cm 20 cm 22 cm
1.8 1.7 1.6 1.5 1.4 1.3 1.2 1.1 1 0.9 0
200
400 600 Number of points
800
1000
Figure 7.5 Example #2: Evolution of the logarithm of the failure probability divided by the converged value vs. the number of regression points.
7.7.3 Example #3: Deep tunnel problem Deterministic problem statement and probabilistic model Let us consider a deep tunnel in an elastic, isotropic homogeneous soil mass. Let us consider a homogeneous initial stress field. The coefficient of earth pressure at rest is defined as K0 =
[17:46 1/2/2008 5108-Phoon-Ch07.tex]
Job No: 5108
0 σxx 0 . σyy
Parameters describing geometry,
PHOON: RB Design in Geo. Eng.
Page: 288
260–297
Stochastic finite element methods 289
material properties and loads are given in Table 7.6. The analysis is carried out under plane strain conditions. Due to the symmetry of the problem, only a quarter of the problem is modeled by finite element using appropriate boundary conditions (Figure 7.6). The mesh contains 462 nodes and 420 4-node linear elements, which allow a 1.4%-accuracy evaluation of the radial displacement of the tunnel wall compared to a reference solution. Moment analysis One is interested in the radial displacement (convergence) of the tunnel wall, i.e. the vertical displacement of point E denoted by uE . The value um E obtained for the mean values of the random parameters (see Table 7.6) is 6.24 mm. A third-order (p = 3) � PC expansion of this nodal displace� 4+3 ment is computed. This requires P = = 35 coefficients. Various SFE 3 Table 7.6 Example #3 – Parameters of the model. Parameter
Notation
Type
Mean
Coef. of Var.
Tunnel depth Tunnel radius Vertical initial stress Coefficient of earth pressure at rest Young’s modulus Poisson ratio
L R 0 −σyy K0
Deterministic Deterministic Lognormal Lognormal
20 m 1m 0.2 MPa 0.5
– – 30% 10%
E ν
Lognormal Uniform [0.1–0.3]
50 MPa 0.2
20% 29%
L D
C dx = 0 dy = 0 E, n L
0 sYY
dx = 0
dx = 0 dy = 0
E R y o x
0 sXX
A
dy = 0
B
Figure 7.6 Scheme of the tunnel. Mesh of the tunnel.
[17:46 1/2/2008 5108-Phoon-Ch07.tex]
Job No: 5108
PHOON: RB Design in Geo. Eng.
Page: 289
260–297
290 B. Sudret and M. Berveiller
methods are applied to solve the SFE problem, namely the intrusive method (Section 7.4) and the non intrusive regression method (Section 7.5) using various experimental designs. The statistical moments of uE (reduced mean value E[uE ]/um E , coefficient of variation, skewness and kurtosis coefficients) are reported in Table 7.7. The reference solution is obtained by Monte Carlo simulation using 30,000 samples (column #2) with the deterministic finite element model. The coefficient of variation of this simulation is 0.25%. The regression method gives good results when there are at least 105 regression points (note that this corresponds again to Equation (7.47)). These results are slightly better than those obtained by the intrusive approach (column #3), especially for the skewness and kurtosis coefficients. This is due to the fact that input variables are expanded (i.e. approximated) onto the PC basis when applying the intrusive approach while they are exactly represented through the isoprobabilistic transform in the non intrusive approaches. Reliability analysis Let us now consider the reliability of the tunnel with respect to an admissible radial displacement u0 . The deterministic finite element model is considered as an algorithmic function h(.) that computes the radial nodal displacement uE as a function of the four input parameters:
� 0 uE = h E, ν, σyy , K0
(7.75)
Two solving stategies are compared. •
A direct coupling between the finite element model PROBAN. The limit state function reads in this case:
� 0 g(X) = u0 − h E, ν, σyy , K0 (7.76)
Table 7.7 Example #3 – Moments of the radial displacement at point E. Reference Monte Carlo
uE /um 1.017 E Coeff. of var. 0.426 Skewness −1.182 Kurtosis 5.670 Number of FE runs required
[17:46 1/2/2008 5108-Phoon-Ch07.tex]
Job No: 5108
Intrusive Non-intrusive SFE/Regression SFE (p = 3)
1.031 0.427 −0.807 4.209 −
35 pts
70 pts
105 pts
256 pts
1.311 1.157 −0.919 13.410 35
1.021 0.431 −1.133 5.312 70
1.019 0.431 −1.134 5.334 105
1.018 0.433 −1.179 5.460 256
PHOON: RB Design in Geo. Eng.
Page: 290
260–297
Stochastic finite element methods 291
•
where u0 is the admissible radial displacement. The failure probability is computed using FORM analysis followed by importance sampling. One thousand samples are used in IS allowing a coefficient of variation of the simulation less than 5%. A SFE analysis using the regression method is carried out, leading to an approximation of the radial displacement: u˜ E =
P �
uj Ψj ({ξk }4k=1 )
(7.77)
j=0
and the associated limit state function reads: g() = u0 −
P �
uj Ψj ({ξk }4k=1 )
(7.78)
j=0
The generalized reliability indices β = − −1 (Pf ,IS ) associated to limit state functions (7.76) and (7.78) for various values of u0 are reported in Table 7.8. The above results show that at least 105 points of regression should be used when a third-order PC expansion is used. Additional points do not improve the accuracy of the results. The intrusive and non-intrusive approaches give very similar results. They are close to the direct coupling results when the obtained reliability index is not too large. For larger values, the third-order PC expansion may not be accurate enough to solve the reliability problem. Anyway, the non-intrusive approach (which does not introduce any approximation of the input variables) is slightly more accurate than the non intrusive method, as explained in Example #2. Table 7.8 Example #3: Generalized reliability indices β = − −1 (Pf ,IS ) vs. admissible radial displacement. Threshold u0 (cm)
7 8 9 10 12 15 17 20
Direct coupling
0.427 0.759 1.046 1.309 1.766 2.328 2.627 3.342
[17:46 1/2/2008 5108-Phoon-Ch07.tex]
Intrusive SFE (p = 3, P = 35)
0.251 0.571 1.006 1.309 1.920 2.907 3.425 4.213
Job No: 5108
Non-intrusive SFE/regression 35 pts
70 pts
105 pts
256 pts
−0.072 0.038 0.215 0.215 0.538 0.857 1.004 1.244
0.227 0.631 1.034 1.350 1.977 2.766 3.222 3.823
0.413 0.734 0.994 1.327 1.769 2.346 2.663 3.114
0.405 0.752 1.034 1.286 1.747 2.322 2.653 3.192
PHOON: RB Design in Geo. Eng.
Page: 291
260–297
292 B. Sudret and M. Berveiller
7.8 Conclusion Modelling soil material properties properly is of crucial importance in geotechnical engineering. The natural heterogeneity of soil can be fruitfully modeled using probability theory. •
•
If an accurate description of the spatial variability is required, random fields may be employed. Their use in engineering problems requires their discretization. Two efficient methods have been presented for this purpose, namely the Karhunen–Loève expansion and the EOLE method. These methods should be better known both by researchers and engineers since they provide a much better accuracy than older methods such as point discretization or local averaging techniques. If an homogenized behavior of the soil is sufficient with respect to the geotechnical problem under consideration, the soil characteristics may be modeled as random variables that are usually non Gaussian.
In both cases, identification of the parameters of the probabilistic model is necessary. This is beyond the scope of this chapter. Various methods have been reviewed that predict the impact of input random parameters onto the response of the geotechnical model. Attention has been focused on a class of stochastic finite element methods based on polynomial chaos expansion. It has been shown how the input variables/fields should be first represented using functions of standard normal variables. Two classes of methods for computing the expansion coefficients have been presented, namely the intrusive and non-intrusive methods. The historical intrusive approach is well-suited to solve linear problems. It has been extended to some particular non linear problems, but proves delicate to apply in these cases. In contrary, the projection and regression methods are easy to apply whatever the physics since they make use only of the deterministic model as available in the finite element code. Several runs of the model for selected values of the input parameters are required. The computed responses are processed in order to get the PC expansion coefficients of the response. Note that the implementation of these non-intrusive methods is done once and for all, and can be applied thereafter with any finite element software at hand, and more generally with any model (possibly analytical). However, the non-intrusive methods may become computationnally expensive when the number of input variables is large, which may be the case when discretized random fields are considered. Based on a large number of application examples, the authors suggest the use of second-order (p = 2) PC expansions for estimating mean and standard deviation of response quantities. When reliability problems are considered, at least a third-order expansion is necessary to catch the true shape of the response PDF tail.
[17:46 1/2/2008 5108-Phoon-Ch07.tex]
Job No: 5108
PHOON: RB Design in Geo. Eng.
Page: 292
260–297
Stochastic finite element methods 293
Acknowledgments The work of the first author on spatial variability and stochastic finite element methods has been initiated during his post-doctoral stay in the research group of Professor Armen Der Kiureghian (Departement of Civil and Environmental Engineering, University of California at Berkeley), who is gratefully acknowledged. The work on non-intrusive methods (as well as most application examples presented here) is part of the PhD thesis of the second author. This work was co-supervised by Professor Maurice Lemaire (Institut Français de Mécanique Avancée, Clermont-Ferrand, France), who is gratefully acknowledged.
Appendix A A.1 Hermite polynomials The Hermite polynomials Hen (x) are solutions of the following differential equation: y�� − x y� + n y = 0
n∈N
(7.79)
They may be generated in practise by the following recurrence relationship: He0 (x) = 1
(7.80)
Hen+1 (x) = x Hen (x) − n Hen−1 (x)
(7.81)
They are orthogonal with respect to the Gaussian probability measure: �
∞
−∞
Hem (x) Hen (x) ϕ(x) dx = n! δmn
(7.82)
√ 2 where ϕ(x) = 1/ 2π e−x /2 is the standard normal PDF. If ξ is a standard normal random variable, the following relationship holds: � � E Hem (ξ ) Hen (ξ ) = n! δmn
(7.83)
The first three Hermite polynomials are: He1 (x) = x He2 (x) = x2 − 1
He3 (x) = x3 − 3x
(7.84)
A.2 Construction of the polynomial chaos The Hermite polynomial chaos of order M and degree p is the set of multivariate polynomials obtained by products of univariate polynomials so that
[17:46 1/2/2008 5108-Phoon-Ch07.tex]
Job No: 5108
PHOON: RB Design in Geo. Eng.
Page: 293
260–297
294 B. Sudret and M. Berveiller
the maximal degree is less than or equal to p. Let us define the following integer sequence α: α = {αi , i = 1, . . . , M},
αi ≥ 0,
M �
αi ≤ p
(7.85)
i=1
The multivariate polynomial Ψα is defined by: Ψα (x1 , . . . , xM ) =
M %
Heαi (xi )
(7.86)
i=1
The number of such polynomials of degree not exceeding p is: P=
(M + p)! M! p!
(7.87)
An original algorithm to determine the set of α’s is detailed in Sudret and Der Kiureghian (2000). Let Z be a standard normal random vector of size M. It is clear that: M � M � � % � � � % E Heαi (Zi ) Heβi (Zi ) = δα β E He2αi (Zi ) E Ψα (Z) Ψβ (Z) = i=1
i=1
(7.88) The latter equation shows that the polynomial chaos basis is orthogonal.
Notes 1 This is an open source finite element code developed by Electricité de France, R&D Division, see http://www.code-aster.org.
References Abdo, T. and Rackwitz, R. (1990). A new β-point algorithm for large time invariant and time-variant reliability problems. In: A. Der Kiureghian and P. ThoftChristensen, Editors, Reliability and Optimization of Structural Systems ’90. Proc. 3rd WG 7.5 IFIP Conf Berkeley 26–28 March 1990, Springer Verlag, Berlin (1991), pp. 1–12. Abramowitz, M. and Stegun, I. A. Eds (1970). Handbook of Mathematical Functions. Dover Publications, Inc., New York. Baecher, G.-B. and Ingra, T.-S. (1981). Stochastic finite element method in settlement predictions. Journal of the Geotechnical Engineering Division, ASCE, 107(4), 449–63.
[17:46 1/2/2008 5108-Phoon-Ch07.tex]
Job No: 5108
PHOON: RB Design in Geo. Eng.
Page: 294
260–297
Stochastic finite element methods 295 Berveiller, M. (2005). Stochastic finite elements: intrusive and non intrusive methods for reliability analysis. PhD thesis, Université Blaise Pascal, Clermont-Ferrand. Berveiller, M., Sudret, B. and Lemaire, M. (2004). Presentation of two methods for computing the response coefficients in stochastic finite element analysis. In Proceedings of the 9th ASCE Specialty Conference on Probabilistic Mechanics and Structural Reliability, Albuquerque, USA. Berveiller, M., Sudret, B. and Lemaire, M. (2006). Stochastic finite element: a non intrusive approach by regression. Revue Européenne de Mécanique Numérique, 15(1–3), 81–92. Choi, S., Grandhi, R., Canfield, R. and Pettit, C. (2004). Polynomial chaos expansion with latin hypercube sampling for estimating response variability. AIAA Journal, 45, 1191–8. Clouteau, D. and Lafargue, R. (2003). An iterative solver for stochastic soil-structure interaction. In Computational Stochastic Mechanics (CSM-4), Eds P. Spanos and G. Deodatis. Millpress, Rotterdam, pp. 119–24. DeGroot, D. and Baecher, G. (1993). Estimating autocovariance of in-situ soil properties. Journal of Geotechnical Engineering, ASCE, 119(1), 147–66. Der Kiureghian, A. and Ke, J.-B. (1988). The stochastic finite element method in structural reliability. Probablistic Engineering and Mechanics, 3(2), 83–91. Det Norske Veritas (2000). PROBAN user’s manual, V.4.3. Ditlevsen, O. and Madsen, H. (1996). Structural Reliability Methods. John Wiley and Sons, Chichester. Eloseily, K., Ayyub, B. and Patev, R. (2002). Reliability assessment of pile groups in sands. Journal of Structural Engineering, ASCE, 128(10), 1346–53. Fenton, G.-A. (1999a). Estimation for stochastic soil models. Journal of Geotechnical Engineering, ASCE, 125(6), 470–85. Fenton, G.-A. (1999b). Random field modeling of CPT data. Journal of Geotechnical Engineering, ASCE, 125(6), 486–98. Field, R. (2002). Numerical methods to estimate the coefficients of the polynomial chaos expansion. In Proceedings of the 15th ASCE Engineering Mechanics Conference. Ghanem, R. (1999). The nonlinear Gaussian spectrum of log-normal stochastic processes and variables. Journal of Applied Mechanic, ASME, 66, 964–73. Ghanem, R. and Brzkala, V. (1996). Stochastic finite element analysis of randomly layered media. Journal of Engineering Mechanics, 122(4), 361–9. Ghanem, R. and Spanos, P. (1991). Stochastic Finite Elements – A Spectral Approach. Springer, New York. Ghiocel, D. and Ghanem, R. (2002). Stochastic finite element analysis of seismic soil-structure interaction. Journal of Engineering Mechanics, (ASCE), 128, 66–77. Grigoriu, M. (2006). Evaluation of Karhunen–Loève, spectral and sampling representations for stochastic processes. Journal of Engineering Mechanics, (ASCE), 132(2), 179–89. Huang, S., Quek, S. and Phoon, K. (2001). Convergence study of the truncated Karhunen–Loève expansion for simulation of stochastic processes. International Journal of Numerical methods in Engineering, 52(9), 1029–43.
[17:46 1/2/2008 5108-Phoon-Ch07.tex]
Job No: 5108
PHOON: RB Design in Geo. Eng.
Page: 295
260–297
296 B. Sudret and M. Berveiller Li, C. and Der Kiureghian, A. (1993). Optimal discretization of random fields. Journal of Engineering Mechanics, 119(6), 1136–54. Li, L., Phoon, K. and Quek, S. (2007). Simulation of non-translation processes using non gaussian Karhunen–Loève expansion. Computers and Structures, 85(5–6), pp. 264–276, 2007. Liu, P.-L. and Der Kiureghian, A. (1986). Multivariate distribution models with prescribed marginals and covariances. Probablistic Engineering Mechanics, 1(2), 105–12. Liu, W., Belytschko, T. and Mani, A. (1986a). Probabilistic finite elements for non linear structural dynamics. Comparative Methods in Applied Mechanical Engineering, 56, 61–86. Liu, W., Belytschko, T. and Mani, A. (1986b). Random field finite elements, International Journal of Numerical Methods in Engineering, 23(10), 1831–45. Loève, M. (1977). Probability Theory. Springer. New-York. Malliavin, P. (1997). Stochastic Analysis. Springer, Berlin. Matthies, H. and Keese, A. (2005). Galerkin methods for linear and nonlinear elliptic stochastic partial differential equations. Comparative Methods in Applied Mechanical Engineering, 194, 1295–331. Mellah, R., Auvinet, G. and Masrouri, F. (2000). Stochastic finite element method applied to non-linear analysis of embankments. Probablistic Engineering Mechanics, 15(3), 251–9. Niederreiter, H. (1992). Random Number Generation and Quasi-Monte Carlo Methods. Society for Industrial and Applied Mathematics, Philadelphia, PA. Phoon, K., Huang, H. and Quek, S. (2005). Simulation of strongly non gaussian processes using Karhunen-Loève expansion. Probablistic Engineering Mechanics, 20(2), 188–98. Phoon, K., Huang, S. and Quek, S. (2002a). Implementation of Karhunen–Loève expansion for simulation using a wavelet–Galerkin scheme. Probablistic Engineering Mechanics, 17(3), 293–303. Phoon, K., Huang, S. and Quek, S. (2002b). Simulation of second-order processes using Karhunen–Loève expansion. Computers and Structures, 80(12), 1049–60. Phoon, K., Quek, S., Chow, Y. and Lee, S. (1990). Reliability analysis of pile settlements. Journal of Geotechnical Engineering, ASCE, 116(11), 1717–35. Popescu, R., Deodatis, G. and Nobahar, A. (2005). Effects of random heterogeneity of soil properties on bearing capacity. Probablistic Engineering Mechanics, 20, 324–41. Press, W., Vetterling, W., Teukolsky, S.-A. and Flannery, B.-P. (2001). Numerical Recipes. Cambridge University Press, Cambridge. Rackwitz, R. (2000). Reviewing probabilistic soil modeling. Comparative Geotechnics, 26, 199–223. Rackwitz, R. (2001). Reliability analysis – a review and some perspectives. Structural Safety, 23, 365–95. Saltelli, A., Chan, K. and Scott, E. Eds (2000). Sensitivity Analysis. John Wiley and Sons, New York. Sobol’, I. (1993). Sensitivity estimates for nonlinear mathematical models. Mathematical Modeling and Computational Experiment, 1, 407–14. Sobol’, I. and Kucherenko, S. (2005). Global sensitivity indices for nonlinear mathematical models. Review. Wilmott Magazine, 1, 56–61.
[17:46 1/2/2008 5108-Phoon-Ch07.tex]
Job No: 5108
PHOON: RB Design in Geo. Eng.
Page: 296
260–297
Stochastic finite element methods 297 Sudret, B. (2005). Des éléments finis stochastiques spectraux aux surfaces de réponse stochastiques: une approche unifiée. In Proceedings, 17ème Congrès Français de Mécanique – Troyes (in French). Sudret, B. (2006). Global sensitivity analysis using polynomial chaos expansions. In Procedings of the 5th International Conference on Comparative Stochastic Mechanics (CSM5), Eds P. Spanos and G. Deodatis Rhodos. Sudret, B., Berveiller, M. and Lemaire, M. (2004). A stochastic finite element method in linear mechanics. Comptes Rendus Mécanique, 332, 531–7 (in French). Sudret, B., Berveiller, M. and Lemaire, M. (2006). A stochastic finite element procedure for moment and reliability analysis. Revue Européenne de Mécanique Numérique, 15(7–8), 1819–35. Sudret, B., Blatman, G. and Berveiller, M. (2007). Quasi random numbers in stochastic finite element analysis – application to global sensitivity analysis. In Proceedings of the 10th International Conference on Applications of Statistics and Probability in Civil Engineering (ICASP10). Tokyo. Sudret, B. and Der Kiureghian, A. (2000). Stochastic finite elements and reliability: a state-of-the-art report. Technical Report n˚ UCB/SEMM-2000/08, University of California, Berkeley. Sudret, B. and Der Kiureghian, A. (2002). Comparison of finite element reliability methods. Probablistic Engineering Mechanics, 17, 337–48. Vanmarcke, E. (1977). Probabilistic modeling of soil profiles, Journal of the Geotechnical Engineering Division, ASCE, 103(GT11), 1227–46. Vanmarcke, E.-H. and Grigoriu, M. (1983). Stochastic finite element analysis of simple beams, Journal of Engineering Mechanics, ASCE, 109(5), 1203–14. Wand, M. and Jones, M. (1995). Kernel Smoothing. Chapman and Hall, London. Zhang, J. and Ellingwood, B. (1994). Orthogonal series expansions of random fields in reliability analysis. Journal of Engineering Mechanics, ASCE, 120(12), 2660–77.
[17:46 1/2/2008 5108-Phoon-Ch07.tex]
Job No: 5108
PHOON: RB Design in Geo. Eng.
Page: 297
260–297