costs to only a small percentage of a conventional monitoring system and there- fore will increase its application not only in monitoring bridges. Fig. 1: Diagram ...
Structural Health Monitoring with Wireless Sensor Networks
STRUCTURAL HEALTH MONITORING WITH WIRELESS SENSOR NETWORKS BAUWERKSÜBERWACHUNG MIT DRAHTLOSER SENSORTECHNIK SURVEILLANCE DES OUVRAGES D´ART AVEC D´APPARAILLAGE SANS FIL
Markus Krüger, Christian U. Grosse
SUMMARY Nowadays sustainability for both old and new buildings becomes more and more important. Therefore non-destructive test methods are of high interest. Non-destructive test methods are used for quality control of construction materials, inspection and analysis of materials or structures and are used for continuous monitoring of large constructions. A multitude of characteristic values of building structures is measured with conventional wired sensor systems nowadays, e.g. moisture, temperature and stress, strain or displacement under static or dynamic load. Modal analysis or acoustic emission analysis is used to characterize the condition of the structure. In the future non-destructive test methods in combination with structural health monitoring techniques will help to better understand the structural behaviour and to better predict the remaining lifetime. The presented paper provides a short insight into the potentiality of structural health monitoring using wireless sensor networks, which is under development at the Institute of Construction Materials. Such monitoring systems are easy to install and inexpensive, that enlarges its application. ZUSAMMENFASSUNG Dem Bauwerksmonitoring, das heißt der fortlaufenden Überwachung von Bauwerken mittels geeigneter Technologien, kommt insbesondere im Zusammenhang mit einem zunehmenden Alter von Bauwerken wie auch ansteigender Anforderungen an Tragfähigkeit und Dauerhaftigkeit eine immer größere Bedeutung zu. Bisher wird an einzelnen ausgewählten Bauwerken bereits eine 77
Otto-Graf-Journal Vol. 15, 2004
M. KRÜGER, C.U. GROßE
Vielzahl von charakteristischen Kennwerten mit konventioneller Sensorik erfasst und ausgewertet. Zu diesen Kennwerten gehören beispielsweise die Luftund Bauteiltemperatur und -feuchte oder Bauteildehnungen, -verschiebungen und -schwingungen. Eine Modal- und Schallemissionsanalyse kann für die Charakterisierung des Bauwerkszustandes herangezogen werden. Zukünftig sollen durch zerstörungsfreie Prüfmethoden ermittelte Kennwerte dazu beitragen, genauere Aussagen über die Veränderungen des Tragwerks und die Restlebensdauer zuzulassen. Der vorliegende Beitrag gibt einen Einblick in neue Monitoringtechnologien mit drahtlosen Sensornetzwerken, die momentan am IWB entwickelt werden. Derartige Monitoringsysteme sind gegenüber konventionellen Messsystemen einfacher zu applizieren und deutlich kostengünstiger, was eine breitere Anwendung in der Praxis ermöglicht. RESUMÉ Une gande nombre des qualités characteristiques des constructions uniques sont enregistrée avec d´apparaillage conventionelle. Ce sont par example la temperature d´air, la temperature de la construction, l´humidité, l´élongation et la déplacement d´une structure et les vibrations. Une analyse modale ou une analyse d´emission acoustique peut être faite. Dans l´avenir les qualités qui sont enregistrés par des methodes non-destructives contribueront à prédire des changements de l´état d´ouvrage d´art et la durée de vie restante. La contribution suivante donne un aperçu de la technologie de la systèmes sans fil. Ces systèmes sont faciles à appliquer et côutes moins que les systèmes conventionels. KEYWORDS:
Structural health monitoring, wireless sensor networks, wireless communication, MEMS, low power sensors
INTRODUCTION The demand for non-destructive test methods and monitoring techniques increases rapidly in Europe. For maintenance purposes it is more and more recommended not only to inspect building structures like bridges at certain time intervals. Moreover there is the demand for continuous monitoring techniques. This problem becomes very important at railway bridges. In this context a Euro78
Structural Health Monitoring with Wireless Sensor Networks
pean Research Project was approved in the Sixth Framework Programme, where the Institute of Construction Materials is involved in among others [1]. Several recent damages on bridges have lead to the installation of wired monitoring systems to analyse the structural behaviour and the deterioration processes. However, such monitoring systems use standard sensor technologies and several other devices which are time consuming to install and expensive. For example one force balanced acceleration sensor for modal analysis costs about 3000 to 5000 Euros and data acquisition and cabling for each sensor about 1000 to 2000 Euros. That means that conventional monitoring systems consisting of a larger amount of sensors are high-priced expensive and therefore will be installed on a few bridges only. A wireless monitoring system with MEMS sensors could reduce these costs dramatically. Microelectromechanical systems (MEMS) are small integrated devices or systems that combine electrical and mechanical components that could be produced at much less than 50 Euro each. A wireless sensor mote with such a MEMS sensor could then be fabricated at a price varying from 100 to about 400 Euro each. As a result the use of monitoring systems equipped with MEMS sensors and wireless communication could enormously decrease the costs to only a small percentage of a conventional monitoring system and therefore will increase its application not only in monitoring bridges.
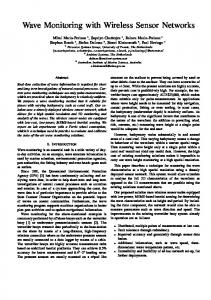
MEMS
wireless RF data transmission
Fig. 1: Diagram of wireless sensing of large structures using radio frequency transmission technique [2]
79
Otto-Graf-Journal Vol. 15, 2004
M. KRÜGER, C.U. GROßE
However, if a larger amount of bridges are equipped with a wireless monitoring system, the demand for its visual inspection decreases as well and due to the detailed information of the structural behaviour of bridges obtained from the monitoring system, maintenance costs could be reduced. Only if certain changes in the structural behaviour are recognised and damages will become obvious, a repair is necessary. This repair could be done right after the occurrence of the defect what reduces the risk of consequential damage. The analysis of the measured data and the knowledge of the continuous changes of structural behaviour will also improve the lifetime prognosis of the building structure. This especially could reduce the overall maintenance costs of buildings and transport networks. LAYOUT OF A WIRELESS MONITORING SYSTEM A wireless monitoring system consists of several different components that will be described in the following (see Fig. 2). A monitoring system should provide relevant data from the observed structure without the requirement to inspect it. So the data has to be transmitted in a sufficient way to the user, e.g. through the internet. The sensor motes have to be power and cost optimized so they can provide data only at small distances. For that reason there is the demand to install a central processing unit on site in addition to the installation of the sensor motes. This central unit has to collect, to store the data in a database and further to analyse the data from the sensor motes until this data is requested by the user or until a sudden event is detected which results in an alarm message. The central unit also should allow a calibration and a wireless reprogramming of the sensor nodes to keep the whole system flexible. The central unit could be a conventional personal computer equipped with a constant power supply and specific hard- and software. Mote
Monitoring System (on site) Relevant data (alarm)
Mote Central Unit Mote Mote
Fig 2: Schematic diagram of a wireless monitoring system
80
Control (off side) User
Structural Health Monitoring with Wireless Sensor Networks
THE SENSOR MOTE The sensor motes are the main components of a wireless monitoring system. There are different tasks a sensor mote has to perform, which are to collect and digitize data from different sensors, to store sensor data, to analyse data with simple algorithms, to send and receive selective and relevant data to and from other nodes as well as the central unit and to work for an adequate time period without a wired power supply. Therefore a sensor mote consists of a CPU or DSP with sufficient memory, a low power radio, an aligned analog to digital conversion module (ADC), a power supply and one or more diverse sensors. Sensor Sensor
ADC
Power Supply
CPU (DSP)
Low Power Radio
RAM
Fig. 3: Schematic layout of a sensor mote and prototype (©Smartmote)
Power consumption and power supply A monitoring system is supposed to work for a longer period that means for several month or years. A detailed bridge inspection will take place at an interval of three or six years in Germany for example. It is therefore desired, that the lifetime of the monitoring system is also three years at least. Power consumption of the mote smaller than 2 mW is recommended and in order to achieve a maximum lifetime an effective power supply has to be chosen. An important aspect in designing and in programming a sensor node is to minimize its overall power consumption [3]. As a first step it is recommended to look for an optimized hardware. There are a lot of power consuming components like the sensors, the A/D-conversion-module, the radio module, the sensor-CPU, and the memory which require energy to work properly (see table 1). If low power consumption is considered it is suggested to limit the voltage range of these components to a maximum value of 5 Volt or better of about 3 Volt or even lower. In a next step it is recommended that the system components operate in sleep or power down mode as often as possible. These modes require only little 81
Otto-Graf-Journal Vol. 15, 2004
M. KRÜGER, C.U. GROßE
energy. Most of the used radio modules and processors support such power saving modes. Some of the devices could also be switched off if not needed. For this reason a monitoring system has to provide different event handling and wake up modes. Hard- and software has to be optimized in this way. At this juncture the wake up time itself could be of importance. Especially if the measurement task is acoustic emission analysis a very fast wake up time of a few µs is required for some of the components. For example a localisation of an acoustic event in a concrete structure with an accuracy of about 0.25 m needs accuracy in the signal onset detection of about 60 µs [2] [4]. However, such a fast wake up time could be provided only by a few commercially available components up to now. That means that further developments are necessary. Table 1: Average energy required for different components (at 3V) Component
Sleep mode
Full operation
8bit-Processor @20MHz
24 µW
24 mW
Memory
6 µW
45 mW (writing) 12 mW (reading)
6 µW
Radio module (RF)
24 mW (receiving) 36 mW (transmitting)
Signal conditioning and A/D-conversion -
0.6 to 2 mW
Acceleration 2kHz, 12 bit
15 µW
6 to 15 mW
Humidity & Temperature
1 µW
1.5 mW
100kHz, 12 bit MEMS-Sensors
Another high power consuming part is represented by the sampling rate and the amount of handled data, e.g. high sampling rates and high amplitude resolution result in high power consumption. In fact power consumption of temperature or humidity measurements is not a problem. Moreover it becomes of interest to monitor dynamic behaviour or uses acoustic emission techniques with high sampling rates. Nowadays battery powered systems, e.g. equipped with Lithium-batteries, are most appropriate. However, power supplies like solar cells, methanol powered fuel cells are alternatives. Ongoing research is made in the field of energy harvesting, for example for cellular phones. Therefore it is not the intention of this paper to review problems concerning power supplies. 82
Structural Health Monitoring with Wireless Sensor Networks
Wireless communication It is suggested that for most monitoring tasks a communication range of 10 to 30 m is sufficient. There are some communication standards like WLAN (IEEE802.11, wireless local area network) and BluetoothTM that are well known and feature such ranges. WLAN describes a family of specifications for wireless local area networks and offers high data rates up to 54 Mbps at distances of up to a hundred meters and is low power consuming if one looks at the energy consumed per transferred bit (see table 2). However the IEEE802.11 standard does not feature power management. If only a few data bits have to be transmitted, IEEE802.11 need much more power and becomes inefficient. BluetoothTM offers up to 1 Mbps to a maximum distance of about ten meter and is equipped with several power saving mechanisms. BluetoothTM works with frequency hopping to eliminate interfering signals and uses a complex protocol stack that needs system memory of about 200 Kbytes [5]. However, BluetoothTM is optimized for widespread applications and for a larger amount of data so a lot of different functions are embedded. There are some new developments like ZigbeeTM (IEEE802.15.4), which work with fully handshaked protocols for transfer reliability and also permit power management to ensure low power consumption. Advantageous is the much smaller protocol stack of 4 to 32 Kbytes than that of BluetoothTM. The ZigbeeTM standard is optimized for intermittent data transfer so the overall power consumption is low if only few data have to be transmitted in between a longer time period. To further reduce the power consumption several working groups have developed their own proprietary RF communication devices using low power radio transceiver in the free ISM frequency bands. Such a proprietary RF solution is the broadband nanoNET radio communication which works in the 2.4 GHz range and uses CSS (Chirp Spread Spectrum) functionality [6]. The nanoNET technology has a small protocol stack and offers higher data transfer rates and higher reliability than the ZigbeeTM standard but requires less energy [7]. However, this technique is still under development right now. Also other communication techniques are still under investigation like ultrasonic or optical methods, but these methods are described elsewhere [7].
83
Otto-Graf-Journal Vol. 15, 2004
M. KRÜGER, C.U. GROßE
Table 2: Average energy required per transmitted bit and maximum data transfer rate Communication standard
12 m distance
30 m distance
Max. Transfer rate
IEEE 802.11b (WLAN)
200 nJ/bit
300 nJ/bit
11 Mbps
Bluetooth
2.5 µJ/bit
-
0.8 Mbps
ZigbeeTM
7 µJ/bit
7 µJ/bit
20 to 250 kbps
Home-RF (example)
1 µJ/bit
2 µJ/bit
0.8 to 2 Mbps
nanoNET (CSS)
60 nJ/bit
80 nJ/bit
2 Mbps
TM
With regard to the power consumption of the different communication methods for saving energy it is suggested to send relevant data to other sensor nodes or the central unit only, because signal processing in the sensor node needs less power than sending it through the radio module. Data acquisition and data aggregation Before data processing start they must be converted from analogue to digital. This is done by an A/D-conversion-module. Due to the power consumption the sampling rate and the amplitude resolution has to be customized for the measuring task. As shown above it is recommended to minimize the data transfer through the radio module which means that signal processing and data analysis should be done in the sensor mote as far as possible. The signal analysis could be made by software or by special hardware, e.g. Baas [8] has built a fast Fourier transform (FFT) implemented directly into hardware that can perform a 1024-point FFT at 3.1 µJ using a 1.1 V supply. Only relevant sensor data should be transmitted to other motes or the central unit, e.g. maximum or minimum values. This is also in general needed to minimize the data traffic that is of interest if the monitoring system consists of a high amount of motes. Due to interference by other electro-magnetic fields the data transfer could be disturbed and data are lost. For reliability reasons data transfer redundancy is required under certain circumstances. One solution is the storage of a set of data in the sensor mote sending it consecutively through the radio module at specific time intervals, events or on request.
84
Structural Health Monitoring with Wireless Sensor Networks
Robustness and Reliability The whole monitoring system, which has to be installed on site, has to withstand rough climate and other conditions (see table 3). For example it has to be resistant against oil, fuel, salt and alkali. The sensors have to be robust and durable such that their measured data is reproducible and reliable over the monitoring period. Furthermore the system stability, which includes the wireless data transfer to and from the sensor nodes, should be high. Table 3: System specifications
Temperature Relative humidity Shock
Unit
Range
°C % G
-30 ÷ 80 10 ÷ 100 1000
MEASUREMENT PROGRESS Structural health monitoring implies a continuous measurement of several values over a long period of time. Thus continuous or rather discrete monitoring has to be more specified. For example it is not feasible to measure humidity or temperature every second or minute and a continuous monitoring of acoustic events at high sampling rates is not appropriate due to the large amount of data. It is therefore necessary to divide monitoring into discrete and event based monitoring, which is similar to data aggregation on request or on the other hand event based data aggregation. Discrete monitoring Discrete Monitoring is a question of the time interval between two measurements. A time signal triggers the measurement progress and is therefore some kind of an event. However, time based monitoring is different from event based monitoring because time is a global value and not specific data of the observed object. To reduce the amount of data it is recommended to choose time intervals for measurements like they are listed in table 4 for example.
85
Otto-Graf-Journal Vol. 15, 2004
M. KRÜGER, C.U. GROßE
Table 4: Measurement intervals with respect to discrete monitoring Measured Values
Unit
Time interval
Temperature
Hours
1 to 24
Relative humidity
Hours
1 to 24
Hours (Days)
1 to 24 (1 to 365)
Corrosion
Month
Any
Chemical Attack
Month
Any
pH-value
Month
Any
Temperature induced strain, stress or displacement
Event based monitoring Event based monitoring is useful if temporary loads or other effects influence the structure, e.g. trains, trucks, wind, snow or rain, earthquakes or structural failure itself. That means that an object specific event triggers the measurement progress. Some of these special events are listed in table 5. If an event based monitoring is chosen, it has to be considered that every measured value has to get its time stamp, because in this connexion time is a value to be measured. Table 5: Aspects of interest caused by special events Aspects of interest
Caused by (Event)
Measured Values
Temperature change
Climate
Temperature
Change in relative humidity
Climate
Humidity
Rupture of steel tendons Concrete cracking Fatigue of steel connections
e.g. corrosion, temperature, static or dynamic loads
Acoustic events Change in stress, strain or displacement Change of dynamic behaviour
Maximum/medium/minimum e.g. climate, loads, wind absolute strain, stress or displacement
Stress, strain or displacement
Structural behaviour due to dynamic loads
e.g. special train, wind or earthquakes
Acceleration, Eigenmodes
Structural behaviour due to static loads
e.g. special load
Stress, strain or displacement
any (e.g. corrosion, earthquakes, accidents)
any
Structural failure
86
Structural Health Monitoring with Wireless Sensor Networks
Sensors for wireless monitoring To achieve a long working time of the sensing unit passive sensors seem to be the best choice. They do not require electric power, because they obtain their energy directly from the change of physical values. For example piezoelectric materials are such materials. But also active sensors could be of interest. Active sensors are defined as sensors which necessitate electric power to work properly. MEMS sensors are active sensors for instance. Most of the MEMS sensors are featured with an integrated signal conditioning, sufficient A/D-Converter and/or power down features and therefore require certain electric power. It could be of advantage if an A/D-Converter is integrated into the sensor, because it is often optimized for the measuring task as well as for low power. Some MEMS have also integrated temperature compensation. Furthermore, most of the MEMS are equipped with an event handler so a fast wake up of the system is guaranteed if an ascertain trigger is reached and the MEMS are in idle or sleep mode. However, in some cases like for acoustic emission analysis the wake up time of the commercially available MEMS is so long that important signal data is lost. The temperature and the moisture of the air and of the structure are general values, which are relevant for almost all measurement tasks. There are a lot of commercial standard and also MEMS-based sensors available which might fit the requirements. A MEMS sensor embedded into a concrete structure is shown in Fig. 4. Cavity MEMS sensor
Concrete Borehole ∅16mm (filled with mortar)
Fig. 4: Prototype of a wireless mote with connected moisture and temperature sensor
Concerning modal analysis the required specifications strongly depend on the type of monitored structure. Mainly bridges or towers are of interest. For very stiff structures like concrete bridges a bandwidth of 0.1 to 20 Hz is of im87
Otto-Graf-Journal Vol. 15, 2004
M. KRÜGER, C.U. GROßE
portance. If only structural parts like steel beams or steel cables are analyzed, the Eigenmodes are in a higher frequency range and the interesting bandwidth will be up to 500 Hz in some cases. Acceleration, velocity and the sensitivity depends on these frequencies so the use of one sensor for all the purposes is not appropriate. If an acoustic emission analysis is considered one has to distinguish between laboratory tests and monitoring on site. Due to power considerations high sampling rates greater than 100 kilo samples per second are not recommended for wireless monitoring on site, so one has to look for a compromise. It is therefore not needed to use sensors with very high frequencies. Broadband transducers with a band width of 3 to 100 kHz seem to be appropriate. However, the needed sensitivity strongly depends on the application and the energy content of the monitored events respectively. MEMS based capacitive sensors as well as conventional piezoelectric sensors could be used for wireless monitoring. Nevertheless the sampling rate and the amplitude resolution and not of the type of the used sensor is of main influence for the power consumption. A high amount of strain gauges are in practical use to measure strain and also stress under static or dynamic loads. The current of strain gauges is small and therefore power consumption is only of a few mW, so that strain gauges could be used with wireless motes, too. In most applications stress is calculated indirectly from the measured strain. However, creep of the strain gauges and of the used adhesives to apply them to the structure is still a problem if one will measure for long time periods. Temperature compensation has to be done with all gauges. But due to available proper compensation methods this is not a real problem. Instead of strain gauges also LVDT could be used to measure displacement and thus indirectly strain. On the other hand a LVDT is much more expensive than a strain gauge. For force measurement commercial pressure cells as well as low power MEMS pressure sensors could be installed. CONCLUSIONS Wireless sensor networks using MEMS technologies could enormously reduce the costs for structural health monitoring to just a few percentage of a conventional cabled monitoring system. This will increase its application and thus more detailed information could be obtained from the structural behavior as well as the actual condition of the building structure. This will enable engineers to 88
Structural Health Monitoring with Wireless Sensor Networks
use more precisely information for the structure analysis and repair as well as life time prediction. For that reason first prototypes of wireless monitoring systems were developed. Still a lot of work has to be done. The next steps are to look for efficient data reduction methods as well as for sufficient algorithms for signal analysis, so that the great amount of measured data is reduced to only a few relevant data. Then structural health monitoring will be intrinsically efficient. REFERENCES [1] Sustainable Bridges – Assessment for Future Traffic Demands and Longer Lives: Integrated Project in the Sixth Framework Programme on Research, Technological Development and Demonstration, FP6-PLT-001653, http://www.sustainablebridges.net [2] Grosse, C.U., Finck, F., Kurz, J., Reinhardt, H.-W.: Monitoring techniques based on wireless AE sensors for large structures in civil engineering. Proc. EWGAE 2004 symposium in Berlin, DGZfP: Berlin, BB90 (2004), pp 843856. [3] Doherty, L., Warneke, B.A., Boser, B., Pister, K.S.J.: Energy and Performance Considerations for Smart Dust. International Journal of Parallel and Distributed Sensor Networks, Dec 2001. [4] Grosse, C.U.: Monitoring of large structures using acoustic emission techniques. Symposium "Niet-destructief onderzoek in de bouwsector", Proceedings, Antwerpen, 23.10.2003, pp 15-24. [5] Mackensen, E., Kuntz, W.: Intelligente, autarke Mikrosysteme für drahtlose Sensor-Aktor-Netzwerke VDI/VDE-Gesellschaft (Hrsg.): Sensoren und Messsysteme 2004, VDI-Berichte 1829, Düsseldorf, 2004. [6] Nanotron Technologies GmbH: nanoNET Chirp-based wireless network. nanoNET White Paper, Version 1.0. [7] Mackensen, E., Kuntz, W., Müller, C.: Smart Wireless Autonomous Microsystems (SWAMs). Proceeding of the Sensors For Industry Conference, New Orleans, USA, 2004. [8] Baas, B.M.: A low power, high-performance, 1024-point FFT processor. IEEE J. Solid-State Circuits, 34(3), 1999, p. 380-387.
89
Otto-Graf-Journal Vol. 15, 2004
M. KRÜGER, C.U. GROßE
90