deploying networked sensors on the sea surface, monitoring the sea depth, temperature .... extend the original sensor radio with an external antenna which significantly improves ... now available on our data center website [1]. III. SEA DEPTH ...
OceanSense: Monitoring the Sea with Wireless Sensor Networks Kebin Liu†,
Zheng Yang†, Mo Li†, Xiaohui Yang‡,
Zhongwen Guo‡,
Yuan He†, Yuan Feng‡,
†Hong Kong University of Science and Technology Abstract—Wireless sensor networks enable large amount of surveillance applications especially for critical and even hostile environments, for example, the sea monitoring. In OceanSense, we make the pioneer attempt to explore the possibility of deploying networked sensors on the sea surface, monitoring the sea depth, temperature, as well as other valuable environmental parameters. Sea depth monitoring is a critical task to ensure the safe operation of harbors. Traditional schemes largely rely on labor-intensive work and expensive hardware. We present a new solution for measuring the sea depth with Restricted Floating Sensors. Data without location is meaningless, to address the problem of node localization on the critical sea environment, we propose Perpendicular Intersection (PI), a novel mobile-assisted localization scheme. Network diagnosis is of great importance for an operational sensor networks, in OceanSense project, we propose the concept of passive diagnosis as well as the PAD approach which is both light-weight and adaptive to network dynamics. The OceanSense system has been working for over 16 months and provides large amounts of valuable data of the sea environment. Keywords-component; OceanSense; wireless sensor networks; environment surveillance;
I. MOTIVATION Wireless sensor networks (WSNs) typically consist of a large number of resource limited sensor nodes working in a self-organizing and distributed manner. They have great potential in various applications such as environment surveillance, scientific observation, battle field monitoring, and the like. WSNs are urged especially for tasks under the critical or even hostile environments, for example, the sea monitoring. Our OceanSense [2] project is originally motivated by our field study in H. H. Harbor, which is currently the second largest harbor for coal transportation in China. It develops rapidly over the past 5 years, and its transporting capability has increased from 1.6 million tons per year in 2002 to 6.7 million tons per year in 2006. Nevertheless, this harbor currently suffers from the increasingly severe problem of silt deposition along its sea route. H. H. Harbor has a sea route of 19 nautical miles long and 800m wide at the entrance, including an inner route and an outer route. The sea route has a water depth of 13.5m and thus allows for the passage of ships weighing over 50 thousand tons. As the sea route has been in operation, it has always been threatened by the movement of silt from the
Ying Guo‡,
Feng Hong‡,
Yunhao Liu† ‡Ocean University of China
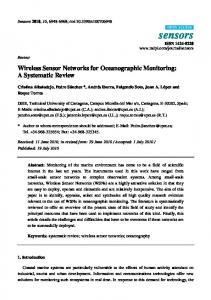
Figure 1. The H. H. Harbor and waiting ship
shallow sea area within 14 nautical miles outside the route entrance. In the event that the sea route is silted up, ships of large tonnages must wait for entering the harbor to prevent grounding, and ships of small tonnages need be piloted into the harbor. Monitoring the extent of siltation reliably is critical for ensuring the safe operation of the harbor. Figure 1 lists some snapshots we take from the H. H. Harbor and the central picture illustrates the waiting ships outside the harbor. The uncertainty and the high instant intensity of the siltation make monitoring the extent of siltation extremely expensive and difficult. The amount of siltation in H. H. Harbor is affected by many factors, among which tide and wind blow are the most dominating. While the tides produce a periodic influence on the movement of silt, the highly variable nature of wind brings more incidental and intensive effects. For example, records show that strong winds with wind forces of 9 to 10 on the Beaufort scale hit H. H. Harbor from Oct. 10th to Oct. 13th in 2003. The storm surge brought 970,000m3 of silt to the sea route, which suddenly decreased the water depth from 9.5m to 5.7m and blocked most of the ships weighing more than 35 thousand tons. In order to address the siltation problem, currently the harbor administration hires three boats equipped with active sonars to cruise the 380km2 shallow sea area around the harbor. Monitoring sea depth costs this harbor more than 18 million US dollars per year. We make the pioneer attempt to explore the possibility of deploying networked sensors on the sea surface for sea depth measurement which can cut down more than 95% of the money. Besides sea depth, our OceanSense project also takes into
Figure 2. The campus experiment
account other useful environmental parameters such as the temperature, light luminance, and so on. It is extremely difficult and expensive to chronically obtain these data on sea surface by labor efforts. Leveraging a wireless sensor network, we can achieve continuous surveillance on the sea area. The rest of the paper is organized as follows. Section II briefly introduces our OceanSense project, including the hardware encapsulation, protocol design, deployment experiences, and the like. Section III presents our sea depth measurement solution with the floating sensors. Section IV discusses how to accurately localize the sensor nodes on sea surface and the network management and fault diagnosis issues are presented in Section V. II.
OCEANSENSE PROJECT
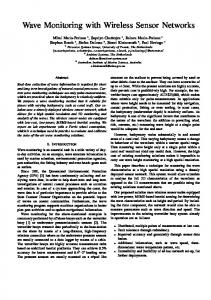
OceanSense aims to build an integrated sensor network system for environment surveillance on the sea. The focus of this work is to acquire and analyze information about environment factors such as sea depth, temperature, light luminance, etc. Current methods are mostly labour-intensive and the data collection lacks both the density and consistency of samplings. By deploying a wireless sensor network, we are able to achieve continuous surveillance on the sea environment. Different with traditional land-based sensor networks, most of which apply stationary sensor nodes, the sensor network deployed on the sea consists of Restricted Floating Sensors (RFS), anchored to the sea bottom, floating within a restricted area on the sea surface. The complex impacts brought by the wind blow, tides as well as ocean currency affect our system architecture, algorithm design and sensor node manufacture. In the first stage, we launch a prototype system off the seashore in HKUST campus. We fit each node with a lightweight supporting shelf, which floats on the sea surface and raises the sensor node 150cm high above the sea surface. Figure 2 shows the shelf and our experiment area in campus. In the second stage, we deploy the working system in Tsingtao, China. We use TelosB motes and TinyOS as our development basis. Current system consists of 25 sensor nodes deployed in the field, reporting sensing data continuously to the base station. The complete system is designed to scale to hundreds of sensors covering the sea area off Taipingjiao, Tsingtao. In order to deal with the critical conditions on sea, we improve our encapsulations. As shown in Fig.3 (a) and (b), we apply a sealed bottle to maintain our sensor node and a long
Figure 3. Encapsulation of sensor nodes
metal pillar to raise the sensor node. Three plastic foams are leveraged to keep the entire equipment floating on the sea surface. Considering the severe interferences on the sea, we extend the original sensor radio with an external antenna which significantly improves the communication quality. Figure 3 (c) illustrates a snapshot of our node manufacture and Fig.3 (d) shows the anchor for fixing the sensor floating in a restricted area. The encapsulated products are shown in Fig.3 (e). This system has been working for over 16 months and provides large amounts data including the sea depth information, temperature on the sea, and the like. The data is now available on our data center website [1]. III.
SEA DEPTH MEASUREMENT
In this section, we briefly describe our sea depth measurement approach with the OceanSense system. Different from deployments on ground, sensor nodes, in this scenario, will generally not be stationary at their original deployed places, but float by many factors, e.g. ocean current, wind blow, and tide etc. Therefore, we anchor the sensor nodes to the sea bottom by ropes to restrict their floating movements. We call them the Restricted Floating Sensors (RFS) [5]. Figure 4 illustrates a RFS network deployed in a sea area. As shown, different sea depths result in different sizes of floating areas. The key issue in this design is determining the floating area of each sensor. Traditional localization approaches for stationary sensors does not consider sensor mobility. On the other hand, simply treating the RFS network as a mobile sensor network and blindly applying those localization approaches for mobile WSNs does not capture the special nature of the RFS network. By understanding RFS mobility behaviors, we can carry out localization with high accuracy and reduced overhead. By measuring multiple samples of distances between a pair of neighboring sensors, the floating areas of sensors can be figured out through linear regression. Accordingly, the sea depth can be inferred as follows. When we use a rope with length L to anchor the sensor node on the sea of depth h (L > h), the sensor node floats within the disk area of radius r = L2 − h 2 , as shown in Figure 4. After localization, we obtain the floating area of a node, achieving its center c as well as its radius r. We can then easily calculate the sea depth at position c. This calculation involves neither extra measurements nor hardware costs. In some cases, the gravity of ropes cannot be ignored. When sensor nodes are on the boundaries of their floating areas, ropes cannot be straight but form a curve with steep upper part and mild lower part. In this
Sea surface
r rope
h L
Figure 6. Framework of PAD approach
anchor sea bed
Figure 4. Sea depth monitoring with Restricted Floating Sensors
situation, the see depth can be computed according to the equation of catenary. IV.
SENSOR NODES LOCALIZATION
Data with location is meaningless, as sensor nodes are deployed in the wild environments, accurately determining their locations is of great significance. Routine localization methods like GPS are not feasible for the cheap and resource constrained sensor nodes, so large amounts of research efforts have been devoted to this topic. Nevertheless, most of these approaches are range-based that rely on measuring the ranges between different nodes. The ranging processes are achieved by mapping metrics like RSSI to physical distances according to some attenuation models. These approaches work well in traditional land-based sensor networks but suffer from the environment interferences on signal attenuation process in the sea area. To address these issues, in our OceanSense project, we propose a novel mobile-assisted localization scheme called Perpendicular Intersection (PI) [3]. Instead of directly mapping RSSI values into physical distances, by contrasting RSSI values from the mobile beacon to a sensor node, PI utilizes the geometric relationship of perpendicular intersection to compute node positions. Mobile beacon
(x3, y3)
(x1, y1) Sensor nodes
(x, y)
Deployment area
(x’’, y’’) (x’, y’)
σ
that is, node (x, y) has the local minimum distances to mobile sink at these two positions. As the virtual rectangle as well as the coordinates of positions (x’, y’) and (x’’, y’’) are known, the (x, y) can be calculated through the geometric relationships. Both the analytical and experimental results demonstrate that PI is superior to existing approaches with higher precision. V.
During our deployment, we experience many troubles such as the rapid energy depletion of the sensor nodes, high delivery delay and packet loss. To address these issues, efficient network diagnosis tools are urged. Due to the ad hoc working style, once deployed, the inner structures and interactions within a WSN are difficult to observe from the outside. Existing works for diagnosing WSNs mainly rely on proactive approaches, which incur high traffic overhead to the resource constraint WSNs. These methods are sensitive to the loss of status information as well. To address these issues, we propose the concept of passive diagnosis. We report in this research our initial attempt at providing a light-weight network diagnosis mechanism for sensor networks. We present PAD [4], a probabilistic diagnosis approach for inferring the root causes of abnormal phenomena. Figure 6 shows the framework of the PAD design which consists of four components: a packet marking module, a mark parsing module, a probabilistic inference model, and an inference engine. PAD implants a tiny light-weight probe into each sensor node that sporadically marks routine application packets passing by, so that the sink can reassemble a big picture of the network conditions from those small clues. Our approach does not incur additional traffic overhead for collecting desired information. Instead, we introduce a probabilistic inference model which encodes internal dependencies among different network elements. Such a model is capable of additively reasoning root causes based on passively observed symptoms. We implement the PAD design in our OceanSense project and validate its effectiveness. REFERENCE
(x2, y2)
Figure 5. An example of PI
Figure 5 show the process of PI with an example. A mobile beacon traverses the region while broadcasting beacon packets periodically. It starts at point (x1, y1), turns its direction at point (x2, y2), and stops at point (x3, y3). The trajectories of the mobile beacon form a virtual triangle. Assume that we want to localize the sensor node at position (x, y), in which x and y are unknown. The sensor node receives and records the RSSI values of the beacon packets as the mobile beacon moves. As shown in Fig.5, when mobile beacon is at position (x’, y’) and (x’’, y’’), the recorded RSSI values achieve local maximum,
PASSIVE DIAGNOSIS FOR SENSOR NETWORKS
[1] [2] [3]
[4] [5]
"OceanSense data center," http://osn.ouc.edu.cn/SensorData/query.jsp "OceanSense: Sensor Network for Sea Monitoring," http://www.cse.ust.hk/~liu/Ocean/index.html Z. Guo, Y. Guo, F. Hong, X. Yang, Y. He, and Y. Liu, "Perpendicular Intersection: Locating Wireless Sensors with Mobile Beacon," In Proc. of IEEE RTSS, 2008. K. Liu, M. Li, Y. Liu, M. Li, Z. Guo, and F. Hong, "Passive Diagnosis for Wireless Sensor Networks," In Proc. of ACM SenSys, 2008. Z. Yang, M. Li, and Y. Liu, "Sea Depth Measurement with Restricted Floating Sensors," In Proc. of IEEE RTSS, 2007.