MONITORING HOMES WITH WIRELESS SENSOR NETWORKS C.H.S. Gibson1, T. van Kasteren2, B. Kröse1,2 1
Professional University of Amsterdam, NL; 2Universiteit van Amsterdam, NL
[email protected]
Abstract:This paper describes a prototype system for matching data provided by a wireless network of autonomous reed switch devices with activities of daily living in a home environment. Introduction Wireless sensor networks (WSNs) are a relatively recent development in the world of information technology. The possibility of using these systems to monitor movements and activities of people in buildings led our research team at the Digital Life Centre in Almere to investigate the application of the technology to monitoring activities of daily living (ADLs) in homes for the elderly. For many years the need for nursing care has been measured by a person’s performance of a list of six basic ADLs [1]. Research [2] has already indicated that through monitoring ADLs and detecting changing patterns in the performance of ADLs it will be possible to help care institutions to direct their care where it is most urgently needed. This is turn will support the ultimate goal of promoting aging in place. The application of WSNs for monitoring ADLs has been tried previously in different configurations. In a laboratory experiment [3] at the Massachusetts Institute of Technology several ADLs were recognized with varying degrees of accuracy. Our work in this project is distinguished by the adoption of a minimal system installed in a ground floor apartment of a complex attached to a nursing home. Testing the application of the technology in a real-life home environment allowed us to examine the degree to which residents are likely to accept this form of surveillance. The resident - a cooperative elderly female subject - was very conscious of the fact that her movements and activities were continually being monitored by the system. She also told us quite emphatically that in her opinion none of the residents of the complex would be prepared to accept a more intrusive system involving tagging or
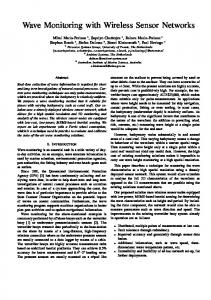
camera supervision. Fortunately in a home environment with a single resident, personal identification of the individual is not required. Our project charter, agreed with the nursing home director, was to install a non-intrusive WSN in order to monitor the ADLs of the resident. The aim of the project was to answer the question: “to what extent is it possible to monitor ADLs using an aggregation of simple switch signals generated by a non-intrusive wireless sensor network with nodes spatially located throughout residences for the elderly?”. Network description In order to prepare the network hardware we connected each field node to a sensor by soldering a wire to an I/O port on the circuit board. In addition to 13 reed switch sensors, additional sensors were also included in the network setup: an immersion sensor for placement in the toilet cistern to detect flushing, 2 temperature sensors and an humidity sensor. The assembled nodes were then installed in the apartment as shown in the following layout diagram.
The field nodes were fitted in the apartment using double sided sticking tape in order to avoid any damage to the building. In order to label the data, we drew up a check list of activities which was annotated by the resident on a daily basis with the times the activities took place. Finally a small program was coded and installed on the server in order to read the sensor impulses
together with their time stamps and to store the data in a MySQL database for further processing. SERVER 433,92 Mhz RF COMM
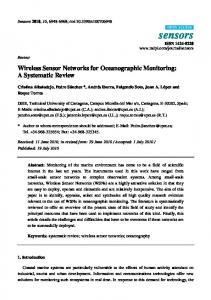
Classification To determine to what extent the sensor data can be automatically interpreted we ran several experiments. We used a Hidden Markov Model (HMM) to model the correlations between sensor readings and activities. The expectation maximization (EM) algorithm was used to automatically train the parameters of our model from the sensor data. Both the HMM and the EM algorithm are well understood techniques in the field of machine learning [4]. The application of these techniques can be best understood as a form of clustering. Sensors that often fire together are identified as a cluster, which can be interpreted as an activity taking place. For example, the toilet door sensor and toilet flush sensor are likely to fire one after the other. These two sensors could be identified as a cluster which could be interpreted as toileting. Having learned the parameters for each cluster, we can apply the model to determine at which time which cluster is recognized. For our data the best fit was obtained using four clusters (fig. 1). These clusters can be interpreted as toileting, leaving the house, feeding the neighbourhood cat and being idle. Comparing recognized data with the annotation allows us to calculate a precision and recall score (table 1). Precision is the percentage of correctly recognized activities out of all recognized activities. While, recall
is the percentage of correctly recognized activities out of all annotated activities. The activities of feeding the cat and being idle are excluded from the table because they were not annotated. Our algorithm successfully recognizes toileting, however, it recognized many more instances of toileting than annotated. This is because our subject did not very accurately label her toileting activity. Leaving the house is also recognized well, although some instances were missed because the subject left the house through the back door, which was not part of this cluster. This brings us to the disadvantages of our clustering approach. The algorithm finds clusters which fit the data best. However, this is not necessarily an event we are interested in. Also if activities can be performed in multiple ways (e.g. leave the house through the front and back door) these are likely to form two separate clusters. Our future work will involve ways to incorporate common sense information about activities which will steer the clustering process and should solve these issues. Table 1: Activity recognition
Activity
Precision
Recall
Toilet
13%
100%
Leave
37%
74%
Figure 1: Probability of data against number of clusters
Acknowledgement This project is partially funded by SIA-RAAK and Centre for Intelligent Observation Systems (CIOS).
References [1] [2] [3] [4]
Katz et al, “Studies of Illness in the Aged”, Journal of the American Medical Association, September 1963 M.Wallace, “Best practices in nursing care to older adults” in Try This, issue no. 2, Hartford Institute for Geriatric Nursing, 2007 D. Wilson, “Assistive intelligent environments for automatic health monitoring”, Carnegie Mellon University, pp. 80 – 88, 2005 L.R. Rabiner, “A tutorial on hidden Markov models and selected applications in speech recognition”, Proceedings of the IEEE, 1989, 77, 257-286