SECURITY CLASSIFICATION OF: 17. LIMITATION ..... the 3D point cloud developed after site construction in 2013 from approximately 10 ..... Photographic Strategies : Camera Orientation, below for a tip on calibration improvement). Camera ...
Whitepaper on Structure from Motion (SfM) Photogrammetry: Constructing Three Dimensional Models from Photography Research and Development Office Science and Technology Program Final Report ST-2015-3835-1
U.S. Department of the Interior Bureau of Reclamation Research and Development Office
October 2015
Mission Statements The U.S. Department of the Interior protects America’s natural resources and heritage, honors our cultures and tribal communities, and supplies the energy to power our future.
The mission of the Bureau of Reclamation is to manage, develop, and protect water and related resources in an environmentally and economically sound manner in the interest of the American public.
REPORT DOCUMENTATION PAGE T1. REPORT DATE October 2015
T2. REPORT TYPE Research
T4. TITLE AND SUBTITLE Whitepaper on Structure from Motion (SfM) Photogrammetry: Constructing Three Dimensional Models from Photography
Form Approved OMB No. 0704-0188 T3. DATES COVERED: Fiscal Year 15 5a. CONTRACT NUMBER
15XR0680A1-RY.1541DS20.1513835 5b. GRANT NUMBER 5c. PROGRAM ELEMENT NUMBER 1541 (S&T)
6. AUTHOR(S) Eric B. Peterson U.S. Bureau of Reclamation Trinity River Restoration Program Weaverville, CA Matthew Klein U.S. Bureau of Reclamation Materials Engineering and Research Lab Denver, CO
5d. PROJECT NUMBER
ST-2015-3835-1 5e. TASK NUMBER 5f. WORK UNIT NUMBER NC-157E
Robert L. Stewart U.S. Bureau of Reclamation Trinity River Restoration Program Weaverville, CA 7. PERFORMING ORGANIZATION NAME(S) AND ADDRESS(ES) Eric B. Peterson U.S. Bureau of Reclamation Trinity River Restoration Program Weaverville, CA
8. PERFORMING ORGANIZATION REPORT NUMBER
9. SPONSORING / MONITORING AGENCY NAME(S) AND ADDRESS(ES) Research and Development Office U.S. Department of the Interior, Bureau of Reclamation, PO Box 25007, Denver CO 80225-0007
10. SPONSOR/MONITOR’S ACRONYM(S) R&D: Research and Development Office BOR/USBR: Bureau of Reclamation DOI: Department of the Interior 11. SPONSOR/MONITOR’S REPORT NUMBER(S)
ST-2015-3835-1 12. DISTRIBUTION / AVAILABILITY STATEMENT Final report can be downloaded from Reclamation’s website: https://www.usbr.gov/research/ 13. SUPPLEMENTARY NOTES
14. ABSTRACT (Maximum 200 words) This paper documents the learning of a “community of interest” seeking to maximize Reclamation’s capabilities in a developing field of 3D data acquisition referred to as Structure from Motion (SfM) Photogrammetry. Photogrammetry is the use of two dimensional (2D) images to provide measurement data. Structure-from-motion refers to a set of algorithms from computer vision sciences that assist photogrammetry by automatically detecting and matching features across multiple images, then triangulating positions to form 3D point clouds. SfM Photogrammety data collection (photography) and processing are discussed with a focus on PhotoScan Professional software, but with acknowledgement of no-cost software options where applicable. Techniques and equipment for optimizing efficiency and accuracy are included. Several test cases are demonstrated, both to highlight advantages to SfM Photogrammetry and to provide awareness of challenges. A table summarizing relative advantages of photogrammetry versus laser scanning technologies is provided. 15. SUBJECT TERMS Structure from motion photogrammetry, multi-view photogrammetry, point cloud, laser scanning 16. SECURITY CLASSIFICATION OF:
a. REPORT U
b. ABSTRACT U
c. THIS PAGE U
17. LIMITATION OF ABSTRACT U
18. NUMBER 19a. NAME OF RESPONSIBLE OF PAGES PERSON Eric Peterson 46 19b. TELEPHONE NUMBER 530-623-1810 S Standard Form 298 (Rev. 8/98) P Prescribed by ANSI Std. 239-18
Acronyms and Abbreviations 2D = two dimensional 3D = three dimensional GCP = geospatial control point RMSE = Root mean square error SfM = Structure from Motion TLS = Terrestrial laser scanning UAS = Unmanned aerial system UAV = Unmanned aerial vehicle
Executive Summary This paper documents the learning of a “community of interest” seeking to maximize Reclamation’s capabilities in a developing field of 3D data acquisition referred to as Structure from Motion (SfM) Photogrammetry. Photogrammetry is the use of two dimensional (2D) images to provide measurement data. Structure-from-motion refers to a set of algorithms from computer vision sciences that assist photogrammetry by automatically detecting and matching features across multiple images, then triangulating positions to form 3D point clouds. SfM Photogrammety data collection (photography) and processing are discussed with a focus on PhotoScan Professional software, but with acknowledgement of no-cost software options where applicable. Techniques and equipment for optimizing efficiency and accuracy are included. Several test cases are demonstrated, both to highlight advantages to SfM Photogrammetry and to provide awareness of challenges. A table summarizing relative advantages of photogrammetry versus laser scanning technologies is provided.
i
Contents Page Executive Summary ........................................................................................................... i Introduction ........................................................................................................................1 What is SfM? .......................................................................................................... 1 What is the Community of Interest? ....................................................................... 1 Purpose of this Whitepaper .................................................................................... 1 Application of SfM .............................................................................................................2 Structural ............................................................................................................... 2 Natural Forms......................................................................................................... 2 Taking Photographs for SfM ............................................................................................2 Cameras ................................................................................................................. 2 Photographic Strategies .......................................................................................... 3 Processing 1: Images to Point Clouds ...............................................................................5 Software................................................................................................................. 5 Sparse cloud and dense cloud ................................................................................. 5 Scale and geospatial control ................................................................................... 6 Processing 2: Creating Meshes ..........................................................................................6 Processing 3: Creating Orthoimagery ..............................................................................6 Test Cases............................................................................................................................7 Wood Habitat Structure Evolution .......................................................................... 7 Counterfort Wall Modeling ..................................................................................... 9 Helicopter Flyover of Channel Restoration Site ..................................................... 11 River Bar Topography ........................................................................................... 14 River-Raft Bank Geomorphology ........................................................................... 19 Historical Orthoimagery ........................................................................................ 21 Demo of Smooth Surface Challenges (Pocket Knife) .............................................. 25 Summary and comparison to laser technologies. ..........................................................27 Further Reading ...............................................................................................................29 Background and technique ................................................................................... 29 Software............................................................................................................... 29 Select Recent Scientific Studies ............................................................................. 29
iii
Tables Page Summary and comparison to laser technologies. ...............................................................27
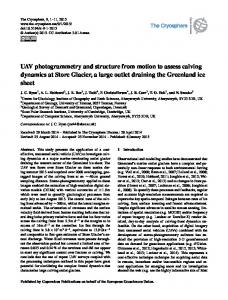
Figures Page Figure 1: Example image for oblique (human) point of view to obtain a photogrammetric surface model with approximately survey-grade accuracy. Horizon should be included in the top 1/3 for broad feature matching across numerous images. Attention to overlap between should be given to the area around the lower 1/3 division (box with blue outline).......................................................................................................4 Figure 2: Lorenz Gulch Wood Jam As-Built. This shows an oblique, 2D view of the 3D point cloud developed after site construction in 2013 from approximately 10 laser scans.............................................................................8 Figure 3: Lorenz Gulch Wood Jam after 8,500 cfs Restoration Flow Release in 2015. This shows the same oblique, 2D view as in Figure 2, but from a 3D point cloud developed after the 2015 restoration flow release. ................8 Figure 4: View of wall with camera positions (blue rectangles). ........................................9 Figure 5: Side view of model texture. ................................................................................10 Figure 6: Close up, showing crack and threaded connection.............................................11 Figure 7: Sparse model showing photo angles taken by helicopter (blue squares) and geospatial control points (yellow dots).....................................................12 Figure 8: Dense model derived from the sparse model in Figure 7. ..................................12 Figure 9: Zoomed image of wood in pond for comparison to next figure demonstrating vertical sensitivity....................................................................13 Figure 10: Zoomed dense point model on wood in pond (similar perspective to last figure), demonstrating vertical sensitivity of the densified model; some degree of smoothing appears to happen with dense models. .................13 Figure 11: Zoomed wire-frame model of pond. Scalloping of banks around pond are clearly visible but the wood is mostly smoothed over. Noise from the water surface is also apparent (reflections and surface ripples are non-stationary but often detected as match points, causing noise on water surfaces).................................................................................................13 Figure 12: Example of an oblique image taken for the Weaver Creek delta photogrammetry. .............................................................................................15 Figure 13: Initial “dense” model of the Weaver Creek delta with vegetation and other objects included......................................................................................16 Figure 14: Final “dense” model of the Weaver Creek delta with vegetation and unnatural objects removed to produce the natural bar surface. .......................16 Figure 15: View of final cleaned dense cloud (vegetation removed) at roughly the same perspective as Figure 12. Larger gravel and cobble are sufficiently visible that they could be measured from the point cloud. ..........17
iv
Figure 16: Orthophoto developed from the original images over the dense point cloud. Distortions at the edges are due to the imagery being stretched over areas with few points in the model. .........................................................17 Figure 17: Zoom on a portion of the orthophoto developed from the original images over the dense point cloud. Faceting artifacts toward the upper-left are due to overhanging vegetation being removed for orthophoto generation. The Blue arrow shows the point of view used for Figure 12 and Figure 15.............................................................................18 Figure 18: Further zoom (sufficient to show pixilation) on a portion of the orthophoto developed from the original images over the dense point cloud, showing a ground control point target. Ortho was generated for 1cm resolution; PhotoScan’s default offer based on point density was a resolution of approximately 3mm. ...............................................................18 Figure 19: Example of a photo taken from a river raft. Dense trees, both evergreen and deciduous, complicate aerial data collections in cases like this. ..............20 Figure 20: Sparse model (optimized) at approximately the same point of view as Figure 19. ........................................................................................................20 Figure 21: Dense model at approximately the same point of view as Figure 19. ..............21 Figure 22: Points from dense model clipped to within about 2 ft of the water surface to assess horizontal accuracy of capturing the river bank. .................21 Figure 23: example of typical photo quality. Tall shadows on right are from mature conifers. Lines to the left of the river are likely logs up to 50ft in length. ..........................................................................................................23 Figure 24: Dense point cloud of 276,486,963 points. View faces to the northwest with the dams roughly centered in the image. .................................................23 Figure 25: Zoomed example of resulting orthophoto mosaic, demonstrating artifacts from mesh facets. See text for discussion of possible solutions. .........................................................................................................24 Figure 26: Zoomed example of a single aerial photo orthorectified by rendering it over the mesh from the point cloud using a python script available on the Agisoft website and anticipated to be available in the next version of PhotoScan. Note that artifacts from mesh faceting are not present. ...........25 Figure 27: Pocket knife, one of 8 images to demonstrate difficulties with smooth, uniform surfaces. .............................................................................................26 Figure 28: Model of pocket knife to demonstrate difficulties with smooth, uniform surfaces. ...........................................................................................................26
v
Introduction What is SfM? Photogrammetry is the use of two dimensional (2D) images to provide measurement data. Measurement data includes positions of objects and relationships between objects. Photogrammetry uses a procedure referred to as “Structure from Motion” (SfM) to solve feature positions within a defined coordinate system. SfM refers to a set of algorithms from computer vision sciences that assist photogrammetry by automatically detecting and matching features across multiple images, then triangulating positions. The term is a bit of a catch-phrase and within the science of photogrammetry and there are alternate terms such as “multi-view photogrammetry” (MVP). SfM has very high computing requirements. The concepts date back to the 1970s, but only recently have standard workstation computers achieved sufficient processing speed and memory capacity for SfM to be practical for many of its potential uses. Aerial Lidar and Terrestrial Laser Scanning (TLS) technologies are competing technologies at present. Each has advantages and disadvantages which are summarized in a table at the end of this paper.
What is the Community of Interest? Recognizing both the potential value of SfM photogrammetry, and the complexities involved in using the technology, the U.S. Bureau of Reclamation’s Science and Technology Program funded a small project to assemble people with interest and expertise to facilitate communication and learning. The community was extended beyond Reclamation to include other DOI agencies to take advantage of broader expertise, shared during several conference calls and a hands-on workshop. The workshop was hosted by the Trinity River Restoration Program (TRRP) and opened to collaborators on Trinity restoration. The community of interest is expected to continue with additional funding for coordination and workshop development.
Purpose of this Whitepaper This paper is intended to convey the shared learning of the community of interest within its first year and from its first workshop. It should provide a foundation for future use of SfM photogrammetry within Reclamation (and across DOI), including recommendations toward equipment and time. Demonstration projects (Test Cases) describe both the capabilities of SfM and provide awareness of some current challenges. SfM photogrammetry is frequently used in conjuction with Unmanned Aerial Systems (UAS, or Unmanned Aerial Vehicle – UAV). The focus of the community of interest and this whitepaper has been on taking advantage of SfM for non-UAS projects.
1
Application of SfM Structural SfM photogrammetry is applicable to a wide variety of structural data needs. Almost anything that can be photographed can be modeled. SfM results are best on textured surfaces; a smooth, uniformly colored surface might appear lumpy in the final model due to the way pixels are correlated, or it may result in a void in the data (see Test Case: Smooth Surface Challenges). As with laser scanning systems, multiple angles must be viewed to wrap 3D models around features. SfM has an advantage of being somewhat independent of real-world scale: if a model is needed of a very small object or piece of equipment, a camera with a macro-lens can resolve pixels smaller than a standard TLS can resolve light-wave travel and phase.
Natural Forms SfM photogrammetry is in widespread use for natural landforms, and is particularly popular for developing terrain models from UAS photography. Natural landforms typically offer an abundance of features in the photographs that can be easily matched between images by SfM software. For projects with a good photographing strategy and proper data processing, accuracy should rival, or exceed, laser technology data collected from a similar distance: aerial photography from traditional manned flights should rival airborne lidar; ground-based and closerange UAS photography should rival TLS.
Taking Photographs for SfM Cameras Almost any camera can be used to develop 3D point clouds and mesh objects using SfM photogrammetry. Even the camera built into most cell phones is sufficient for developing amazing looking models. However, when significant spatial or dimensional accuracy is needed, higher quality lenses, image resolution, and control of camera settings becomes necessary. Most SfM software develops camera-lens calibration models as part of the processing; a project or field based calibration is generally more accurate than universal camera-lens calibrations (see Photographic Strategies : Camera Orientation, below for a tip on calibration improvement). Camera models will change slightly with aperture and even focus settings, so cameras should be set to keep these settings constant.
2
Lens: use a fixed-length prime lens if possible. Generally these should be wide-angle, but
not fish-eyed. If only a zoom lens is available, use painters tape or a heavy duty rubber band to fix the zoom during a data collection. Camera Settings: set aperture to a constant f-stop. Generally lenses are sharpest at an intermediate f-stop such as f/8 or f/11. If light is inconsistent in your project, allow shutter speed to vary in order to keep exposure constant with the constant aperture. Note that slow shutter speed
may increase blurring, so a tripod may be necessary. ISO may also be allowed to vary, but be careful as high ISO will introduce noise to the images. Camera focus: for optimal calibration of the camera-lens combination, focus should be held constant as well. Set focus once and turn off autofocus while photographing at a reliable distance. If focus must be changed, take an intermediate photo of another subject to mark where in the photo sequence the focus was changed. Then make sure the software develops a different camera model for the next set of images (each focus setting should be a different camera model). Vibration reduction: if available on a camera, this should be turned off. Vibration reduction works by moving the relative position between the sensor and the lens. As a result, the camera image will shift, degrading the final photogrammetric result. Camera resolution: higher resolution will be better assuming the lens is capable of providing a sharp image at the higher resolution. A recent trend in cameras is to omit an optical low-pass filter. Omission is likely to improve SfM accuracy, but no known tests to verify this are available. File format: use a raw format if possible to preserve flexibility in bright or dark areas of images and to avoid loss of data due to compression. If raw is not available or practical, use the highest
quality compression level available.
GPS: Use of GPS within a camera can be very useful for guiding the initial 3D model development. In most SfM software, GPS data increases the efficiency for aligning images. This can also reduce time and effort for manually adding markers to improve models or match additional images (mentioned in several Test Case projects below). GPS generally has an accuracy of several meters, which should be accounted for in software settings and perhaps the use of GPS data should be turned off for final models (unless these are derived from survey grade Real-Time Kinematic (RTK) GPS, and no other geospatial control is available – see Test Case: River Raft Bank Geomorphology). Sensor size: Larger sensors may be of some benefit by reducing the effects of lens distortions and defects. This benefit may be minor though, as the automatic camera calibration should eliminate distortions and reduce defects.
Caution: there are many postings on the internet about using video and extracting image frames later for SfM. Video is typically highly compressed and will yield poor quality images even when the frames appear good. Compression is both within a frame and between frames such that exact positioning of items may be distorted across frames. Furthermore, most cameras use a ‘rolling shutter’ for video such that any movement during the image capture will distort vertically across the image. Photogrammetry from video can be used in instances where other means of image recording is not available, but note that the model accuracy will usually be reduced in these cases and results should be interpreted accordingly.
Photographic Strategies A good, systematic strategy for taking the images within a project may be more important than the choice of camera itself. The ability to model point clouds from oblique images (standard human point of view) is one of the greatest advantages of SfM photogrammetry. But it is also a significant point of risk. Oblique images will have huge amounts of depth, thus a pixel within the image may represent a tiny area for items close in the camera, but a huge area for objects at a 3
great distance. Accuracy optimization relies in large part on pixel accuracy, so accuracy measures can be difficult with highly oblique photography. Conversion to orthoimagery is still possible, but may appear very distorted in places (see Test Case: River Bar Topography). The U.S. Bureau of Land Management provided our workshop with a workflow document that gives some excellent recommendations (available upon request) for collecting high quality data based on photographic strategies in two general categories: for areas and for objects. For areas. Treat the project much like an aerial photography project. Images should be taken in a regular pattern with a minimum of 60% overlap between frames and 30% overlap between passes. This can still be done for oblique photography, though consistent overlap may not be possible in all cases (e.g. Test Case: River Bar Topography) where numerous images may be near 100% overlap on their horizon, but minimal overlap in the foreground. Tests are ongoing, but thus far images that include the horizon near the top of the image seem best for image matching. Images should have overlap with other images at about the 1/3 distant zone to obtain good density of points in the final models (Figure 1).
1/3
1/3
1/3
Figure 1: Example image for oblique (human) point of view to obtain a photogrammetric surface model with approximately survey-grade accuracy. Horizon should be included in the top 1/3 for broad feature matching across numerous images. Attention to overlap between should be given to the area around the lower 1/3 division (box with blue outline).
For objects. Work your way around the object taking images at approximately 10-15 degree intervals (a total of 24-36 images). Add images or another pass as needed for top and bottom. See Test Cases for the Counterfort Wall and the Helicopter Flyover.
4
Camera orientation. Most SfM software automatically develops camera-lens models. These will be developed best if some of the images are taken with the camera tipped 90 degrees right and 90 degrees left. For a regular sequence, the recommendation is right-flat-left-flat …[flat]… flat-right-flat-left. Alternatively, if multiple passes are planned, the camera may be rotated each direction for different passes.
Processing 1: Images to Point Clouds Software This paper focuses on the use of AgiSoft PhotoScan Professional version 1.1.6. Several alternate software options are available including VisualSFM, which is no-cost for non-commercial use. VisualSFM is an excellent choice for beginners who are learning the SfM photogrammetry concepts. Additional no-cost software is available for processing and analysis of point clouds (e.g. CloudCompare), mesh development (e.g. MeshLab), and even orthophoto creation (e.g. CMPMVS). However PhotoScan offers a much more fluid workflow, plus accuracy optimization, all within a single package. A project requiring survey level accuracy done in PhotoScan might take an order of magnitude more time to complete with no-cost software options, and final accuracy would likely suffer. Trimble Realworks is commercial software that is useful for cleaning final point clouds and can be more efficient than CloudCompare when working with large point clouds (tens of millions of points or greater). Links to websites for these software packages are provided in Further Reading (below).
Sparse cloud and dense cloud The general process for SfM photogrammetry is: 1. Organize and load images a. Raw image processing (processing of raw images can enable feature matching both within shadows and brightly lit areas) b. Organize based on camera type and settings 2. Model “Sparse” cloud: a. Identify ‘features’, or recognizable patterns among pixels (automated), b. Match features between images (automated), c. Triangulate points to represent those matches as X,Y,Z coordinates with pixel colors assigned to the points – this results in a sparse point cloud that represents the geometry among the images (automated), d. Depending on the success of the photographic strategy, manual addition of match points may be necessary (PhotoScan uses markers for this process). e. Optimize the model/cloud geometry (manual). Optimization has the potential to bring accuracy to 0.1-0.5 pixels (assuming high quality images and a good photographing strategy. A PhotoScan workflow developed by the U.S. Bureau of Land Management (BLM; available upon request) provides a method achieve this degree of accuracy. Note: While PhotoScan offers several tools for assessing models 5
and reducing error, VisualSfM relies on filters for providing good geometry but has no capabilities for further refinement. These manual processes can become time-consuming. The better the photographic strategy for a project, the more efficient these steps are likely to be. 3. Model “Dense” cloud: a. This is a relatively static process based on the geometry of the sparse cloud, with few options to configure. PhotoScan offers a ‘quality’ option that is actually a downsampling of the original photo, so reduces the final point count and its accuracy. PhotoScan also offers some vertical filtering of points that may be of use when the expected final data is a continuous surface. Model densification is computerintensive and prone to out-of-memory issues (models might run for several days only to end in an error with no product); PhotoScan also offers a python script through its website to parse the project into subsets to avoid the error.
Scale and geospatial control Development of the geometry within the sparse cloud benefits from inclusion of known points. The spatial coordinate system can be unspecified yet enable measurements within the cloud simply by inclusion of scale. Scale and geospatial control points (GCPs) also provide for realworld measures of model accuracy (beyond measures of pixel error). Inclusion of geospatial control is vital for data that will be used within GIS software. Control is typically added by specifying known coordinates for points or markers within images. But control can also come from positions of the camera at the time it took the photo. Generally these will be less accurate than standard control points in the images, but if the camera is carefully coordinated with survey-grade RTK GPS and the camera is not moved during GPS data collection in a consistently biased direction, then the resulting model can be within, or close to, survey level accuracy (see Test Case: River Raft Bank Geomorphology).
Processing 2: Creating Meshes Meshes connect points within a 3D point cloud to model surfaces and solid structures. They function much like a triangulated irregular network (TIN) surface does for a topographic model except that a mesh is able to fully wrap around objects. Meshes are needed for many types of 3D modeling and are a required step for producing orthophotographs (below).
Processing 3: Creating Orthoimagery Original images, even from very oblique angles, can be converted to orthoimagery. The original images are stretched over meshes as ‘texture maps’, then projected in 2D.
6
Test Cases These test cases provide demonstrations of the potential for SfM photogrammetry, as well as challenges: most cases discuss difficulties with data processing. These are offered to provide insight for the use of photogrammetry and its various techniques for particular applications.
Wood Habitat Structure Evolution Trinity River Restoration Program (TRRP) actions often include construction of large wood jams for both habitat and geomorphic purposes. As with other actions, features constructed are not intended to be permanent, but rather to evolve over time. After construction of a wood jam at TRRP’s Lorenz Gulch site, Terrestrial Laser Scanning was used to build a digital model of the structure as-built in 2013. TRRP’s restoration flows were designed to achieve a relatively high rate of 8500cfs in spring of 2015. Our workshop was held as these flows receded. As a demonstration project for the workshop, a new model of the wood jam was developed photogrammetrically. Field work for the wood structure SfM data required only about 2 hours (RTK GPS setup inclusive) versus a full day for TLS, (although TLS wrapped further around the back of the structure and neighboring banks). TLS provided higher point density overall, but SfM used more viewing angles resulting in fewer large voids amidst the wood. The photogrammetric model used 42 images in the BLM recommended method for 3 passes (camera oriented differently in each pass). All images aligned automatically and the BLM workflow was used to refine the model to 10,097 tie points and a root mean square error (RMSE) of 0.28 (photo pixel accuracy of 0.249 to 0.303). Three scale bars were included with the images and measurement accuracy across all 3 had RMSE = 0.0009 m. The model was roughly georectified based on RTK GPS positions of 4 specifically placed rocks; precise points on these rocks were not possible; 3D position RMSE = 0.12 m. PhotoScan’s settings of ultra-high quality and moderate vertical filtering yielded a dense model of 10,076,357 points, though about half of these were water reflections or background vegetation removed from the model shown below (Figure 3). The rectification was later adjusted within Cloud Compare to match key points on log root masses that are not thought to have moved. Office time spent on the photogrammetric model was no more than 6 hours, and the largest portion of that was spent on adjusting the rectification in CloudCompare. Use of photogrammetric targets, rather than rocks, would likely have reduced office efforts by 1-2 hours. Comparison between the TLS and SfM models shows that a large amount of sediment was removed from the top of the log jam during the restoration flow release, along with some fine woody debris, but that only one large log appears to have been removed and a log lacking a root ball appears to have rotated slightly. Several additional logs and stumps have accumulated on the leading face of the structure.
7
Figure 2: Lorenz Gulch Wood Jam As-Built. This shows an oblique, 2D view of the 3D point cloud developed after site construction in 2013 from approximately 10 laser scans.
Figure 3: Lorenz Gulch Wood Jam after 8,500 cfs Restoration Flow Release in 2015. This shows the same oblique, 2D view as in Figure 2, but from a 3D point cloud developed after the 2015 restoration flow release.
8
Counterfort Wall Modeling Counterfort walls are a structural feature often used in Reclamation’s facilities for lining the edges of spillways and other locations where soil retention is required. The walls are designed using classical structural theory but there is little experimental data to confirm the results. The Materials Engineering and Research Laboratory was asked to test a scaled model of a section of the wall. During the test, the concrete specimen cracked in several places. One of the many applications of photogrammetry is the ability to document the 3D condition of structural elements for inspection and contextual review. Currently, this is done by taking a number of pictures and then sorting through the images in a slideshow to investigate the dimensional relationship and/or patterns in the damage. The relationships and patterns can be used to derive conclusions about the cause of the damage and subsequent repair or replacement plans. The counterfort wall model was used to demonstrate these photogrammetric abilities. Pictures were taken of the wall in a circular pattern with one picture every 15° (Figure 4). Concentric rings were formed at three levels to capture the lower, middle and upper portions of the wall specimen. Additional images were collected at the area with the greatest damage.
Figure 4: View of wall with camera positions (blue rectangles).
A 35mm, 36 MP mirrorless camera with a 35mm prime lens was used to capture a total of 65 images. The data was collected outdoors on a cloudy day to minimize shadows. The camera settings and focus were all set to manual. Once the images were collected, they were processed by Agisoft PhotoScan Pro. The first step was to detect points and estimate the camera positions producing a sparse point cloud. Then the point cloud was filtered to remove data points with 9
higher errors. Maximum error in the model was reduced to 0.167 pixels. Using the refined camera positions, the dense point cloud was generated at a density of about 2000 points per square inch. The dense cloud was used to provide a surface mesh of the model with a face count of about 385 faces per square inch. This mesh was used as a base for the photorealistic texture overlay (Figure 5). This texture was able to be used to document the condition of the wall after testing with high enough resolution to reveal the crack patterns in the specimen as well as steel reinforcement deformation ( Figure 6).
Figure 5: Side view of model texture.
This demonstration showed the versatility and precision with which photogrammetry can be successfully used to document the 3D condition of concrete structural elements for investigation and analysis.
10
Figure 6: Close up, showing crack and threaded connection.
Helicopter Flyover of Channel Restoration Site TRRP contracts with a photographer to obtain images for public education, brochures, etc. including low-altitude flyover images from a helicopter. With minimal guidance, the photographer was asked to encircle a restoration site taking images at regular intervals and maintaining camera settings (zoom, aperture, focus). TRRP staff also placed 6 targets at the site (36” x 36” circular targets) which were surveyed by RTK GPS. The photographer took over 100 images with a Nikon D800 (24 Mpixel) and a 50mm lens from an altitude of about 800 feet above the ground, from which 34 were selected for processing. Targets were located in images prior to alignment, with coordinates specified (target specification was challenging due to the targets appearing small and washed out in the imagery; we recommend using larger targets, possibly with quadrant coloring for future projects). Alignment was then completed without further input. Three scales were set based on relative positions of the targets. The model was optimized following the BLM workflow, resulting in model RMSE = 0.362775; photo pixel error ranging 0.307 to 0.419; and GPS target RMSE =0.034 m (X, Y, and Z = 0.007, 0.026, and 0.019). Processing time to this point was about 2-3 hours. Then challenges began. This model was too large to run densification with high quality settings without “out of memory” errors. PhotoScan provides a python script to break large projects like this into multiple pieces. The script ran beautifully on some other projects, but inconsistently left blank zones within this project. Once the model was reverted to an earlier version and scales were replaced, the model processed fine. There must have been some corruption of the model 11
files that caused the problem (message: save often, and keep numerous versions along the way). The resulting dense point cloud contained 18,645,224 points (Figure 8).
Figure 7: Sparse model showing photo angles taken by helicopter (blue squares) and geospatial control points (yellow dots).
Figure 8: Dense model derived from the sparse model in Figure 7.
12
Figure 9: Zoomed image of wood in pond for comparison to next figure demonstrating vertical sensitivity.
Figure 10: Zoomed dense point model on wood in pond (similar perspective to last figure), demonstrating vertical sensitivity of the densified model; some degree of smoothing appears to happen with dense models.
Figure 11: Zoomed wire-frame model of pond. Scalloping of banks around pond are clearly visible but the wood is mostly smoothed over. Noise from the water surface is also apparent (reflections and surface ripples are non-stationary but often detected as match points, causing noise on water surfaces).
13
River Bar Topography TRRP restoration actions include augmentation of spawning gravels to the river system. Developing a gravel budget for the river has been useful for planning management actions. Toward a better understanding of tributary contributions to the gravel budget, several major tributaries are monitored as needed for topographic differencing to calculate sediment input. This demonstrates a topographic model for the terrestrial portion of the Weaver Creek delta (bathymetry is being processed separately). The site is approximately 150 meters across its longest dimension. A total of 1025 images were taken on foot and from a highway bridge that crosses the site (the shadow is distinctively visible in the figures). All images were taken at highly oblique angles (Figure 12), though images from the bridge were less oblique. Eight flat targets were laid on the ground and georeferenced with RTK GPS for spatial control. PhotoScan was used to develop the 3D model and 14 additional markers were added to the model to facilitate image alignment. The final model aligned 852 of the images; we expect that having geolocated camera positions would have sped model development and improved the number of images aligned. The model was optimized to an RMSE of 0.376 pixels. Total positional error based on the targets as reported by PhotoScan was 0.05m. Scale error based on two distances between targets (lengths 136.353 and 32.010m) was 0.007m. The sparse model contained 654,578 points, while the densified model (using High quality and Moderate filtering) yielded 172,488,191 points. Many areas were obscured by vegetation, especially willows (typically 2-3m tall) and invasive sweet clover (typically 1m tall) or woody debris. Trimble Realworks 9.0.1 was used for initial removal of this vegetation and bulk cleanup of other incorrect pixels using the segmentation tool (segmentation is available in CloudCompare too, but is not as efficient with large clouds). Data were further cleaned in CloudCompare 2.6.0 using the Hidden Pixel Removal plugin which removes points hidden from a particular view (very useful for clearing the remaining incorrect pixels). The final cloud retained 136,629,211 points (Figure 14) and larger cobble is generally visible (Figure 15 and Figure 18). An orthophoto of the area was also developed to demonstrate orthoimagery from oblique photography (Figure 16 to Figure 18). To ensure that vegetation would show, the cleaned model was not used, but to avoid artifacts from the bridge and taller leaning vegetation, the dense point cloud was clipped at about a 2 meter height. A mesh was then calculated, followed by orthoimagery through the standard capabilities of PhotoScan 1.1.6 Professional (note: see Test Case: Historic Orthoimagery for more on orthophoto creation possibilities in PhotoScan). Based on point density, the software offered to create the orthophoto with a pixel size of about 3mm. This was backed-off to 1cm for the demonstration. The resulting orthophoto has cobbles clearly visible in most areas where cobble existed. Areas outside the point cloud, or clipped to the 2m height, show strong faceting of the imagery. The resulting orthophoto shows an excellent spatial match to the aircraft-based aerial photography collected by a contractor just 1 month before (0.5 ft resolution), but areas with sparse density of points in the underlying cloud should be blanked out as no-data regions. Time spent on the project includes approximately 6 hours field work, 8-16 hours processing (primarily adding markers to improve alignment), and 4-8 hours for cleaning data to the final 14
model. This project would have benefited from (1) use of a high-accuracy GPS system for georeferencing each photo so as to reduce office processing time, and (2) use of an Unmanned Aerial System (UAS) for less oblique photo viewpoints.
Figure 12: Example of an oblique image taken for the Weaver Creek delta photogrammetry.
15
Figure 13: Initial “dense” model of the Weaver Creek delta with vegetation and other objects included.
Figure 14: Final “dense” model of the Weaver Creek delta with vegetation and unnatural objects removed to produce the natural bar surface.
16
Figure 15: View of final cleaned dense cloud (vegetation removed) at roughly the same perspective as Figure 12. Larger gravel and cobble are sufficiently visible that they could be measured from the point cloud.
Figure 16: Orthophoto developed from the original images over the dense point cloud. Distortions at the edges are due to the imagery being stretched over areas with few points in the model.
17
Figure 17: Zoom on a portion of the orthophoto developed from the original images over the dense point cloud. Faceting artifacts toward the upper-left are due to overhanging vegetation being removed for orthophoto generation. The Blue arrow shows the point of view used for Figure 12 and Figure 15.
Figure 18: Further zoom (sufficient to show pixilation) on a portion of the orthophoto developed from the original images over the dense point cloud, showing a ground control point target. Ortho was generated for 1cm resolution; PhotoScan’s default offer based on point density was a resolution of approximately 3mm.
18
River-Raft Bank Geomorphology TRRP has significant interest in river bank geomorphology, yet banks are difficult to survey by standard aerial lidar due to dense vegetation. Vegetation is frequently arboreal with potential for oblique angles to better ‘see’ under the canopy than aerial orthogonal perspectives (Figure 19). Photogrammetry can provide the appropriate viewing angles and could greatly supplement river bank representation in lidar-based topographic models. This demonstrates a series of 192 images taken at 1 second intervals from a raft floating down the Trinity River. A 12MP Nikon D90 was used, mounted to a survey pole with an RTK GPS, providing GPS positions for the camera at 1 second intervals. To further challenge the method, the camera was briefly rotated to the other bank and back at one point; rotation was gradual so as to provide potential tie points across the rotation. These were processed in PhotoScan using the ‘reference’ option for pair pre-selection so that camera coordinates would be used to assist alignment. The initial model aligned all cameras, producing 293,175 points in the initial (uncleaned) sparse cloud. GPS error was reported as 1.224m RMSE with a maximum of 2.371m. With about 20 minutes of manual effort, the sparse point cloud was optimized to reconstruction uncertainty of 30 or less, and reprojection error of 1.2 or less resulting in a model RMSE of 0.39 pixels and RMS GPS error of 0.744m; 120,629 points were retained in this optimized cloud (Figure 20). Densification at full resolution with PhotoScan’s “mild” filtering yielded a cloud of 41,750,625 points prior to any cleaning efforts (Figure 21). No ground control points were used for this project. To test use of camera-position RTK GPS data for georeferencing, all points significantly above the water surface were removed, resulting in a series of points that should approximate the water’s edge. These points were imported into GIS and compared with 0.5ft resolution aerial photography from summer 2014, which has a reported planar accuracy of 0.479ft. Between summer of 2014 (aerial photography) and spring of 2014 (bank photography) there was little opportunity for geomorphic change, with a peak flow in this portion of the river estimated at 1800cfs. However, the aerials were collected at 450cfs versus the bank images at 300cfs, thus bars are expected to be more exposed in the bank dataset. In the resulting data (Figure 22), the 450cfs versus 300cfs difference in river flow is likely the primary source of discrepancy for shallow areas such as bars. Based on relatively stable features (e.g. a log submerged, but visible, at 450cfs that was partially exposed at 300cfs) the point cloud has a shift to the northeast of about 2 feet. Given that the GPS locations are available at 1 second intervals, but the camera was not synchronized to trigger at the same point within that 1 second interval, there is a significant amount of positional error between the GPS and the camera. GPS positions indicate typical raft movement of about 2m per second, and since this project was continually moving in roughly the same direction, the error would be consistently biased in that direction. As this movement was almost entirely horizontal (very little change in elevation), the elevation values in the model should be quite good (unfortunately there is little data on-hand to confirm this idea). The best solution would be to synchronize the GPS and camera through some mechanism that uses the 19
GPS to trigger the camera. TRRP is not currently in possession of such a device. Alternatively, use of just a few targets at known locations could be used to calculate a transformation for shifting the entire point cloud. Lastly, if data collection was not linear (e.g. GPS positions for photographs in the River Bar test case) then error would not have a strong bias and the mean error should approach 0.
Figure 19: Example of a photo taken from a river raft. Dense trees, both evergreen and deciduous, complicate aerial data collections in cases like this.
Figure 20: Sparse model (optimized) at approximately the same point of view as Figure 19.
20
Figure 21: Dense model at approximately the same point of view as Figure 19.
Figure 22: Points from dense model clipped to within about 2 ft of the water surface to assess horizontal accuracy of capturing the river bank.
Historical Orthoimagery TRRP has several historic aerial photography datasets that were mosaicked into convenient GIS layers by a contractor several years ago using traditional ground control point based transformation. A set from 1960 has been of particular interest in that the area for Trinity Lake is included immediately prior to the start of dam operations. The area is mostly clear-cut, leaving the ground surface exposed and the channel form of the river is visible. The 58 scanned original images were processed with PhotoScan. Variations in scan origin resulted in a somewhat weak camera/lens model but images were a little blurry anyway (a perfect model was unlikely) and time required to transform and crop exactly to fiducial marks was prohibitive. Images were left unmasked, as the fiducial marks and other ‘stationary’ periphery features were not included in the aligned model.
21
Alignment was difficult, requiring numerous markers to add tie points and properly place the photo arrangement. Difficulties were exacerbated by some images being taken on a different date at a very different time of day, resulting in shadows at much different angles, thus preventing good feature matching. A number of iterations were performed of adding markers, aligning, and identifying the causes of misalignment. The model also had a tendency toward incorrect curvature that was obvious in the form of an undulating river bottom. Finding GCPs in such old photography that can be located with precise coordinates is challenging. Few buildings can be reliably located as the same building visible in current data. Most roads have been widened and perhaps somewhat re-aligned. Vegetation has changed dramatically. Bedrock features in the river were often the most reliable for providing tie-points. Ultimately, 65 markers were placed, 30 with 3D coordinates, and calculation of skew was omitted from the camera model. Two scale bars were included based on relative coordinates of markers, roughly perpendicular to each other: one spanning Carrville to Douglas City, the other spanning Helena to Lewiston. The model resulted in RMSE = 0.49; photo RMSE ranging 0.48 to 0.53 pixels; and the 30 coordinate points with RMSE= 6.2m (X, Y, Z = 4.18, 3.47, 3.00). The sparse model had 440,059 tie points. The dense point cloud generated with high quality and mild vertical filtering had 276,486,963 points. Orthoimagery generated with 1.5ft resolution on a surface mesh from the dense points were compared to recent TRRP aerial photography (0.5ft resolution) below Lewiston Dam and National Agriculture Imagery Program (NAIP) imagery (0.5 m resolution) above. Short of a full accuracy assessment with randomized points (which would be nearly impossible with historic imagery), the orthos appear to be mostly within 20ft below Lewiston Dam and that the most extreme inaccuracies are at the periphery of the model and error roughly doubles above Lewiston Dam where reliable points are less frequent due to river bedrock being submerged. The resulting orthoimagery exhibit a visual artifact from the way PhotoScan Professional version 1.1.6 applies individual images to mesh facets (Figure 23). These are most problematic in areas of high relief, often due to trees, but sometimes at transitions from flat to steep topography. Agisoft provides an online forum for discussion of its PhotoScan software and solutions to numerous common challenges can be found there. In one discussion thread on orthophoto artifacts, a link to a python script is provided that projects individual images across a mesh (this is anticipated to be available from the menus in the next version of PhotoScan). These individual images do not have the faceting problem and can be merged in alternate software such as ESRI ArcGIS. The old mosaic from the contractor also had problems with sufficient GCPs, resulting in horizontal placement error most visible where overlapping images were feathered together: ghosting of the two images with slight displacement was common, with about 10ft discrepancy typical for the river below Lewiston Dam, but in one case approaching 400ft above the Dams (possibly due to the lack of a bathymetry model for terrain correction). Time spent on this project is difficult to estimate, as the size of the dataset required a few minutes of work, then a wait while other work was done, then repeat, repeat, repeat. Time likely was over 3 days of work spread across several weeks of intervening obligations. The final point
22
cloud described here is from PhotoScan’s “High” quality procedure, as opposed to the “Ultrahigh”, meaning that images are down-sampled 1 step.
Figure 23: example of typical photo quality. Tall shadows on right are from mature conifers. Lines to the left of the river are likely logs up to 50ft in length.
Figure 24: Dense point cloud of 276,486,963 points. View faces to the northwest with the dams roughly centered in the image.
23
Figure 25: Zoomed example of resulting orthophoto mosaic, demonstrating artifacts from mesh facets. See text for discussion of possible solutions.
24
Figure 26: Zoomed example of a single aerial photo orthorectified by rendering it over the mesh from the point cloud using a python script available on the Agisoft website and anticipated to be available in the next version of PhotoScan. Note that artifacts from mesh faceting are not present.
Demo of Smooth Surface Challenges (Pocket Knife) Smooth, uniformly textured surfaces present a challenge for SfM. Little information is available in the original images for identifying features within such areas, and thus there are few match points in the model. A set of 8 close-up images of a pocket knife on a wood bench were used to demonstrate the issue. The wood of the bench provided plenty of texture for developing a flat point cloud, but the knife itself with variable reflections on the metal and the smooth shiny red plastic yielded a weak 3D structure. This issue should be minor in natural situations, but may be problematic for modeling of building interiors or machinery. Avoiding highly reflective lighting conditions may help.
25
Figure 27: Pocket knife, one of 8 images to demonstrate difficulties with smooth, uniform surfaces.
Figure 28: Model of pocket knife to demonstrate difficulties with smooth, uniform surfaces.
26
Summary and comparison to laser technologies. Use or Issue
Photogrammetry (Structure from Motion, aka Multi-View Photogrammetry)
Scale
Scalable from photomicrography to satellite imagery
Mission Planning
Depends on accuracy needs. General demonstration style 3D models can be created with photographs taken spontaneously, or even from collections of images taken without photogrammetric intention. But to achieve high levels of accuracy, significant mission planning is needed. Any camera can be used for lowaccuracy data. Digital SLR with fixed-length lens and manual settings is recommended.
Data Collection Equipment
Equipment Costs Computer processing
Computer and software costs for data processing
Computer and software for use of results Georeferencing
Laser Measurements (Airborne Lidar and Terrestrial Laser Scanning [TLS]) Generally used at 2 scales: airborne and terrestrial. Limited at very close scales by ability to measure time of travel for light pulse, or shift in wave phase. Critical for all aerial lidar. TLS can be performed with minor amounts of planning, but some degree of planning is necessary if multiple scans are to be stitched together.
Airborne requires aircraft, lidar instrument, highaccuracy GPS, and inertial system. TLS requires only a laser scanner. Recommended $1000-$5000 $30,000 and up Recommend: high-end desktop workstation with large memory capacity, fast graphics processing card, and large number of CPU cores. Expect $4000+ for computer, $2500+ for software. PhotoScan software can be obtained for about $2500. Virtually identical. Recommend software for display and manipulation of LAS files, plus either GIS or CAD system. Similar – both should involve geospatial control points visible in the final products. Camera can be used in conjunction with RTK GPS and provide nearsurvey level accuracy without GCP – see Photo Strategies for more.
27
Vegetation Challenges
Vegetation readily obscures ground surfaces. Detection of ground surfaces through dense vegetation is nearly impossible. Fine branching structure often leads to incorrect feature matches between images resulting in displaced points that must be cleaned from final data clouds. However, flexibility in camera positioning can sometimes allow vegetation to be avoided, such as by taking images from beneath a tree canopy.
Application with Unmanned Aerial Systems (UAS), aka Unmanned Aerial Vehicles (UAV)
Readily accommodated. Fisheye lenses are possible not recommended (e.g. GoPro). See also warning about use of video.
Application Indoors
Readily accommodated. Theoretically, light sources should be stable to avoid changes in shadowing that might degrade feature matching. Therefore use stationary flash systems, not oncamera flash. Simply requires an underwater camera or camera housing. Modeling of underwater features from images taken above water surface is not recommended due to refraction. Light dappling due to surface waves can be problematic for automatic feature matching between images – greater overlap between images might reduce the problem.
Application underwater
28
Vegetation partially obscures ground surfaces, though only dense vegetation prevents all laser pulses from penetrating to ground; all laser technologies can have difficulty penetrating thick grass to measure the true ground surface. For example, on the Trinity River, dense riparian tree canopies or shrubs often obscure aerial lidar reducing ground-surface point density, while blackberry thickets are nearly impenetrable and often mistaken for the actual ground surface. Coming... equipment is still largely experimental. Ideally will require size reduction in laser equipment or high-payload UAS with stabilization and inertial equipment. Readily accommodated with TLS.
Requires specialized laser system.
Further Reading Background and technique Matthews, N. A. 2008. Aerial and Close-Range Photogrammetric Technology: Providing Resource documentation, Interpretation, and Preservation. Technical Note 428. U.S. Department of the Interior, Bureau of Land Management, National Operations Center, Denver, Colorado. 42 pp. Online at http://www.blm.gov/nstc/library/pdf/TN428.pdf https://en.wikipedia.org/wiki/Photogrammetry https://en.wikipedia.org/wiki/Structure_from_motion
Software PhotoScan: http://www.agisoft.com/ [professional software package used for Test Cases above] Realworks: http://www.trimble.com/3d-laser-scanning/realworks.aspx [professional software for terrestrial laser scanning, also useful for cleaning point clouds to ground surfaces.] VisualSfM: http://ccwu.me/vsfm/ [no-cost software for model construction, cloud densification, and initial mesh creation]
Sift: http://www.cs.ubc.ca/~lowe/keypoints/ [web page for the SIFT algorithm used in VisualSFM for matching pairs; PhotoScan does not specify its algorithm, but would appear to be the same or similar.]
CloudCompare: http://www.danielgm.net/cc/ [no-cost software for point cloud manipulations and cleaning; segmentation capabilities approach Trimble Realworks but some actions in the software are relatively slow.]
MeshLab: http://meshlab.sourceforge.net/ [no-cost software for working with meshes] CMPMVS: http://ptak.felk.cvut.cz/sfmservice/websfm.pl?menu=cmpmvs [no-cost software for creation of orthoimagery. Note: this has specific software and hardware dependencies]
Select Recent Scientific Studies Caroti, G., I. Martínez-Espejo Zaragoza, and A. Piemonte. 2015. Accuracy assessment in structure from motion 3D reconstruction from UAV-born images: the influence of the data processing methods. International Archives of the Photogrammetry, Remote Sensing and Spatial Information Sciences, vol. WL-1/W4. DOI 10.5194/isprsarchives-XL-1-W4-103-2015. http://www.int-arch-photogrammremote-sens-spatial-inf-sci.net/XL-1-W4/103/2015/isprsarchives-XL-1-W4-103-2015.pdf Javernick, L., D. M. Hicks, R. Measures, B. Caruso, and J. Brasington. 2015. Numerical modelling of braided rivers with structure-from-motion-derived terrain models. River Research and Applications. DOI 10.1002/rra.2918. http://onlinelibrary.wiley.com/doi/10.1002/rra.2918/abstract Ryan, J. C., A. L. Hubbard, J. E. Box, J. Todd, P. Chrisoffersen, J. R. Carr, T. O. Holt, and N. Snooke. 2015. UAV photogrammetry and structure from motion to assess calving dynamics at Store Glacier, a large outlet draining the Greenland ice sheet. The Cryosphere: 9:1-11. DOI 10.5194/tc-9-1-2015. http://www.the-cryosphere.net/9/1/2015/tc-9-1-2015.html Westoby, M. J., J. Brasington, N. F. Glasser, M. J. Hambrey, and J. M. Reynolds. 2012. ‘Structure-fromMotion’ photogrammetry: a low-cost, effective tool for geoscience applications. Geomorphology 179:300-314. DOI 10.1016/j.geomorph.2012.08.021. http://www.sciencedirect.com/science/article/pii/S0169555X12004217 [This is no longer the most recent paper, but has the potential to become the foundational paper on SfM use in topographic/geomorphic sciences].
29