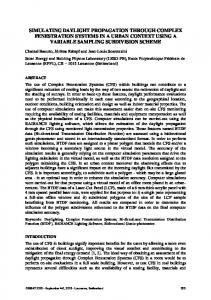
quality B), we call them imperfections and not defects. ... Figure 1: General truss beam elevation of specimens S6 and S7 with joint identification ..... [4] J.G. Payne, R.F.D. Porter Goff, International Conference on Fatigue and Crack Growth in ...
Fatigue design 2009 – November 25 & 26 – Cetim, Senlis - France
STUDY ON CRACK PROPAGATION IN TUBULAR JOINTS UNDER COMPRESSIVE FATIGUE LOADINGS C. Acevedoa, A. Nussbaumer a
a
ICOM-EPFL, Station 18, 1015 Lausanne, Switzerland
Abstract Large scale tubular truss beams, approximately of 9 m long and 2 m high, were tested under constant amplitude fatigue loading. The beams were made out of circular hollow sections of steel S355, welded to form a uni-planar truss with K-joints, in a shape common to bridge construction. The main goal of these tests was to focus on the fatigue behavior of the joints loaded in compression that is with chord in compression, one diagonal in compression and the remaining diagonal in tension. The tests showed, as in other studies, that fatigue cracks may develop in compressive stress field zones from applied loads due to the presence of large welding tensile residual stresses. An alternate current potential drop system was used to follow during the tests the crack development from the weld toes. This paper contains the results, presented in terms of number of cycles versus crack depth and crack growth rate, from the cracks that developed. In order to evaluate the level of residual stresses near the weld toes, both measurements by hole-drilling and neutron diffraction were carried out. This paper includes the first results of the residual stress field, more measurements being in progress. Among the interesting results, it was observed that crack initiation and growth occurred first from hot spot 1c (weld toe in-between the braces, compression brace side) until the crack reached about 2 mm deep. Then, the crack growth decreased and, simultaneously, a crack started to develop from hot spot 1 (tension brace side). Both crack continued to grow, the failure being triggered by a fatigue crack in a joint on the tension chord. Characteristics of the different cracks (shape, angle of propagation, etc.) are given in the paper. The S-N results are compared with previously obtained results on beams with different tube dimensions. 1
INTRODUCTION
Welded tubular bridges are particularly appreciated in bridge construction because they offer plenty of advantages, such as estheticism, transparency and clean lines. Moreover they are more feasible nowadays due to improvements in fabrication techniques. Nevertheless, the K-joints of this kind of bridge are susceptible to fatigue induced by traffic loadings. Fatigue cracking in welded joints is caused by the combination of four main parameters, which are now shortly described. Firstly, traffic loadings result in cyclic stress variations in the structure and its joints. A tubular truss joint is subjected to both normal and bending stress ranges, which can cause fatigue cracking. Secondly, welds are located at geometrical discontinuities where stress deviation occurs, implying stress concentration and thus stress ranges higher than the nominal ones. In complex geometries, stress concentration and fatigue crack location depends on many parameters. Schumacher [1] for example has shown that, in welded tubular K-joints, stress concentration locations and factors depend on the load case and the geometrical dimensions. Thirdly, the local weld geometry (toe angle, toe radius, welding imperfections) plays an important role in fatigue strength by creating local stress concentration effects. Several authors have measured the welding imperfections induced by the welding process in the vicinity of the weld toe. Barsoum [2] and Smith [3] have reported their results on non-load carrying fillet welded gusset plate (cruciform joint) made of carbon steel and welded respectively with MAG or laser/MAG process [2] and manual metal arc [3]. Smith described a single continuous “defect” at the weld toe (average depth of 4.5 µm, average root radius of 2.6 µm) with some imperfections presenting a depth above 0.1 mm. Barsoum shown that fatigue crack mostly grow from imperfection of 0.1 to 0.2 mm depth. Imperfection, implying high plastic strains, acts as a crack initiator meaning that there is almost no crack initiation phase in the fatigue life, thus the crack may start to propagate with the first load fatigue cycle. This has been shown by Schumacher [1], Nussbaumer & Borges [6] to occur in tubular joints. It has to be noticed that, as these depth values are within the tolerance range prescribed by Code ISO 5817 on welded joints (h ≤ 0.05.t ≤ 0.5 mm for weld quality B), we call them imperfections and not defects. Fourthly, tensile residual stresses induced by the welding process have detrimental effects on fatigue strength. They may suppress crack closure even under compressive applied stresses, thus increasing the effective stress range and the crack propagation rate.
1
Fatigue design 2009 – November 25 & 26 – Cetim, Senlis - France To improve failure prediction, a number of measurements of the residual stresses in tubular joints due to the welding process were undertaken in the 1980s by researchers at Cambridge University Payne & Porter Goff [4] on T-joints and Y-joints specimens. One of the major conclusions of these studies was that the mean longitudinal stresses (i.e. stresses parallel to the weld direction) obtained by sectioning never exceeded the material yield stress fy, by more than 20 N/mm2. Furthermore, mean transverse residual stresses (i.e. perpendicular to the weld direction) were never seen to exceed ~0.65· fy. In general, the transverse stress distribution is the most interesting since the principal stresses due to the applied loads, and thus fatigue cracks, also tend to be oriented perpendicularly (or transversely) to the weld direction. Under compressive loadings however, the direction of fatigue growth and cracking are difficult to predict without a good knowledge of the residual stress field. In Stacey et al. 2000 [5], measured longitudinal and transverse residual stresses are presented for a number of details (applicable to pipes or pressure vessels tubular structures including: T-butt joints, pipeto-endplate joints, tubular T-, and Y-joints. Stacey proposed residual stress distributions to model the residual stress due to welding in tubular joints. The pipes and pressure vessels tubes concerned by this study are thin cylinders with diameters ranging between 600 and 1000 mm, whereas tubes in bridges are often thick cylinders, called hollow sections, with diameters lower than 600 mm. From the above, it can be concluded that the first four main causes have already been studied on tubular K-joints. However, to the best of our knowledge, no data is available concerning threedimensional residual stresses in this kind of joints made out of thick hollow sections. In this paper, holedrilling and neutron diffraction measurements are presented. Based on the characterisation of residual stress distribution, fatigue results (crack shape, crack growth rate, S-N curve) are described and interpreted. 2
FATIGUE TESTS
2.1
Specimens description
Two large scale tubular truss beams (8.6 m long and 1.8 m height) were tested under fatigue loading. Figure 1 depicts the main dimensions and the Circular Hollow Sections (CHS) chosen for the truss girders. The test set-up consisted of a simple beam loaded by an actuator at the center of the upper chord with a load range of 550 kN (Qmax=610 kN, Qmin=60 kN) and a load ratio R= Qmin/Qmax of R = 0.1. The frequency of the sinusoidal fatigue load was of 0.7 Hz. The tests were carried out under load control, meaning that load range remained constant even if the deflection range changed due to fatigue cracking of the joints or other phenomena. The two specimens S6 and S7 were geometrically identical except for the thicknesses of their upper and lower chord (respectively 200 mm and 30 mm for S6, 30 mm and 20 mm for S7). The peculiar joints located at the supports positions and at the actuator position were of no interest for these tests; they were post-weld treated by needle-peening in order to prevent early cracking and dangerous collapse during the tests. 8620
Support South 1800
Support North
6500
2166
Figure 1: General truss beam elevation of specimens S6 and S7 with joint identification
Four series S1, S2, S3 and S5 using similar specimens with different chord and brace CHS profiles (see Table 1) were tested at ICOM by Schumacher [1] and Nussbaumer & Borges [6]. The specimens were fabricated and welded in the same conditions than real bridges. It can be seen in Table 1 that the nominal non-dimensional joint parameters θ, β, γ and τ of the test series specimens are similar to those of three existing tubular truss bridges in Switzerland. However, the parameter α of test series S3 to S7 is the double of the real bridges parameters α or, in other words, the slenderness of our specimens is greater than those of currently existing bridges. This difference is believed not to influence significantly the fatigue behavior but to modify slightly the bending to axial stress ratio in the joints.
2
Fatigue design 2009 – November 25 & 26 – Cetim, Senlis - France
Table 1: CHS dimensions and non-dimensional parameters of test series and three bridges in Switzerland CHS truss members are made of ferrite/pearlite carbon steel S355 J2H. Its mechanical properties are presented in Table 2. Tridimensional computer guided cutting were used to give to the brace extremity edge the shape of the outer contour of the chord. Then a fully penetrated weld has been applied using the Flux cored metal-arc welding (MAG process 136). Seven weld passes from the crown heel to the crown toe were produced. Young’s modulus E (N/mm2)
Poisson’s ratio
Yield stress (N/mm2)
Tensile strength (N/mm2)
Elongation %
210000
0.3
355 (t ≥16 mm) 345 (16 < t < 40 mm)
Min 470 Max 630
22
Table 2: S355 J2 H mechanical properties 2.2
Test equipment
The two specimens were equipped with several monitoring techniques: - Uni-axial strain gauges were glued on truss members in order to measure the nominal strain member repartition under static loadings, comprising axial strain (εax), in-plane bending strain (εipb) and out-ofplane bending strain (εopb). The last ones being most of the time negligible. The gauges were placed at a fixed distance from the joint (1.2D on the chord and 1.4d on the brace members), then measured strains were linearly extrapolated at the weld toe. Based on these extrapolated strains, axial stresses were calculated using the generalized Hooke’s law and assuming that strain in the axial direction is very important compared to strains in the two others directions:
σx =
E ⋅ε x 1 −ν 2
(1)
σx is the axial stress or the transversal stress, perpendicular to the weld toe. - Penetrant and magnetic inspection techniques were used to detect the first crack during fatigue test - Alternative Current Potential Drop (ACPD) was used to follow the crack depth evolution during a fatigue test. This technique is based on the fact that the current flows on the outer surface of the specimen and when it encounters a crack the current will follow the longer crack surface path. The potential drop between two probes is proportional to the distance between these probes. As a consequence, it is possible to calculate the crack depth of any surface crack occurring between the probes based on ACPD measurements. The ACPD equipment used during the test produced a current with a frequency of 5 Hz and an intensity of 75 A. It has to be noticed that the measurements are more accurate if the crack aspect ratios are low (a/2c < 0.1) and that the real crack depth depends also of its inclination angle known only when joint is opened-up. More information concerning this technique can be found in Nussbaumer & Borges [6]. Joint 5N (see Figure 1) of specimen S6 was equipped with 8 probes, joints 2 and 5N of specimen S7 with respectively 3 and 5 probes.
3
Fatigue design 2009 – November 25 & 26 – Cetim, Senlis - France - Ink and beach marking allowed marking the crack shape at a certain number of cycles. Both types of marks are investigated once the cracks are opened. Ink marking is obtained by spraying alcoholic ink into a crack, then by imposing some cycles in order to help the penetration of the ink and finally by letting the ink drying in the crack opened position. In series S6 and S7, joints 3N, 3S, 1 and 2 have been ink-marked after 90000 cycles. Beach mark is the mechanical way to mark the crack front by changing some fatigue loading characteristics. In our case, following Husset and al. [7] recommendations, the maximum load was kept identical with a load amplitude divided by two, meaning that maximum and minimum fatigue loads were Qmax=610 kN and Qmin=335 kN. This loading cycle was applied during 10000 cycles, and taken into account in the fatigue as 1250 cycles ((1/2)3 x 10000 cycles). Since a second ink marking can wash the mark made by the first one, beach-marking is often used as a second marking method. Indeed, joints 3N, 3S, 1 and 2 of the specimen S6 have been beach-marked after 140000 cycles. Since the fatigue test for specimen S7 ended before reaching 140000 cycles, beachmarking was not achieved for this specimen. - After testing, cracks were opened. The crack opening procedure consists in freezing joint sample in liquid nitrogen in order to break it in a brittle manner under dynamic loading using an actuator. The surface texture being different between the fatigue crack and the brittle crack, it is easy to measure the final fatigue crack dimensions. 2.3
Test results
2.3.1
Crack initiation location and critical joints
For both specimens S6 and S7, cracks propagated in all non treated joints (joints 1, 2, 3N, 3S, 5N and 5S) on tension side as well as on the compression side of the joints, for a total of 12 cracks per specimen. All these cracks occurred at the weld toe in-between the braces, from hot spot 1 for the tensile brace side or from hot spot 1c for the compressive brace side (see Figure 2), due to the combination of stress concentration, local weld Figure 2: Hot-Spot number or critical geometry and tensile residual stresses. crack location sites Moreover, in the first part of the tests, cracks propagated to be approximately of 2-3 mm depth at around 100000 cycles for specimen S6 and around 50000 cycles for specimen S7. Table 3 summed-up the crack shape dimensions for different fatigue cycles steps, marked by ink and beach-marking and read when the cracks were cut opened.
Crack depth Start d angle
2c
a
Table 3: fatigue crack definition and dimensions for specimen S6 and S7
4
Fatigue design 2009 – November 25 & 26 – Cetim, Senlis - France Finally, the critical crack was in the joint situated at the extremity of the lower chord (joints S6-3S and S7-3S). After 242000 cycles, the crack that started from the tensile brace weld toe of joint S6-3S propagated following a curved path until the backing ring crown toe, passing underneath the brace wall and weld, whereas in joint S7-3S the crack went strait through the 20 mm thickness of the chord after 111000 cycles. In order to explain these results, hot-spot stresses have been calculated. 2.3.2
Hot-spot stresses range Δσhs
From uni-axial strain gauges, the nominal member stresses were calculated and extrapolated to obtain nominal stresses at the weld toe. To include the effects of joint geometry and type of load, hot-spot stresses σhs at the weld toe have to be determined however they will not include local effects such as the weld shape and radius (notch effects). A. Schumacher [1] has proposed the following equation for the calculation of hot-spot stress in tubular joints:
σ hs ,i = σ ax _ br ⋅ SCFi ,ax _ br + σ ipb _ br ⋅ SCFi ,ipb _ br + σ ax _ ch ⋅ SCFi ,ax _ ch + σ ipb _ ch ⋅ SCFi ,ipb _ ch
(2)
where σhs,i is the hot-spot stress at location i, σax_br is the stress in the tension brace due to the axial brace force, SCFax_br is the stress concentration factor due to the axial brace force, and so on for the in-plane bending brace stress (σipb,br), the axial chord stress (σax,ch), and the in-plane bending chord stress (σipb,ch). Stress concentration factor were interpolated from design graph given in [1]. These factors have been proposed for joints 1 and 2 loaded under tension. Table 4 reports nominal and hot-spot stress ranges.
Table 4: Nominal and Hot-spot stress ranges at the weld toe In Table 4 it is seen that the calculated hot-spot stresses are lower that the nominal stresses and this trend seems to be linked with the chord wall thickness. We can argue that when the stress deviation occurs between a thin brace wall and a thick chord wall, there is an effect of “low pressure stress area” dropping the loaded stresses under the weld toe. Furthermore, it is also shown that the critical crack site does not correspond systematically to the site with the higher stress range. Even if we classify the crack from the greater to the smaller, it will not match with the ranking of the higher to the lower stress range. The logarithmical SR,hs-N curves (or Δσhs-N curves) are plotted in Figure 3 for test series S1, S2, S3, S5, S6 and S7 with a large database of CHS joints tested under fatigue and first analyzed by van Wingerde [8]. The data set comprises joints with thicknesses T from 6 to 40 mm, represented in Figure 3 with symbol sizes proportional to the thickness of the joint. The number of cycles N4 corresponds to the point at which there is a complete loss of the joint strength. Van Wingerde proposed an average ratio N4/ N3= 1.49 to calculate N4 from the number of cycles of the through-thickness cracking N3. If N3 is known for the critical joints S6-3S and S7-3S, it has been extrapolated (extrapolation of 2c versus N3) for the other joints. Moreover, to take into account the well-know size effect of the chord wall thickness, all the experimental hot-spot stress range have been corrected using the size effect correction determined by van Wingerde and al. (equation 3) in order to represent the fatigue strength of an equivalent 16mm thick joint. To compare these results to the design curved, the SR,hs-N curve for T=16mm (Detail category 114) has been added in the graph. S R ,hs ,T 16 10 3 < N 4 < 5.10 6 = ( ) n n = 0.06. log N 4 S R ,hs ,16 T (3) S R ,hs ,T 16 n =( ) n = 0.402 5.10 6 < N 4 < 10 8 S R ,hs ,16 T
5
Fatigue design 2009 – November 25 & 26 – Cetim, Senlis - France
Figure 3: IIW design curve and different test results including a size effect correction in order to translate results for a reference thickness of T=16 mm It can be seen that all corrected results fall above the design curve except joints S6-3N and S6-3S. It seems that size effect is not perfectly corrected, future investigations have to be done on proportional and non-proportional scaling. Our specimen’s results follow approximately the design specifications. 2.3.3
Crack propagation rate in joints under applied tensile/compressive loading
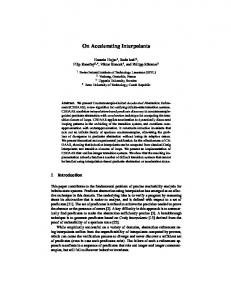
In order to focus our investigation on the reason why, in our tests, cracks propagate first in tensile joints as well as in compressive joints, although finally the critical crack sites always occur in the tensile joints. Thanks to ACPD measurements at different points along the weld toe (see Figure 4), we can compare the propagation rate between a crack situated on the tensile brace side (joint S6-5N+) and on the compressive brace side (joint S6-5N-). It is illustrated in Figure 4 that the propagation rate increases on the tensile side whereas it decreases, from the inflexion point corresponding to a crack depth of approximately 2mm, on the compressive side. Other ACPD measurements allowed us to record that the crack, in the chord loaded under compression, occur first from hot spot 1c (compressive brace side) and then form hot spot 1. However one cannot generalize this phenomenon because the crack detection depends if the voltage probes position is close to the crack initiation site or not.
d (mm)
d (mm)
Figure 4: Crack propagation rate versus crack depth of cracks (tensile brace side on the left, compressive brace side on the right) of joint S6-5N 3
RESIDUAL STRESS MEASUREMENTS
3.1
Hole-drilling method
This method is based on the stress relaxation induced by the drilling of a small hole (in our case 1.6 mm in diameter D0 for a depth of 2mm). Strain-gauge rosettes, glued around the hole before drilling, measure the relieved surface strains. Thus, from these relieved strains, it is possible to calculate the
6
Fatigue design 2009 – November 25 & 26 – Cetim, Senlis - France residual stress field present in the material before the hole was drilled. We have designed our own drilling system at ICOM in order to be adaptable to the curved surface and the narrow gap of K-joints. More information concerning this device is given by Acevedo [9]. The two-dimensional surface residual stresses measured on non-cracked joints using this method are presented in Figure 5. Measurements have be done on joints with different thicknesses (T=20mm or 30mm). Long
Transv Radial
Figure 5: Transversal and longitudinal residual stress data points at 2mm depth It is shown that transversal residual stresses perpendicular to the weld (grey envelope) are greater than longitudinal residual stresses parallel to the weld. As mentioned above in the introduction, this is not the case for all kind of tubular joints. It has to be highlighted that the orientation of the greater residual stresses is also the orientation of the applied load principal stresses, implying that they will superimposed. Moreover, it can also be seen that transversal residual stress value reaches the yield stress value of the material and that there is a strong restraining effect between the braces keeping transversal residual stresses at a high value. 3.2
Neutron diffraction method
It is the only non-destructive method allowing providing the tri-dimensional residual stress field through the depth of a sample (in steel, up to depths in the range of 3 to 6 cm). The neutron diffraction method allows to evaluate the average atomic lattice spacing of a small material volume (typically 1 to 8 mm3), spacing which changes as stresses deform the atomic material grid. As a consequence, if the lattice spacing under stress-free conditions is known, the strain can be calculated. Neutron diffraction measurements were performed with the POLDI instrument at the Paul Scherrer Institute (Villigen, Switzerland) and with SALSA at the “Institut Laue-Langevin” (Grenoble, France). Main results, expressed in terms of streses, are depicted in Figure 6, showing the transversal, longitudinal and radial stress mappings along the axial line between the two welds and in depth until 15mm. These results are in really good agreement with the measured hole-drilling transversal and longitudinal residual stresses, with the same compressive longitudinal residual stresses in the center of the gap between the brace welds (shown on the left on Figure 6). Radial residual stresses are also tensile residual stresses.
Weld toe Position
σtransv
σlong
σradial
Figure 6: Transversal, longitudinal and radial residual stress mappings
7
Fatigue design 2009 – November 25 & 26 – Cetim, Senlis - France 3.3
Correlation between fatigue test results and residuals stress measurements
With tri-dimensional residual stress measurements, one can draw the distribution of residual stresses from the weld toe into the depth (see Figure 7). It is clear that there is an important decrease of transversal residual stresses from 2 mm depth, explaining why propagation rate in compressive joints suddenly decrease at this depth in Figure 4. The propagation rate decrease can be directly linked with the effective stress range decrease, meaning tensile residual stress are not high enough anymore to keep the crack tip faces opened during the entire stress cycle.
Figure 7: 3D residual stresses distribution at the weld toe 4
CONCLUSIONS AND FUTURE WORK
Hole-drilling and neutron diffraction measurements have be used successfully in the assessment of residual stress field. It has been shown that residual stress magnitude change in a particular important way in the first 3 mm depth. Fatigue tests S6 and S7 have proven the important influence of welding residual stresses allowing crack to propagate in compressive joints and modifying the path of the crack. Future work will be devoted to the quantification of the influence of residual stresses with numerical parametric studies. 5
ACKNOWLEDGEMENTS
This research has been funded by the Swiss National Science Foundation (SNF). The Circular Hollow Section tubes were provided by Vallourec & Mannesmann, and the specimens S& and S7 were fabricated and welded by Zwahlen & Mayr (Switzerland). Neutron diffraction facilities were offered by the Paul Scherrer Institute (Villigen, Switzerland) and by the “Institut Laue-Langevin” (Grenoble, France). Measurements were carried out thanks to the great help of A. Evans (POLDI, PSI) and D. J. Hughes (SALSA, ILL). 6
REFERENCES
[1] A. Schumacher, S. Sturm, S. Walbridge, A. Nussbaumer, M.A. Hirt, Fatigue design of bridges with welded circular hollow sections. Report ICOM 489E, EPFL, Lausanne, 2003. [2] Z. Barsoum, J. Samuelsson, Research International, 77 (12), 2006, 882-888 [3] I.F.C. Smith, R.A. Smith, Fatigue of Engineering Materials and Structures, 5 (2), 1982, 151-165 [4] J.G. Payne, R.F.D. Porter Goff, International Conference on Fatigue and Crack Growth in Offshore Structures, I.Mech.E, C134/86, 1986, 109-116 [5] A. Stacey, J.-Y. Barthelemy, R.H. Leggatt, R.A. Ainsworth, Incorporation of Residual Stresses into the SINTAP Defect Assessment Procedure, Eng Fr Mech 67, 2000, 573-611 [6] A. Nussbaumer, L. Borges, International Symposium on Tubular Structures ISTS12, 2008 [7] J. Husset, L. Lieurade, F. Maltrud, M. Truchon, Fatigue crack growth monitoring using a crack front marking technique, Welding in the world, 1985, 276-282 [8] A.M. van Wingerde, D.R.V. van Delft, J. Wardenier, J.A. Packer, Scale Effects on the Fatigue Behaviour of Tubular Structures, WRC Proc., 1997 [9] C. Acevedo, A. Nussbaumer, Residual stress estimation of welded tubular K-joints under fatigue loads, 12th International Conference on Fracture, T12.001, 2009
8