Superresolution microscopy using common-path phase-shifting interferometry Vicente Micó1, Zeev Zalevsky2, Javier García3, AIDO-Technological Institute of Optics, Colour and Imaging, C/Nicolás Copérnico 7, Apartado 139, 46980 Paterna, Valencia, Spain (
[email protected]) 2 School of Engineering, Bar-Ilan University, Ramat-Gan, 52900, Israel (
[email protected]) 3 Depto. de Óptica, Universitat de Valencia, C/Dr.Moliner,50, 46100, Burjassot, Spain (
[email protected]) 1
ABSTRACT In this contribution, we present a new approach aimed to achieve superresolution in digital holographic microscopy that overcomes the limitations imposed by the Abbe’s diffraction limit. Based on time multiplexing and off-axis illumination, a common-path interferometric architecture allows the synthesis of an enlarged aperture that expands the cutoff frequency of the conventional imaging system. Complex object amplitude distribution is recovered using an extremely simple phase-shifting configuration instead of image plane off-axis holographic recording. As a consequence, the setup becomes easy-to-configure (less requirements and lower number of optical elements) and it is useful for practical implementation in microscopes while only simple modifications are required (no higher magnifications are needed to resolve the interference pattern at the CCD plane). Experimental results validating the capabilities of the presented approach when a low numerical aperture commercial microscope objective is used as imaging lens are included using both a synthetic object (high resolution USAF test target) and a biosample (red blood cells) as objects under test. Keywords: Superresolution, Image processing, Digital holographic microscopy. 1. INTRODUCTION The resolution of an optical imaging system can be defined as the minimal separation distance of fine details in the object that can still be resolved in the image. Three main factors limit the resolving power of an imaging system: diffraction, finite size of the detector pixel and noise. In particular, the resolution limit imposed by diffraction can be defined as function of the numerical aperture (NA) of the imaging system and the wavelength (λ) of the illumination light1. This limit can reach the λ maximum value for air immersion imaging systems under coherent illumination, and can only be surpassed by coupling evanescent waves2-5 or by using strong non-linearities at subwavelength scale6-8. For the case of low NA lenses, there are two obvious ways to improve the resolving power: by decreasing the illumination wavelength and/or by increasing the NA of the imaging system. Unfortunately, these strategies are not always possible due to practical considerations. Then, the aim of superresolution effect can be understood as an improvement in the resolving power of the imaging system by encoding-decoding process of the input’s object optical information. Having in mind this interpretation, time multiplexing superresolution can be applied to a certain class of objects named as temporally restricted9-12. The main property of such time invariant objects is the possibility to encode their spatial information into the temporal degree of freedom. Thus, a superresolved image with wider spatial-frequency coverage can be obtained by time multiplexing the input signal and without changing the illumination wavelength or the imaging lens10,13-15. In that sense, one of the most attractive application fields of time multiplexing superresolution is given in microscopy16-28. Moreover, superresolved digital holographic microscopy20-28 is a nowadays-widely-used technique due to the possibility to recover not only the object amplitude distribution but also the phase one. To allow this, off-axis holographic recording21-28 or phase-shifting techniques29-31 must be employed.
Optical and Digital Image Processing, edited by Peter Schelkens, Touradj Ebrahimi, Gabriel Cristóbal, Frédéric Truchetet, Proc. of SPIE Vol. 7000, 700002, (2008) · 0277-786X/08/$18 · doi: 10.1117/12.780719
Proc. of SPIE Vol. 7000 700002-1 2008 SPIE Digital Library -- Subscriber Archive Copy
Common-path interferometry (CPI) is a well-known technique proposed mainly to recover phase information32-37. The main advantages of CPI are the robustness and the simplicity of the system due to the low number of needed optical elements, and the relatively insensibility to vibrations. These facts imply that CPI becomes more stable than other interferometric configurations. Recently, Mico et al had extended the usage of CPI to the field of time multiplexing farfield superresolution in digital holographic microscopy22. The CPI architecture was performed by side-by-side placing a reference diffraction grating to the object at the input plane. If the period of such grating is matched with the collimated off-axis illumination angle and with the NA of the microscope lens, additional frequency band-passes of the object’s spectrum is recovered using off-axis holographic recording at the image plane. To perform such recording, another grating is used to split the image beam into multiple ones. But the basic frequency and the position of such imaging grating must be adjusted in order to ensure the correct overlapping between reference and imaging beams, and to avoid overlapping of the diffraction orders in the off-axis recorded hologram. In this paper, we decrease the requirements of the imaging grating while a simplified phase-shifting interferometric configuration is used instead of the off-axis holographic recording. The presented phase-shifting configuration can be applied in CPI provided that a diffraction grating can be placed at the Fourier plane of the system. In such case, phaseshifting interferometry is obtained by moving the grating in subperiod displacements and phase-shifting standard algorithms38 can be applied to recover phase object distribution. With this configuration, the only condition that should be fulfilled by the imaging grating is the correct overlapping of the reference and imaging beams (because phase-shifting is performed in on-axis mode). Moreover, the resolution requirements of the detector are also relaxed because no higher carrier frequency is introduced in the holographic recording. The paper is organized as follows. Section 2 provides an intuitive and theoretical analysis of the experimental setup. Section 3 includes experimental results for synthetic object (USAF resolution test target) and biosample (human red blood cells) that validate the presented approach. And finally, Section 4 concludes the paper.
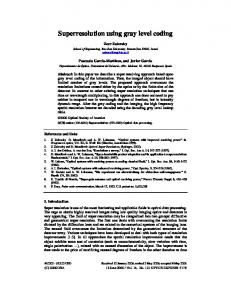
2. QUALITATIVE AND QUANTITATIVE ANALYSIS OF THE EXPERIMENTAL SETUP The optical experimental configuration is depicted in Figure 1 where a two-dimensional (2-D) point source array is used as spherical illumination over the input plane. In our approach, an infrared 2-D Vertical Cavity Surface Emitting Laser (VCSEL) array is used in which the single elements are turned on sequentially. Thus, the input plane is illuminated with a set of different off-axis divergent illumination beams. This procedure allows the transmission of different 2-D frequency space coverage through the limited system aperture in sequential mode. Thus, the approach presented in this contribution performs superresolution effect by time multiplexing (the process is performed in sequential mode) and with field of view restrictions (part of the input plane is occupied by the reference grating). ASE-SrPIGThxAGG GBAIG FL 4SE
PLACED AT THE FOLRIER PLANE
t
MTCROSCOPE
VCSEL
OBJECTIVE
ARRAy
INPLT PLANE:
x SAMPLE WITH REFERENCE GRATING IN SIDE By SIDE COXFIGLRATION
ho
Figure 1. Proposed common-path phase-shifting interferometric setup
Proc. of SPIE Vol. 7000 700002-2
Two contiguous regions placed in side-by-side configuration compose the input plane: the sample under test and a 2-D grating (named as reference grating). In this configuration, a microscope lens images the input plane amplitude distribution over a CCD. As the input plane is divided in two contiguous regions, at the Fourier plane we will obtain the corresponding frequency band-pass of the object’s spectrum selected by the illumination source in addition with a DC term incoming from such used source. This DC term means a spherical truncated illumination beam at the image plane that will not overlap with the image of the sample at the image plane. To allow digital holographic recording process, a one-dimensional (1-D) grating (named as imaging grating) is placed after the microscope lens and two recording options are possible: off-axis or on-axis recording process. The first one is produced when the imaging grating is well-placed somewhere between the microscope lens and the CCD in off-axis holographic recording configuration. In this case22, the different hologram orders must be non-overlapped to recover complex amplitude distribution of the imaged object,. This implies a high frequency interferometric pattern over the CCD. To be sure that such pattern is resolved by the CCD pixel size, a high magnification must be introduced in the imaging system. This can be accomplished by increasing the distance between the CCD and the objective lens or by adding a magnification imaging system in the optical setup. On the other hand, the second case is related with the placement of the imaging grating just at the Fourier plane, that is, at the image plane of the 2-D array through the microscope lens. Assuming that such imaging grating is properly selected (as we will see in Section 3), the interferometric imaging recording process is produced in on-axis mode between the direct image of the object under test and a reference beam incoming from the DC term. Moreover, as the reference beam in the holographic recording is obtained from the first diffraction order of the imaging grating, it is possible to produce phase shifting of the reference beam by stepping the imaging grating. Then, there is no need to image high frequency patterns because of the recovery of amplitude and phase information is performed in on-axis mode using phase-shifting technique. Figure 2 depicts this situation when on-axis illumination case is considered. The CCD must be placed where the sample is imaged in absence of the imaging grating. After that and by inserting the imaging grating, an on-axis hologram between the direct image (zero order of the imaging grating) and an on-axis reference beam (–1 diffraction order of the imaging grating) is recorded by the CCD. REFERENCE BEAM RAYTRACING -1 DIFFRACTION
ORIFR +1 DIFFRACTION ORDER
ZERO ORDER
IMAGING BEAM RAYTRACING
F*!
BANDPASS OBJECT SPECTRUM
Figure 2. Reference and imaging beam raytracings in the proposed setup. At the CCD, -1 diffraction order and zero order for reference and imaging beam respectively perform holographic recording.
When off-axis illumination is produced over the input plane, an imaging beam that carries additional 2-D frequency space coverage of the sample is now diffracted on-axis and can pass through the system’s aperture. In a similar way and assuming that the oblique illumination angle is well adjusted with the NA of the microscope lens and the basic frequency of the reference grating, a reference beam is directed towards the microscope lens by diffraction in the 2-D reference grating. Similar phase-shifting recording process allows the recovering of this additional frequency band-pass of the object’s spectrum. Thus, it is possible to extend the resolution limit defined by the aperture of the system after applying a
Proc. of SPIE Vol. 7000 700002-3
digital post processing stage in which each one of the 2-D recovered frequency bands are assembled into one. This means the generation of a synthetic aperture that expands the 2-D frequency space coverage of the microscope lens. Finally, a superresolved image can be recovered by simple Fourier transformation of the information contained in the previously generated synthetic aperture. Just to provide an easy understanding in the theoretical analysis, the optical system depicted in Fig. 3 will be considered. Note that the only difference between the setups showed in Figs. 1 and 3 is the image magnification of the microscope lens. In this configuration, spherical point illumination incoming from a 2-D VCSEL source array illuminates the input plane in sequential mode. Eq. 1 provides the amplitude distribution at the input plane after being illuminated with a given spherical source that is originated at a point of coordinates (xS , yS) of the source plane and at z distance in front of the input plane ⎡ ⎛ x − µ0 y ⎞ ⎛ x + µ0 y ⎞ ⎤ U IP ( x, y ) = ⎢t ( x, y ) rect ⎜ , , ⎟ + ∑ CnCm exp {− j 2πν 0 ( nx + my )} rect ⎜ ⎟⎥ (1) ⎝ ∆µ ∆µ ⎠ n,m ⎝ ∆µ ∆µ ⎠ ⎥⎦ ⎢⎣ k 2 2 ⎫ ⎧ A exp ⎨− j ⎡( x − xS ) + ( y − yS ) ⎤ ⎬ ⎣ ⎦⎭ ⎩ 2z being t ( x, y ) = t ( x, y ) exp ( iφ0 ( x, y ) ) the object’s complex amplitude distribution function defined from t ( x, y ) and
φ0 ( x, y ) as its real amplitude and phase distributions respectively, (x, y) the spatial coordinates, k is the wave number of the illumination wavelength, (n, m) the diffraction orders of the 2-D generalized reference grating, and (Cn , Cm) and ν0 are the amplitude coefficients and the basic frequency of the 2-D reference grating in both X and Y directions respectively. Rect is the rectangle function that limits the sizes of the object and the reference grating positioned at the input plane as it can be seen from Fig. 1. Obviously, the rectangle that limits the extension of the input object is centered at µ0 position while the corresponding to the reference grating is placed at -µ0 position (both have the same ∆µ height and width). 10
IXPLI
VCSEL
PLANE
PHASE-SifiFTIXO GR1TIXG AT THE FOLRIER PLANE
ARRAy
4
-4
F
F
V •- -4
F
F
Figure 3. Simplified optical setup used to analyze the mathematical foundation of the presented approach.
In this configuration, the first lens in Fig. 3 performs Fourier transformation of the input plane amplitude distribution onto its focal image plane, where a 1-D imaging grating is placed. The amplitude distribution at the system Fourier plane equals to ⎛ ρ ⎞ (2) U FP (u, v ) = FT {U IP ( x, y )} circ ⎜ ⎟ ∑ B p exp { j 2π pν ' u} ⎝ ∆ν ⎠ p being (u,v) the spatial-frequency coordinates, and ρ the polar coordinate in the frequency domain that is defined as
ρ = u 2 + v 2 . The circ function represents the limited system’s aperture with a width of ∆ν, and (BP ,ν’) are the amplitude coefficient and the basic frequency of the imaging grating, respectively. After that, the second lens performs a second Fourier transformation between Fourier and output planes. Leaving aside constant factors, the final amplitude distribution provided by the imaging system at the system’s output plane is proportional to (3) U OP ( x ', y ' ) = U IP ( − x ', − y ' ) ⊗ disk ( ∆ν r ) ⊗ ∑ δ ( x '− pλ Fν ' ) p
Proc. of SPIE Vol. 7000 700002-4
where disk(∆ν r) is the point spread function (PSF) of the 4F processor, r is the polar coordinate that is defined as r = x '2 + y '2 , and λF the scale factor of the second Fourier transformation. In a similar way that in Ref. [22], we must properly adjust the off-axis positions (xS ,yS) of the point sources with the basic frequency (ν0) of the reference grating and with the radius (∆ν) of the system’s aperture. Assuming that this fact is fulfilled (see Ref. [22]), the most important fact in Eq. (3) is the last convolution with the delta function incoming from the imaging grating which means that the transmitted band-pass image is replicated at the output plane. To allow correct overlapping between imaging and reference beams, it is necessary that 2µ (4) ν'= 0 λF that is, the separation between the replicas generated by the imaging grating at the output plane must be equal to the separation between the two regions that compose the input plane. In the case of using a microscope lens instead of a unit magnification imaging system, the magnification power or the microscope lens must be taken into account. In any case, Eq. (4) defines the basic frequency of the 1-D imaging grating. In this case, the CCD images an on-axis hologram where no bias carrier frequency between both interferometric beams is generated. In order to recover both amplitude and phase distributions of the transmitted frequency band-pass, a phaseshifting method is applied. Conceptually and under these conditions, the intensity distribution recorded at the CCD at a given instant t and due to a generic point source originated at (xS , yS) position comes from the addition of the imaging beam (band-pass image selected by such source convolved with the PSF of the imaging system) and an on-axis reference beam due to the imaging grating 2
2π ⎛ j [ xS x ' + y S y '] ⎞ j φ ( x , y ) +φm ( t )] (5) I OP ( x ', y ', t ) = ⎜ t ( − x ', − y ') e λ z ⎟ ⊗ disk ( ∆ν r ) + C e [ S ⎜ ⎟ ⎝ ⎠ where C is a constant related to the real amplitude of the reference beam, φS is the initial phase difference between imaging and reference beams which is directly related with the transmitted phase distribution of the object band-pass due to the source placed at (xS , yS), and φm is the linear phase increment introduced in time between two subsequent intensity images. Note that linear phase variation in time is assumed and the spherical phase factor, common to both interferometric terms and related with the convergence of both beams, has been removed. Also, as the object’s amplitude distribution function t(x, y) is complex, both amplitude and phase distributions of the input object are limited by the PSF of the imaging lens.
By knowing that the time dependence of the recorded intensity can be expressed as a function of the intensity image number m multiplied by the phase step between two consecutive images (φm=mφK) and taken the different intensity distributions in time sequence, Eq. (5) can be rewritten as 2
m I OP
2π ⎛ j [ xS x ' + y S y '] ⎞ ⎟ ⊗ disk ( ∆ν r ) + C 2 ( x ', y ', tm ) = ⎜⎜ t ( − x ', − y ') e λ z ⎟ ⎝ ⎠
(6)
2π ⎡⎛ ⎤ j [ x S x ' + y S y '] ⎞ +2C Re ⎢⎜ t ( − x ', − y ') e λ z ⎟ ⊗ disk ( ∆ν r ) ⎥ cos (φS + m φk ) ⎟ ⎢⎣⎜⎝ ⎥⎦ ⎠ After that and by using phase-shift algorithm and computing the different intensity distributions stored by the CCD, it is possible to recover each transmitted phase distribution φS(x,y) of the input object due to each (xS , yS) illumination source38. In particular, we have applied a method that takes into account m intensity images in one phase-shift period and permits the recovering of the initial phase distribution according to m ⎡ 2π ⎤ − ∑ I i ( x, y ) sin ⎢ ( i − 1) ⎥ ⎣m ⎦ (7) φS ( x, y ) = arctan mi =1 2 π ∑ Ii ( x, y ) cos ⎡⎢⎣ m (i − 1)⎤⎥⎦ i =1 The previous described procedure allows us to recover the phase distribution, and therefore the object’s complex amplitude, of each one of the frequency bands transmitted through the system’s aperture when illumination incoming
Proc. of SPIE Vol. 7000 700002-5
from the position (xS , yS) in the 2-D VCSEL array is considered. In addition to this and in order to achieve superresolution effect, different off-axis source positions must be lighted on in sequential mode and every frequency band-pass must be sequentially recovered. After that and by properly placing them on its original position, a wider spectral content of the object’s spectrum can be fully reconstructed in terms of synthetic aperture generation. Thus, provided that there will be a diffraction order in the 2-D reference grating for each 2-D VCSEL source position, any synthetic aperture can be shaped.
3. EXPERIMENTAL RESULTS In this Section, we include the results when the proposed setup is used to obtain superresolution in two different types of samples: a positive high-resolution USAF test target and a red blood cell biosample. For the first case, a commercial low NA microscope objective (0.1NA Nikon lens) images the USAF test over a CCD camera (Kappa, 12bits). Light coming from a 2-D VCSEL array (λ=850µµm, ±15 degrees beam divergence) is used as point source illumination in sequential mode. For the experimental validation of the proposed approach, sequential oblique illumination is provided by moving a single VCSEL source to the off-axis positions. A 2-D holographically recorded diffraction grating (6 µm basic period) is used as reference grating. As imaging grating, a 1-D Ronchi ruling grating (80 lp/mm) is used. The phase-shifting process is performed using the Newport translation stage (model ESP300) and storing holograms with a linear step of 0.5 µm. As the period of the imaging grating is 12.5 µm, 25 consecutive images will be considered in a full cycle when phase-shifting algorithm is used to recover each one of the frequency band-passes recorded in time sequence. The offaxis illumination angles produced over the input plane are approximately 8.5 degrees. Taking this value into account, the generated synthetic numerical aperture reaches the 0.25 theoretical value. A representative set of recovered frequency bands (central band and a quadrant of elementary pupils) after phase-shifting procedure are depicted in Fig. 4(a)-(b)-(c)-(d) cases. All of them, together with the rest of the recovered frequency bands, are filtered and replaced in their original position at the object’s spectrum, allowing the generation of the synthetic aperture [Fig. 4(e)]. The exposure time for the different single holograms is 8 ms for the central band, 55 ms for the horizontal and vertical off-axis bands, and 175 ms for the oblique off-axis bands.
Figure 4. Recovered elementary pupils [(a)-(b)-(c)-(d)] and generated synthetic aperture (e).
A bright spot can clearly be seen in the recovered frequency band-passes represented in (b) case. It corresponds with the DC term of the holographic recording process (it is placed at the center of the object’s spectrum) and is due to delta function representative of the reference beam. The fact that the bright spot do not appear in (a), (c) or (d) cases do not means that it does not exist: it has lower intensity than the recovered frequency band and it is not visible. This bright spot is smooth down in the generation of the synthetic aperture by digital post-processing in order to obtain a lower distorted
Proc. of SPIE Vol. 7000 700002-6
final superresolved image. Also, the overlapping areas between different elementary pupils are equalized to avoid final distortion in the superresolved image.
——I
& —
- -;
•
-.
-C-.4
•
•
7
—
——
c_li
-.-
m:L;•_ ''"I'r.--..
'4
rJ
—
__ __I
—
__
in
—
0I
a =— — —
— —
Once the synthetic aperture is generated [Fig. 4(e)], a superresolved image can be obtained by Fourier transformation of the information contained on it. Fig. 5(a) shows the low-resolution amplitude image of the USAF test obtained using phase-shifting in the presented configuration when on-axis illumination is considered, and Fig. 5(b) depicts the superresolved image obtained using our approach. We can see as the 7.8 µm resolution limit (Group 7, Element 1) provided in the low resolution image is reduced to 3.1 µm (Group 8, Element 3) in the superresolved image case. A resolution gain factor of 2.5 is achieved, which is in good agreement with the theoretically expected value.
Figure 5. (a) low-resolution image obtained by Fourier transformation of the recovered frequency band-pass depicted in Fig.4(c), and (b) superresolved image obtained by Fourier transformation of Fig. 4(e).
For the second object tested using the presented approach, a red blood cells biosample is used. Once again, the 2-D VCSEL array and the 0.1NA Nikon lens are used. In this case, we want to achieve a resolution gain factor of 3 not only in the vertical and horizontal directions but in the full 2-D frequency space. Thus, the setup is the same as in the previous case but a 1-D Ronchi ruling grating is considered as reference grating instead of using a 2-D holographic one. This 1-D grating is rotated according with each one of the oblique illuminations produced over the input plane to ensure reference beam at the output plane. The basic period of the reference grating is 5 µm (200 lp/mm) and the angle defined by the oblique illumination over the input plane is near 10 degrees. This fact means that a quasi-contiguous frequency band is diffracted through the system aperture because the angle defined by the NA of the microscope lens is 5.74 degrees (that is, near the half angle of the off-axis illumination). So, a resolution gain factor close to 3 should be achieved in every offaxis illumination direction. Fig. 6 images the eight off-axis frequency bands recovered after apply phase-shifting procedure (nine rectangles marked with white line at the left side) and the synthetic aperture (right side) that is generated by replacing the different frequency bands to its original positions at the object’s spectrum. The exposure time for the single different holograms is 11 ms for the central band and 44 ms for the off-axis bands. The highest intensity at the border of the different off-axis band-passes symbolizes the overlapping region with the central frequency band, as we can also visualize in the synthetic aperture. This overlapping avoids the achievement of a resolution gain factor of 3 but allows the full 2-D frequency space coverage without remaining of any uncovered regions between the different frequency bands. Once again, a superresolved image of the biosample is obtained by Fourier transformation of the information contained in the synthetic aperture. Fig. 7 images the superresolved images in comparison with the low-resolution ones. Aside an impressive superresolution effect one may see a dark point in the center of each red blood cell. This black point is originated by diffraction at the center of the cells due to the typical donut-like shape of the red blood cells.
Proc. of SPIE Vol. 7000 700002-7
Figure 6. The nine recovered elementary pupils (left side): on-axis (central rectangle) and eight off-axis frequency bands (exterior rectangles), and the generated synthetic aperture (right side).
(a)
(b)
•
I'
(c)
4
50 µm A
(d)
(e)
(f)
50 µm
Figure 7. (a) Low-resolution amplitude image recovered using phase-shifting and on-axis illumination, and (b) and (c) its real part and phase distributions, respectively. (d) Superresolved amplitude image using the presented approach, and (e) and (f) its superresolved real part and phase distributions, respectively.
Proc. of SPIE Vol. 7000 700002-8
As we have previously seen, phase information is also superresolved. So, a quantitative phase superresolved imaging can also be obtained. This means that three-dimensional (3-D) information of the sample under test is also achievable because it is inherent to the phase information map. Fig. 8 depicts the unwrapped phase distributions corresponding with the low resolution and superresolved images presented in Figs. 7(c) and (d). Aside the superresolution effect, a quantitative way for high-resolution phase imaging is obtained.
Figure 8. 3-D representations of the unwrapped phase distributions for low-resolution (up and left) and superresolved (down and right) cases. The represented areas are lower than that depicted in Fig. 7 for better visualization of the achieved superresolution effect.
4. DISCUSSION AND CONCLUSIONS A modification of the approach presented in Ref. [22] has been presented. The strong point of the new setup lies in the usage of an ultra-simple new configuration aimed to achieve superresolution effect using phase-shifting in a commonpath interferometric architecture. Also, the illumination is spherical rather than collimated while we have used the presented approach for experimental demonstration for both a synthetic object (USAF test target) and a biological sample (human red blood cells). This new setup has the advantage that no higher frequency pattern is produced at the output plane because phase-shifting allows holographic recording in on-axis mode. As a consequence, the setup becomes easy-to-configure (less requirements and lower number of optical elements) and it is useful for commercial implementation in microscopes while only simple modifications are required (no higher magnifications are needed to resolve the interference pattern at the CCD plane). Although the proposed setup has been experimentally demonstrated for a low NA microscope lens, the configuration is also valid for medium NA lenses by properly adjusting the main parameters involved in the coding stage of the experimental setup, that is, illumination angle and wavelength, NA of the objective lens, and the basic frequency of the reference grating. The point for medium NA objectives is that the imaging grating could be placed at the system’s Fourier plane. In the case when high NA lenses are considered, the imaging grating can not be placed just at the Fourier
Proc. of SPIE Vol. 7000 700002-9
plane because this plane is often inside the own microscope objective. Then, off-axis interferometric recording will be produced over the CCD. As best situation in such case, the imaging grating can be placed just after the mount lens and the axial distance between the imaging grating plane and the Fourier plane is too short in most of the cases. This short distance implies that the fringe pattern will have a high spatial period and can be resolved by the CCD pixel size without any other additional strategy. But due to the high spatial period, the diffraction orders of the recorded hologram are overlapping one with the others and no access to the phase distribution is allowed. Therefore, phase-shifting technique is needed to recover the phase distribution of the sample. So, this approach will be useful not only for low-medium NA lenses but also for medium-high NA ones. In our approach, off-axis illumination produces a shift in the object’s spectrum and permits the transmission through the system’s aperture of new additional frequency band-passes that are not transmitted in a conventional illumination mode. The oblique illumination is performed using an array of coherent sources that are incoherent one with each other. This VCSEL array allows recording of each band-pass in a short time due to its high optical power per every emitter. Additionally, the digital post processing associated with the generation of the superresolved image is simple and fast, as it only requires simple and linear digital operations. Additional advantages of the proposed method come from the common-path interferometric architecture because the system is more robust, stable and simple than other interferometric configurations. Also, the fact that the imaging and the reference beams follow nearly the same optical path awards the experimental setup with two main advantages: On one hand, the instabilities of the system, due to mechanical or thermal changes on both optical paths, do not affect the obtained results. On the other hand, low coherence length light sources are suitable to be used as illumination.
ACKNOWLEDGMENTS The authors want to thank Professor Francisco Javier Perucho Lizcano for the red blood cells biosample preparation. Also, part of this work was supported by the Spanish Ministerio de Educación y Ciencia under the project FIS200760626.
REFERENCES 1. 2. 3. 4. 5. 6. 7. 8. 9. 10. 11. 12. 13.
E. Abbe, “Beitrage zur theorie des mikroskops und der mikroskopischen wahrnehmung,” Arch. Mikrosk. Anat. 9, 413-468 (1873). D. Courjon, Near-Field Microscopy and Near-Field Optics (Imperial College Press, London, 2003). E. Betzig, J. K. Trautman, T. D. Harris, J. S. Weiner, and R. L. Kostelak, “Breaking the Diffraction Barrier: Optical Microscopy on a Nanometric Scale,” Proc. Natl. Acad. Sci. USA 251 (5000), 1468-1470 (1991). E. Betzig and J. K. Trautman, “Near-Field Optics: Microscopy, Spectroscopy, and Surface Modification Beyond the Diffraction Limit,” Proc. Natl. Acad. Sci. USA 257 (5067), 189-195 (1992). Z. Liu, S. Durant, H. Lee, Y. Pikus, N. Fang, Y. Xiong, C. Sun, and X. Zhang, “Far-Field Optical Superlens,” Nano Letters 7(2), 403-408 (2007). R. Heintzmann, T. M. Jovin, and C. Cremer, “Saturated patterned excitation microscopy – a concept for optical resolution improvement,” J. Opt. Soc. Am. A 19, 1599-1609 (2002). M. G. L. Gustafsson, “Nonlinear structured illumination microscopy: wide-field fluorescence imaging with theoretically unlimited resolution,” Proc. Natl. Acad. Sci. USA 102, 13081-13086 (2005). M. Hofmann, Ch. Eggeling, S. Jakobs, and S. W. Hell, “Breaking the diffraction barrier in fluorescence microscopy at low light intensities by using reversibly photoswitchable proteins,” Proc. Natl. Acad. Sci. USA 102, 17565–17569 (2005). W. Lukosz, “Optical systems with resolving powers exceeding the classical limits,” J. Opt. Soc. Am. 56, 1463-1472 (1966). W. Lukosz, “Optical sytems with resolving powers exceeding the classical limits II,” J. Opt. Soc. Am 57, 932-941 (1967). G. Toraldo di Francia, “Degrees of freedom of an image,” J. Opt. Soc. Am. 59, 799-804 (1969). I. J. Cox and J. R. Sheppard, “Information capacity and resolution in an optical system,” J. Opt. Soc. Am. A 3, 11521158 (1986). M. Françon, “Amélioration the résolution d’optique,” Il Nuovo Cimento Suppl. 9, 283-290 (1952).
Proc. of SPIE Vol. 7000 700002-10
14. Z. Zalevsky and D. Mendlovic Optical Super Resolution, Springer (2002). 15. V. Mico, Z. Zalevsky, P. García-Martínez and J. García, “Single Step Superresolution by Interferometric Imaging,” Optics Express 12, 2589-2596 (2004). 16. X. Chen and S. R. J Brueck, “Imaging interferometric lithography: approaching the resolution limits of optics,” Opt. Lett. 24, 124-126 (1999). 17. M. G. L. Gustafsson, “Surpassing the lateral resolution limit by a factor of two using structured illumination microscopy,” J. Microsc. 198, 82-87 (2000). 18. R. Heintzmann and P. A. Benedetti, “High-resolution image reconstruction in fluorescence microscopy with patterned excitation,” Appl. Opt. 45, 5037-5045 (2006). 19. C. J. Schwarz, Y. Kuznetsova and S. R. J. Brueck, ”Imaging interferometric microscopy,” Opt. Lett. 28, 1424-1426 (2003). 20. J. García, Z. Zalevsky, and D. Fixler, "Synthetic aperture superresolution by speckle pattern projection," Opt. Express 13, 6073-6078 (2005). 21. V. Mico, Z. Zalevsky, P. García-Martínez and J. García, “Superresolved imaging in digital holography by superposition of tilted wavefronts,” Appl. Opt. 45, 822-828 (2006). 22. V. Mico, Z. Zalevsky, and J. García, “Superresolution Optical System by Common-Path Interferometry,” Opt. Express 14, 5168-5177 (2006). 23. V. Mico, Z. Zalevsky, P. García-Martínez and J. García, “Synthetic Aperture Superresolution Using Multiple Offaxis Holograms,” J. Opt. Soc. Am. A 23, 3162-3170 (2006). 24. Y. Kuznetsova, A. Neumann, and S. R. J. Brueck, ”Imaging interferometric microscopy – approaching the linear systems limits of optical resolution,” Opt. Express 15, 6651-6663 (2007). 25. S. A. Alexandrov, T. R. Hillman, T. Gutzler, and D. D. Sampson, “Synthetic aperture Fourier holographic optical microscopy,” Phys. Rev. Lett. 97, 168102 (2007). 26. J. R. Price, P. R. Bingham, and C. E. Thomas Jr, “Improving resolution in microscopic holography by computationally fusing multiple, obliquely illuminated object waves in the Fourier domain,” Appl. Opt. 46, 826-833 (2007). 27. G. Indebetouw, Y. Tada, J. Rosen, and G. Brooker, “Scanning holographic microscopy with resolution exceeding the Rayleigh limit of the objective by superposition of off-axis holograms”, Appl. Opt. 46, 993-1000 (2007). 28. V. Mico, Z. Zalevsky, and J. García, “Synthetic aperture microscopy using off-axis illumination and polarization coding,” Opt. Comm. 276, 209-217 (2007). 29. I. Yamaguchi and T. Zhong, “Phase-shifting digital holography,” Opt. Lett. 22, 1268-1270 (1997). 30. I. Yamaguchi, J. Kato, S. Ohta, and J. Mizuno, “Image formation in phase-shifting digital holography and applications to microscopy,” Appl. Opt. 40, 6177-6185 (2001). 31. D. Kim, J. W. You, and S. Kim, “White light on-axis digital holographic microscopy based on spectral phaseshifting,” Opt. Express 14, 229-234 (2006). 32. H. Kadono, N. Takai, and T. Asakura, “New common-path phase-shifting interferometer using a polarization technique,” Appl. Opt. 26, 898-904 (1987). 33. Ch. S. Anderson, “Fringe visibility, irradiance, and accuracy in common path interferometers for visualization of phase disturbances,” Appl. Opt. 34, 7474-7485 (1995). 34. J. Glückstad and P. C. Mogensen, “Optimal phase contrast in common-path interferometry,” Appl. Opt. 40, 268-282 (2001). 35. C. G. Teviño-Palacios, M. D. Iturbe-Castillo, D. Sánchez-de-la-Llave, R. Ramos-García, and L. I. Olivos-Pérez, “Nonlinear common-path interferometer: an image processor,” Appl. Opt. 42, 5091-5095 (2003). 36. V. Arrizón and D. Sánchez-de-la-Llave, “Common-path interferometry with one-dimensional periodic filters,” Opt. Lett. 29, 141-143 (2004). 37. C. Meneses-Fabian, G. Rodriguez-Zurita, J. F. Vazquez-Castillo, C. Robledo-Sanchez, V. Arrizón, “Common-path phase-shifting interferometer with binary grating,” Opt. Comm. 264, 13-17 (2006). 38. T. Kreis, Hankbook of holographic interferometry: optical and digital methods (Wiley-VCH Verlag GmbH & Co. KGaA, Weinheim, 2005).
Proc. of SPIE Vol. 7000 700002-11