and Barbara Hammer. 2 ... {hammer}@in.tu-clausthal.de,+49(0)53237271[86][39] ..... M. C. Mozer, and M. E. Hasselmo, editors, Advances in Neural Information.
Supervised Neural Gas for Classification of Functional Data and its Application to the Analysis of Clinical Proteom Spectra Frank-Michael Schleif1 , Thomas Villmann1 and Barbara Hammer2 (1) University Leipzig, Dept. of Medicine, 04107 Leipzig, Germany (2) TU-Clausthal, Dept. of Math. & C.S., 38678 Clausthal-Zellerfeld, Germany {schleif,villmann}@informatik.uni-leipzig.de,+49(0)3419718896 {hammer}@in.tu-clausthal.de,+49(0)53237271[86][39] Abstract. The analysis of functional data, is a common task in bioinformatics. Spectral data as obtained from mass spectrometric measurements in clinical proteomics are such functional data leading to new challenges for an appropriate analysis. Here we focus on the determination of classification models for such data. In general the available approaches for this task initially transform the spectra into a vector space followed by training a classifier. Hereby the functional nature of the data is typically lost, which may lead to suboptimal classifier models. Taking this into account a wavelet encoding is applied onto the spectral data leading to a compact functional representation. Further the Supervised Neural Gas classifier is extended by a functional metric. This allows the classifier to utilize the functional nature of the data in the modeling process. The presented method is applied to clinical proteom data showing good results. Key words: supervised neural gas, functional, data analysis, clinical proteomics, wavelet analysis, spectra preprocessing
1
Introduction
Applications of mass spectrometry (ms) in clinical proteomics have gained tremendous visibility in the scientific and clinical community [10, 4]. One major objective is the search for potential classification models for cancer studies. For this purpose, efficient analysis and visualization of large high-dimensional data sets derived from patient cohorts is crucial. Additionally, it is necessary to apply statistical analysis and pattern matching algorithms to attain validated signal patterns. Here we focus on the determination of classification models discriminating between multiple classes. A powerful tool to achieve such models with high generalization abilities is available with the prototype based Supervised Neural Gas algorithm (SNG) [11]. Like all nearest prototype classifier algorithms, SNG heavily relies on the metric d, usually the standard euclidean metric. For high-dimensional data as they occur in proteomic patterns, this choice is not adequate due to two reasons, first the functional nature of the data should be kept as far as possible, second the noise present in the data set accumulates and likely disrupts the classification taking a standard euclidean approach. Thus, a functional representation of the data with respect to the used metric and a weighting or pruning of especially (priory not known) irrelevant function parts of the inputs, would be desirable. Therefore we focus on a functional distance measure as recently proposed in [6] which will be referred as functional metric. Further feature selection is applied based on a statistical pre-analysis of the
2
Supervised Neural Gas for Functional Data
data. Hereby a discriminative data representation is necessary. The extraction of such discriminant features is critical for spectral data and typically done by a parametric peak picking procedure. This peak picking is often focus of criticism because peaks may be insufficiently detected and the functional nature of the data is partially lost. To avoid this difficulties we focus on a wavelet encoding of the spectral data to get discriminative features. Thereby the obtained wavelet coefficients are sufficient to reconstruct the signal, still containing all relevant information of the spectra. However this better discriminating set of features is typically more complex and hence a robust approach to determine the desired classification model is needed. The paper is organized as follows: first the bioinformatic methods, namely the wavelet encoding of the spectral data and the SNG algorithm with the functional distance measure is presented. In the second part the clinical data are described and the introduced methods are applied in the analysis of the proteom spectra followed by some experiments, the paper is closed by the conclusions.
2
Bioinformatic methods
The classification of mass spectra involves in general the two steps peak picking to locate and quantify positions of peaks within the spectrum and feature extraction from the obtained peak list. In the first step a number of procedures as baseline correction, optional denoising, noise estimation and normalization must be applied. Upon these prepared spectra the peaks have to be identified by scanning all local maxima and the associated peak endpoints followed by a S/N thresholding such that one obtains the desired peak list. The procedure of baseline correction and recalibration (alignment) of multiple spectra is standard, and has been done using ClinProTools in this paper (details in [4])1 . Here we propose an alternative feature extraction procedure preserving all (potentially small) peaks containing relevant information by use of the discrete wavelet transformation (DWT). The feature extraction has been done by Wavelet analysis using the Matlab Wavelet-Toolbox2, due to the local analysis property of wavelet analysis the features can still be related back to original mass position in the spectral data which is essential for further biomarker analysis. In a first step a feature selection procedure using the Kolmogorov-Smirnoff test (KS-test) was applied. Thereby the test was used to identify features which show a significant (p < 0.01) discrimination between the two groups (cancer,control). This is done in accordance to [12] were also a generation to a multiclass experiment is given. The roughly reduced set has been further processed by SNG to obtain a classification model with a small, ranked set of features, crossvalidated by a 10-fold cross validation procedure. 2.1
Feature Extraction and Denoising by Bi-orthogonal Discrete Wavelet Transform
Wavelets have been developed as powerful tools [1, 7] used for noise removal and data compression. The discrete version of the continuous wavelet transform leads to the concept of a multiresolution analysis (MRA). This allows a fast and stable wavelet analysis and synthesis. The analysis becomes more precise if the wavelet shape is adapted to the signal to be analyzed. For this reason one can apply the 1 2
Biomarker software available at http://www.bdal.de The Matlab Wavelet-Toolbox can be obtained from www.mathworks.com
Supervised Neural Gas for Functional Data
3
7000
7000
6000
6000
5000
5000
4000
4000
3000
3000
2000
2000
1000
1000
(a) Wavelet reconstruction L = 4 (b) Wavelet reconstruction L = 5 Fig. 1. Wavelet reconstruction of the spectra with L = 4, 5, x-mass positions, yarbitrary unit. The original signal is plotted with the solid line. One observes that a wavelet analysis with L = 5 is to rough to approximate the sharp peaks.
so called bi-orthogonal wavelet transform[2] which uses two pairs of scaling and wavelet functions. One is for the decomposition/analysis and the other one for reconstruction/synthesis. The advantage of the bi-orthogonal wavelet transform is the higher degree of freedom for the shape of the scaling and wavelet function. In our analysis such a smooth synthesis pair was chosen to avoid artifacts. It can be expected that a signal in the time domain can be represented by a small number of a relatively large set of coefficients from the wavelet domain. The spectra are reconstructed in dependence of a certain approximation level L of the MRA which can be considered as a hard-thresholding. The denoised spectrum looks similar to the reconstruction as depicted in Figure 1. The starting point for an argumentation is the simplest example of a MRA which can be defined by the characteristic function χ[0,1) . The corresponding wavelet is the so-called Haar wavelet. Assume that the denoised spectrum f ∈ L2 (R) has a peak with endpoints 2j k and 2j (k + 1), the integral of the peak can be written as �
�
2j (k+1)
2j k
f (t)dt =
R
f (t)χ[2j k,2j (k+1)) (t)dt
Obviously the right hand side is the Haar DWT scaling coefficient cj,k = �f, ψj,k � at scale a = 2j and translation b = 2j k. One obtains approximation- and detailcoefficients [2]. The approximation coefficients describe a generalized peak list of the denoised spectrum encoding primal spectral information and depending on the level L which is determined with respect to the measurement procedure. For linear MALDI-TOF spectra a device resolution of 500 − 800Da can be expected. This implies limits to the minimal peak width in the spectrum and hence, the reconstruction level of the Wavelet-Analysis should be able to model corresponding peaks. A level L = 4 is appropriate for our problem (see Figure 1). Applying this procedure including the KS-test on the spectra with an initial number of 22306 measurement points per spectrum one obtains 602 wavelet coefficients used as representative features per spectrum, still allowing a reliable functional representation of the data. The coefficients were used to reconstruct the spectra and the final functional representation was based on the maximal intensity values at the mass positions encoded by the wavelet coefficients. Subsequently, the data were processed by SNG in a 10-fold cross validation procedure. 2.2
Supervised Neural Gas for functional Data
Supervised Neural Gas (SNG) is considered as a representative for prototype based classification approaches as introduced by Kohonen. Different prototype
4
Supervised Neural Gas for Functional Data
classifiers have been proposed so far [5, 9, 3, 11] as improvements of the original approach. The SNG has been introduced in [11] and combines ideas from the Neural Gas algorithm (NG)introduced in [8] with the Generalized learning vector quantizer (GLVQ) as given in [9]. Subsequently we give the basic notations and some remarks to the integration of alternative metrices into Supervised Neural Gas (SNG). Details on SNG including convergence proofs can be found in [11]. Let us first clarify some notations: Let cv ∈ L be the label of input v, L a set of labels (classes) with #L = NL . Let V ⊆ RDV be a finite set of inputs v. LVQ uses a fixed number of prototypes (weight vectors, codebook vectors) for each class. Let W = {wr } be the set of all codebook vectors and cr be the class label of wr . Furthermore, let Wc = {wr |cr = c} be the subset of prototypes assigned to class c ∈ L. The task of vector quantization is realized by the map Ψ as a winner-take-all rule, i.e. a stimulus vector v ∈ V is mapped onto that neuron s ∈ A the pointer ws of which is closest to the presented stimulus vector v, ΨVλ →A : v �→ s (v) = argminr∈A dλ (v, wr )
(1)
3
λ
with d (v, w) being an arbitrary differentiable similarity measure which may depend on a parameter vector λ. For the moment we take λ as fixed. The neuron s (v) is called winner or best matching unit. The subset of the input space Ωrλ = {v ∈V : r = ΨV →A (v)}
(2)
which is mapped to a particular neuron r according to (1), forms the (masked) receptive field of that neuron forming a Voronoi tesselation. If the class information of the weight vector is used, the boundaries ∂Ωrλ generate the decision boundaries for classes. A training algorithm should adapt the prototypes such that for each class c ∈ L, the corresponding codebook vectors Wc represent the class as accurately as possible. This means that � the set of points in any given class Vc = {v ∈V |cv = c}, and the union Uc = r| Ωr of receptive fields of wr ∈Wc the corresponding prototypes should differ as little as possible. Supervised Neural Gas (SNG) constitutes a combination of GLVQ and NG. Again, let Wc = {wr |cr = c} be the subset of prototypes assigned to class c ∈ L and Kc its cardinality. Further we assume to have m data vectors vi . As pointed out in [11], the neighborhood learning for a given input vi with label c is applied to the subset Wc . The respective cost function is CostSN G (γ) =
m �
�
i=1 r|wr ∈Wci −1
with f (x) = (1 + exp (−x)) λ dλ r −dr
−
λ dλ r +dr
−
hγ (r, vi , Wci ) · f (μλ (r, v)) C (γ, Kci )
(3)
� � and μλ (r, v) = , hγ (r, v, W) = exp − kr (v,W) γ
whereby dλr− is defined as the squared distance to the best matching
prototype but labeled with cr− �= cv , say wr− and dλr = dλ (v, wr ). The neighborhood cooperativeness makes sure that prototypes are spread faithfully among data of their respective classes. Note that limγ→0 CostSN G (γ) = CostGLV Q 3
A similarity measure is a non-negative real-valued function, which, in contrast to a distance measure does not necessarily fulfill the triangle inequality and the symmetry property.
Supervised Neural Gas for Functional Data
5
holds [11]. Hence, for vanishing neighborhood the SNG also becomes optimal in the sense of margin analysis, as detailed below. However, if the neighborhood range γ is large, typically at the beginning of the training, the prototypes of one class share their responsibilities for a given input. Hence, neighborhood cooperation is involved such that initialization of the prototypes is not longer crucial. Given a training example (vi , ci ) all prototypes wr ∈ Wci and the closest wrong prototype wr− are adapted. Taking now ξr+ =
2 · dλr− (dλr + dλr− )2
and ξr− =
2 · dλr (dλr + dλr− )2
(4)
we get the update rules wr = + · ξr+ · wr− = − − ·
�
f � |μλ (r,v) · hγ (r, vi , Wci ) ∂dλr · C (γ, Kci ) ∂wr ξr− ·
r|wr ∈Wc
(5)
f � |μλ (r,v) · hγ (r, vi , Wci ) ∂dλr− · C (γ, Kci ) ∂wr−
(6)
We remark that only for correct prototypes the neighborhood cooperativeness is applied. Yet, one could also include neighborhood cooperation for wrong prototypes. However, as shown in [11] this yields instabilities of learning. Incorporation of a functional metric to SNG As pointed out before, the similarity measure dλ (v, w) is only required to be differentiable with respect to λ and w. The triangle inequality has not to be fulfilled necessarily. This leads to a great freedom in the choice of suitable measures and allows the usage of nonstandard metrics in a natural way. We now review the functional metric as given in [6], the obtained derivations can be plugged into the above equations leading to SNG with a functional metric, whereby the data are functions represented by vectors and, hence, the vector dimensions are spatially correlated. Common vector processing does not take the spatial order of the coordinates into account. As a consequence, the functional aspect of spectral data is lost. For proteom spectra the order of signal features (peaks) is due to the nature of the underlying biological samples and the measurement procedure. The masses of measured chemical compounds are given ascending and peaks encoding chemical structures with a higher mass follows chemical structures with lower masses. In addition multiple peaks with different masses may encode parts of the same chemical structure and hence are correlated. Lee proposed a distance measure taking the functional structure into account by involving the previous and next values of xi in te i-th term of the sum, instead of xi alone. Assuming a constant sampling period τ , the proposed norm is: � Lfp c (v) =
D �
� p1 p
(Ak−1 (v) + Ak+1 (v))
(7)
k=1
with Ak (v) =
τ
2 |vk | 2 vk τ 2 |vk |+|vk−1 |
if 0 ≤ vk vk−1 if 0 > vk vk−1
τ Bk (v) =
2 |vk | 2 vk τ 2 |vk |+|vk+1 |
if 0 ≤ vk vk+1 (8) if 0 > vk vk+1
6
Supervised Neural Gas for Functional Data
are respectively of the triangles on the left and right sides of xi . Just as for Lp , the value of p is assumed to be a positive integer. At the left and right ends of the sequence, x0 and xD are assumed to be equal to zero. The derivatives for the functional metric taking p = 2 are given in [6]. Now we consider the scaled functional
norm where each dimension vi is scaled by a parameter λi > 0 λi ∈ (0, 1] and i λi = 1. Then the scaled functional norm is: � Lfp c (λv) =
D �
� p1 (Ak−1 (λv) + Ak+1 (λv))
p
(9)
k=1
with
τ
Ak (λv) =
2 λk |vk | 2if 20 ≤ vk vk−1 λk vk τ 2 λk |vk |+λk−1 |vk−1 | else
τ
2 λk |vk | 2if 20 ≤ vk vk+1 λk vk τ 2 λk |vk |+λk+1 |vk+1 | else
Bk (λv) =
(10)
The prototype update changes to: ∂δ22 (x, y, λ) τ2 (2 − Uk−1 − Uk+1 ) (Vk−1 + Vk+1 ) k = ∂xk 2
(11)
with Uk−1 = Vk−1
0 if 0 ≤ k k−1 �
λk−1 �k−1 λk |�k |+λk−1 |�k−1 |
�2
else
1λk if 0 ≤ k k−1 = λk |�k | λk |�k |+λk−1 |�k−1 | else
, Uk+1 = , Vk+1 =
0 if 0 ≤ k k+1 �
λk+1 �k+1 λk |�k |+λk+1 |�k+1 |
�2
else
1λk if 0 ≤ k k+1 λk |�k | λk |�k |+λk+1 |�k+1 | else
and k = xk −yk Using this parametrization one can emphasize/neglect different parts of the function for classification. This distance measure can be put into SNG as shown above and has been applied subsequently in the analysis of clinical proteom spectra.
3
Analysis of proteomic data
Subsequently the proposed data processing scheme is applied to clinical ms spectra taken from a cancer study. Thereby we focus on a reliable encoding and analysis of the spectral data as well as on the generation of a classification model indicating discriminative features. 3.1
Clinical sample preparation and MS data acquisition
Sample preparation and profile spectra analysis were carried out using the CLINPROT system (Bruker Daltonik, Bremen, Germany). Plasma samples from 45 cancer patients and 50 controls were prepared using the MB-WCX Kit (Bruker Daltonik, Bremen, Germany). Purifications were performed according to the product description. Sample preparation onto the Anchor Chip target was done using HCCA matrix. Profiling spectra were generated on a linear autoflex MALDI-TOF MS (Bruker Daltonik, Bremen, Germany).
Supervised Neural Gas for Functional Data
3.2
7
Analysis with Supervised Neural Gas
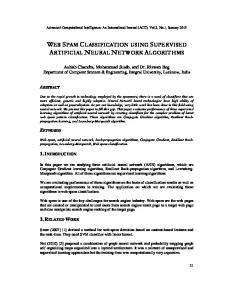
The preprocessed set of spectra and the corresponding wavelet coefficients are now analyzed using the Supervised Neural Gas Algorithm (SNG) extended by a functional metric. We reconstructed the spectra based upon the discriminative wavelet coefficients determined by the Kolmogorov-Smirnoff test as explained above. In a second step maximal intensities for the ranges encoded by the wavelet coefficients has been determined. The spectra are subsequently considered only upon these maximal intensities leading to a significant reduced representation of the spectra as depicted in Figure 2 but still sufficient to keep all necessary information as evaluated by experts. This leads to a complexity reduction of the signals as well as to a smoothing of the spectral signal. Here we used the full spectra for parametrized functional norm i.e. all λi = 1. The original signal
300
1000 Mean Spectrum Class 1 Mean Spectrum Class 2
300 Mean Spectrum Class 1 Mean Spectrum Class 2
900
Mean Spectrum Class 1 Mean Spectrum Class 2
250
250 800 700
200
200 arb. unit
arb. unit
arb. unit
600 150
500
150
400 100
100 300 200
50
50 100
0
0
0.5
1 1.5 arb. mass position
2
2.5 4
x 10
(a) L4 Reconstruction
0
0
100
200
300 arb. mass position
400
500
600
(b) KS Reconstruction
0
0
100
200
300 arb. mass position
400
500
600
(c) SNG Reconstruction
Fig. 2. Visualization of the different representations of the spectral data with respect to wavelet encoding and feature selection. The first figure shows a part of the original spectra for the two classes reconstructed with L = 4. The second figure shows the same part after encoding by wavelet analysis and KS-Test application as explained before one clearly observed that dominating common peaks are removed. The third figure shows the reduced representation of the spectra by linear interpolation between maximal intensities at encoding regions, as finally used for the modeling.
with approx. 22000 sampling points had been processed with only 600 remaining points still incoding the significant parts of the signal relevant for discrimination between the classes. The SNG classifier with functional metric obtains a crossvalidation accuracy of 84% using functional metric and 82% by use of standard Euclidean metric, in addition the standard deviation of the different crossvalidation runs is smaller using the functional metric. Thereby the results with the wavelet processed spectra are slightly better than using standard peak lists, with 81% crossvalidation accuracy.
4
Conclusions
The presented initial data interpretation of proteom data demonstrate that the functional analysis and model generation using SNG with functional metric in combination with a wavelet based data preprocessing provides an easy and efficient detection of classification models and a good analysis of the highdimensional data. The usage of wavelet encoded spectra features is especially helpful in detection of small differences which maybe easily ignored by standard approaches as well as to significantly reduce the number of points needed in
8
Supervised Neural Gas for Functional Data
further processing steps. Thereby the signal must not be reduced to peak lists but could be preserved in its functional representation. SNG was able to process high-dimensional functional data and observed good regularization. By use of the Kolmogorv-Smirnoff test we found a ranking of the features related to mass positions in the original spectrum which allows for identification of most relevant feature dimensions which was used for the reduction of the large number of wavelet coefficients and to prune irrelevant regions of the spectrum. In future analysis it could be interesting to reduce the feature set by incorporating knowledge about fractionation of the chemical compounds leadings to multiple related peaks of the same source. Alternatively one could optimize the scaling parameters of the functional norm directly during classification learning by so called relevance learning as shown in [3] for scaled Euclidean metric. Conclusively, wavelet based spectra encoding in combination with SNG equipped by a functional metric is an interesting alternative to standard approaches allowing more flexibility in problem modeling as well as the control of the data processing task. It combines efficient model generation with automated data pretreatment and intuitive analysis4 .
References 1. A. Rieder A.K. Louis, P. Maaß. Wavelets: Theory and Applications. Wiley, 1998. 2. A. Cohen, I. Daubechies, and J.-C. Feauveau. Biorthogonal bases of compactly supported wavelets. Comm. Pure Appl. Math., 45(5):485–560, 1992. 3. Barbara Hammer, Marc Strickert, and Thomas Villmann. Supervised neural gas with general similarity measure. Neural Processing Letters, 21(1):21–44, February 2005. 4. R. Ketterlinus, S-Y. Hsieh, S-H. Teng, H. Lee, and W. Pusch. Fishing for biomarkers: analyzing mass spectrometry data with the new clinprotools software. Bio techniques, 38(6):37–40, 2005. 5. Teuvo Kohonen. Self-Organizing Maps, volume 30 of Springer Series in Information Sciences. Springer, Berlin, Heidelberg, 1995. (2nd Ext. Ed. 1997). 6. J. Lee and M. Verleysen. Generalizations of the lp norm for time series and its application to self-organizing maps. In Marie Cottrell, editor, 5th Workshop on Self-Organizing Maps, volume 1, pages 733–740, 2005. 7. A. Leung, F. Chau, and J. Gao. A review on applications of wavelet transform techniques in chemical analysis: 1989-1997. Chem. and Int. Lab. Sys., 43(1):165– 184(20), 1998. 8. Thomas M. Martinetz, Stanislav G. Berkovich, and Klaus J. Schulten. ’Neural-gas’ network for vector quantization and its application to time-series prediction. IEEE Trans. on Neural Networks, 4(4):558–569, 1993. 9. A. Sato and K. Yamada. Generalized learning vector quantization. In D. S. Touretzky, M. C. Mozer, and M. E. Hasselmo, editors, Advances in Neural Information Processing Systems 8. Proceedings of the 1995 Conference, pages 423–9. MIT Press, Cambridge, MA, USA, 1996. 10. J. Villanueva, J. Philip, D. Entenberg, and C.A. Chaparro et al. Serum peptide profiling by magnetic particle-assisted, automated sample processing and maldi-tof mass spectrometry. Anal. Chem., 76:1560–1570, 2004. 11. Th. Villmann and B. Hammer. Supervised neural gas for learning vector quantization. In D. Polani, J. Kim, and T. Martinetz, editors, Proc. of the 5th German Workshop on Artificial Life (GWAL-5), pages 9–16. Akademische Verlagsgesellschaft - infix - IOS Press, Berlin, 2002. 12. D.E. Waagen, M.L. Cassabaum, C. Scott, and H.A. Schmitt. Exploring alternative wavelet base selection techniques with application to high resolution radar classification. In Proc. of the 6th Int. Conf. on Inf. Fusion (ISIF’03), pages 1078–1085. IEEE Press, 2003. 4
Acknowledgment: The authors are grateful to M. Kostrzewa and T. Elssner for providing the clinical proteom data (both Bruker Daltonik Leipzig, Germany)