SUPPORT MEASURES FOR CAULISTIC MACROEVOLUTIONARY TRANSFORMATIONS IN EVOLUTIONARY TREES1
Richard H. Zander2
ABSTRACT Investigation of caulistic macroevolution in an evolutionary tree often requires separate support measures for exemplar groups, and for the taxon they represent. A taxon may be actually or cryptically heterophyletic on a molecular tree. Congruence between branch order of morphological and molecular cladograms is not as important as is congruence between inferred macroevolutionary transformations at the taxon level as caulistic elements on an evolutionary tree. Unsampled paraphyletic branches can affect perceived progenitor-descendant relationships and may be inserted in a molecular tree to help explain lack of congruent caulistic inferences without affecting calculated branch order. Integrable and non-integrable analyses must be combined for scientific completeness. Support for inferred macroevolutionary transformations may be estimated from either the amount of present-day paraphyly in densely sampled, related groups or from clade support and nearest neighbor interchange. Key words: Evolutionary systematics, integrable analyses, macroevolutionary transformation, paraphyly.
There has been a misunderstanding in the present conflict between proponents of phylogenetic and classical evolutionary systematics regarding paraphyly. It has been stated (Santos & Faria, 2011: 67) that there is a war between advocates of strictly molecular or strictly morphological systematics. Evolutionary systematics, however, promotes pluralism in analytic methods and cherishes molecular cladograms as informative of aspects of evolution. It is how phylogeneticists interpret exemplars in molecular cladograms as representative of taxonomic units that is the basis for the dispute. The molecular cladogram can fairly accurately give a retrodiction of the gene history of each specimen used as an exemplar for a taxon. Gene history is used here as restricted to genetic continuity and isolation events in the ancestral line ending with each sample. Branch order of the taxa supposedly represented by the specimen exemplars are, however, not directly modeled. Ho¨randl (2010) has pointed out that molecular data are efficient for reconstruction of descent, but commonly used markers have limited value for recognizing evolutionary groups, while morphological traits that contribute to structure and function are actually involved in selection, adaptation, and co-evolution, and, thus, may be the proper bases for evolutionary grouping in classification.
Zander (2008, 2010a) introduced the concept of taxon mapping where heterophyly (paraphyly or phylogenetic polyphyly of undeniably the same taxon) implies a deep ancestral taxon generating two extant lineages of the same taxon, and this progenitor also generated one or more lineages of different, apophyletic (descendant) taxa (at the same or higher rank) in between the paraphyletic branches. Theoretical macroevolutionary transformations are then synthetic, emergent properties. Looking for deep ancestors linking molecular and morphological inferences is equivalent to the search for ‘‘hidden variables’’ in physics, such as the so-far unsuccessful search for a non-obvious classical explanation for the nonsensical rules of quantum mechanics. Paraphyly may be simple, with one included lineage of a different taxon (Fig. 1a), or extended, with two or more included lineages (Fig. 1b) bracketed by a heterophyletic pair of lineages of the single taxon that establishes the deep ancestor of the same name. This paper is written in the context of a framework for a post-phylogenetic systematics (Zander, 2013), which attempts to meld alpha taxonomy, morphological cladistics, and molecular systematics under a single scientific theory that explains their incongruencies. Postulation of theoretical caulistic macroevolutionary transformations, as taxonomically named internal nodes, forms the basis for that overarching
1 I appreciate the invitation of Tod F. Stuessy and Elvira Ho ¨ randl to participate in this publication of contributions to the Evolutionary Systematics and Paraphyly symposium. The Missouri Botanical Garden provided continued support and encouragement. The listserver Taxacom is saluted as a friendly sounding board that resonated the better ideas and muffled the less felicitous. 2 Missouri Botanical Garden, P.O. Box 299, St. Louis, Missouri 63166-0299, U.S.A.
[email protected]. doi: 10.3417/2012090
ANN. MISSOURI BOT. GARD. 100: 100–107. PUBLISHED
ON
14 NOVEMBER 2014.
Volume 100, Number 1–2 2014
Zander Support Measures in Evolutionary Trees
101
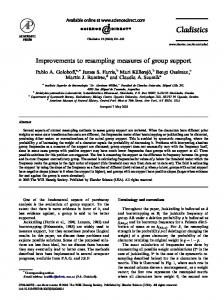
Figure 1. —(a). Simple paraphyly. Support for macroevolutionary transformation A . B through nearest neighbor interchange analysis has one half the uncertainty of support for sister-groups (B, A1). —(b). Extended paraphyly. Both B and (C, D) are ‘‘bracketed’’ by A1 and A2, and, thus, are both descended from implied deep taxon A. Support for transformation A . B is the product of one minus the uncertainty contributed by two calculations, the nearest neighbor interchange of A1 and B, and of B and A2 (see discussion in text). The support for A . (C, D) is calculated as per A . B in Figure 1a.
theory, as macroevolution in phylogenetics is presently a hidden variable. The method has six elements: (1) alpha taxonomy is a set of geneticalgorithm–based heuristics developed over 250 years; (2) cladistic analysis of morphology aids in developing a natural key to taxa based on transformations of weighted conservative characters; (3) molecular systematics establishes genetic continuity and order of isolation events, but not necessarily speciation events, through deep ancestors implied by heterophyly of exemplars; the name and rank of the ancestral taxon is that inclusive of all the heterophyletic exemplars; (4) taxa low in the morphological tree but high in the molecular tree are theoretically ancestral taxa of all lineages in between, while morphological analyses may be reassessed with molecular taxon mapping; (5) ‘‘superoptimization’’ by maximizing theoretical ancestor-descendant hypotheses minimizes superfluous postulated shared ancestors, while biosystematic and biogeographic study through Dollo evaluation at the taxon level provides biological evidence for macroevolutionary transformations; and (6) classification by diagnosable macroevolutionary constraints requires the generalist Linnaean classification system capable of represent-
ing to some degree all aspects of evolutionary analysis through taxon-inclusive lists (distinctions) and ranks (similarities). In this paper, the level of support for macroevolutionary transformations at the taxon level is measured, based in part from support for clades. DISTINCTION REPRESENT
BETWEEN
WHAT AN EXEMPLAR AND A TAXON
An exemplar of a taxon in a molecular cladogram is often the sole representative assigned to that taxon. There is in effect a single sample of the distribution of the potentially variable sequence data for that taxon. This is opposed to the practice of examination of many specimens in classical taxonomy, which allows recognition of the distribution and correlation of conservative and of more or less variable traits. The classical taxonomic method, as Zander (2010a) detailed following Gigerenzer (2007) and Hutchinson and Gigerenzer (2005), uses hard-won informal genetic algorithms resulting in well-tested heuristics called ‘‘expertise.’’ Such is not usually associated with explicit rules-based analysis, but the development (Zander, 2008, 2010b) of a logical, effective, overarching theory of macroevolution melding ‘‘subjective’’ (Scotland et al., 2003; Hey, 2009; Yoon,
102
Annals of the Missouri Botanical Garden
2009) Linnaean taxonomy with the results of molecular systematics (see Zander, 2010a, for examples) demonstrates the utility of Linnaean classification as the most successful genetic algorithm of alpha taxonomy. Ideally, the distribution of traits among sampled specimens of the molecular data should match that of the morphological data. Although morphological data have been accumulated over the past 250 years of classical study and distributional variation is well documented in descriptions of at least the wellstudied species, this is not true for molecular distributions, which focus on sampling sequences, not specimens. Such sampled sequences may even be from different specimens. Thus, different gene histories may be due to differential lineage sorting or to different, paraphyletic specimens as source of two different sequences. Molecular exemplars rely on classical descriptions for a model of what they represent. Molecular analyses, when they match morphological results, can only be said to be ‘‘not incompatible’’ and never cited as supportive because exemplars are usually insufficient to stand by themselves as well-documented representatives of coherent entities in nature; or, if they do not match, they can only be incongruent and never truly falsificatory. This is because incongruence between taxon-based morphological and specimen-based molecular analyses can be explained with an overarching theory, namely as due to macroevolution—that is, one taxon generating another taxon of the same or higher rank. Rejecting macroevolution is characteristic of structuralism in systematics (Zander, 2010b). Pluralism in method, involving theory and total evidence, is promoted by evolutionary systematics.
have discussed conflicting gene trees generated during the coalescent process by stochastic fluctuation. A molecular tree is precise but reflects only the limited data involved in its construction. The incessant drive for precision makes precision the enemy of accuracy. The genetic continuity and isolation events of a given exemplar specimen’s gene history are indeed inferable, but speciation events and macroevolutionary series (named taxa giving rise to named taxa of the same or higher rank) are not directly investigated. The tree of life in molecular phylogenetic analysis remains only a nested parentheses of sampled specimens and has no better resolution than the expected level of paraphyly and extended paraphyly due to unsampled and extinct lineages or molecular strains that would render monophyletic groups paraphyletic if they were known. To infer macroevolution as named nodes on a tree, less precise data and discursive, inductive reasoning must be involved. The problem becomes nonintegrable and can lead to chaos, much as the position of even an ideal caroming billiard ball is not predictable after about seven bounces off a cushion on a rectangular pool table (Manzotti, 2011) as it transits into Brownian motion-like chaos. The problem is even less certain as data degrade with time since the evolutionary event. A solution to nonintegrable problems (Ekeland, 2006: 97, 103) necessarily involves analysis of individual elements (taxa) with all data available, while periodicity is revelatory of relationships between the elements. The periodicity as applied to systematics, in part, is reflected in shared traits in the context of macroevolution, i.e., Darwin’s original concept of descent with modification of taxa. Dayrat (2005) demonstrated that Darwin’s tree of life was based on taxon-based progenitor-descendant transformations, not sistergroup relationships. In addition, uncertainty is contributed by the use of induction in generating scientific theories of caulistic macroevolutionary transformation, and induction also increases the chance of false conclusions from true premises (Sober, 1991: 20). Increased uncertainty associated with true ‘‘total evidence’’ analysis must be accepted for a complete scientific theory. Zander (2007) advanced the case for a penalty of 1% in credibility support for all branches of a molecular cladogram to allow for unaccounted assumptions. Zander pointed out that the final product of a Bayesian analysis is properly not the posterior probability, which reflects only the data set, but the Bayes’ solution (Kendall & Buckland, 1971), which minimizes risk by taking into account
UNCERTAINTY ASSOCIATED ORDER
WITH
EXEMPLAR BRANCH
Systematics has restricted analysis to integrable (fully solvable) problems (Ekeland, 2006: 80), in particular Markov chains and parsimony analysis, which ideally can mathematically fully predict the past and future, much like Laplace’s demon, as a generalized solution. The molecular cladogram is commonly analyzed on a Markovian model in that present-day data are taken as sufficient to retrodict the relevant past (if a large enough data set), and analysis is by a reverse Laplace’s demon through coalescent theory. In integrable analyses, such as prediction of the future position of an ideal billiard ball on an ideal elliptical pool table, uncertainty is not increased beyond the initial uncertainty. This in systematics is not totally true in practice as Hudson and Coyne (2002) and Rannala and Yang (2003)
Volume 100, Number 1–2 2014
Zander Support Measures in Evolutionary Trees
103
uncertainty contributed by assumptions not dealt with in the method, model, or data. Sources of uncertainty, none of which are unfamiliar to phylogeneticists, include alignment, wrong gap costs, differential lineage sorting, hybridization, polyploidy, recombination, non-clocklike behavior, rates other than gamma distributed, differences between the results of ‘‘total evidence’’ and evaluations based on separate gene studies, possible strong selection pressure on noncoding promoter sequences, persistent pseudogenes, too few exemplars, endogenous retroviruses, gene conversion, self-correction of flawed DNA, paralogy, codon bias, chloroplast capture and other horizontal gene flow, novel clades, saturation, third codon bias, wrong identifications, long-branch attraction, model insufficiency, and other problems affecting the Bayes’ solution. The argument for a 1% penalty on the credible support (i.e., multiply the support by a correction factor of 99%) involves the following: if only 10 of these assumptions affected one branch support one out of 1000 times, then the joint contributed uncertainty is 1%, or 20% of the 5% window of reliability. This seems onerous, yet it can be dealt with by empiric Bayesian analysis of multiple sequence studies (Zander, 2007). Following the argument that an integrable analysis does not increase initial uncertainty, the initial uncertainty of 1% is simply reflected at all solutions (nodes). This penalty is for error that increases linearly with additional contiguous branch splits. That is, the joint probability of more than one branch is the product of their individual credibility support values. In the case of phylogenetic trees with all branches supported at 99% credibility, only five contiguous internodes (chained clades) anywhere in the tree are acceptable as having branch order being completely correct at a joint probability of 95% (that is, 99% multiplied by itself five times). One percent is a general penalty applied to all support measures for all lineages because the errors affect all approximately equally. The 1% uncertainty is compounded because each node is a separate solution to the integrable analysis. There is a notion, particularly among mathematicians, that nature follows mathematics (Kline, 1985; Ekeland, 2006). On the other hand, the perceived real features of nature are fuzzy, somewhat indeterminate, and probabilistic due to the influence of complexity and chaos, plus the fact that no phenomenon is fully described by available data. Mathematics is then a kind of approximation, in this case hyper-precise for phenomena that are difficult to encompass with a precise answer, and mathematical solutions thus may be inaccurate for all but the
simplest, most well-understood phenomena. The map is not the territory. An exacting bill for services may be wrong. An integrable solution may produce a simple and repeatable classification, but the implied evolutionary relationships may be scrambled. INFERRED MACROEVOLUTIONARY TRANSFORMATIONS Rieseberg and Brouillet (1994) estimated at least 50% of all plant species are generated through local geographic speciation and are, therefore, paraphyletic. Funk and Omland (2003) found clear specieslevel paraphyly or polyphyly in 23% of more than 2000 species sampled. According to Aldous et al. (2011: 322) about 63% of extant species have extant ancestors. Frey (1993) decided that paraphyletic scenarios, including local geographic speciation, are common or even the rule, while Gurushidze et al. (2010) supported the idea that pseudoextinction (disappearance of a progenitor taxon after generation of two daughter taxa) is rare. Thus, there are doubtless many cryptically paraphyletic taxa that have one branch unsampled, for instance because of lack of time, funding, or computer limitations, or the lineage is extinct or represented only by difficult-toobtain or very old specimens. The sampled lineage only appears to be monophyletic. The percentage of paraphyletic taxa at any one time in the past, the past measured by each split in a cladogram, may be judged by the percentage of paraphyletic taxa in the present. If 10% of the taxa represented by exemplars in a cladogram are paraphyletic, then the chance of any presently monophyletic internode in the cladogram representing a paraphyletic taxon is 10%, one branch of the paraphyly assumed probably unsampled. That percentage, however, is not the same as the percentage of all taxa being initially paraphyletic, which may be nearly all of them, or the percentage of taxa with long-lasting macroevolutionarily generative paraphyletic lineages that are unsampled today. In addition, given little or no information on the percentage of true pseudoextinction events, an attempt to infer a progenitor at each and every node in a cladogram seems justified. This is ‘‘superoptimization’’ because it decreases the number of unnamed shared ancestors that must be postulated in addition to optimization of traits on the tree. This may seem counterintuitive to ‘‘treethinking’’ phylogeneticists for whom shared ancestors are never named (beyond, perhaps, as that taxon including all exemplars but the outgroup). As Einstein said to Heisenberg (Gilder, 2008: 87): ‘‘It is theory which first determines what can be observed.’’ Phylogenetic theory is blind to caulistic macroevolutionary transformations at the taxon level.
104
Annals of the Missouri Botanical Garden
At times it is necessary to postulate unsampled paraphyly in a molecular tree to explain rather certain relationships among morphological taxa. The attainment of ‘‘reciprocal monophyly’’ may be the perfection of cladistic relationships but is also the loss of macroevolutionarily important information. Morphological taxa are often well supported. The amount of data is commonly comparable between morphological and molecular studies, or even much larger in morphological studies, contrary to assumptions in the literature. Consider this contrived scenario: (1) A morphological cladogram is based on descriptions of 50 taxa, each taxon consisting of 500 specimens studied over many years by modern generations of taxonomists, based on 20 conservative traits (and 20 or more other, less conservative traits). Thus 20 times 500 times 50, or 500,000 data points are involved referring to taxa. A weighted analysis emphasizing known conservative traits yields the cladogram of taxa (((A,B)C)D,E). Superoptimization, let us say, supports the morphological analysis by indicating that taxon A is probably the ancestor of both B and possibly also C. (2) A molecular analysis of specimens representing the same taxa is done, based on, say, 50 specimens and 1000 phylogenetically informative traits. Thus, 50,000 data points are involved for the 50 specimens. A parsimony or Bayesian analysis yields the cladogram of specimens (((A,C)B)D,E). The two cladograms do not actually conflict because their theoretical macroevolutionary transformations are the same. The two analyses infer two different cladistic facets of evolution: one, the overall synchronic expressed trait relationships of taxa and the other, the synchronic relationships of specimens based on inferred genetic continuity and isolation events. It is not appropriate to simply ignore the morphological cladogram or to map traits atomistically on the molecular cladogram. Scientifically, no violence is done to logic and no information is lost if one postulates an unsampled paraphyletic branch of A occurring below B on the molecular cladogram, supporting the inference from superoptimization of the morphological cladogram that A is the ancestor of B, and also C. Refusing to engage in scientific theorization about macroevolution is a major problem with phylogenetic analysis, yet such theorization yields testable hypotheses of major import.
which ancestor is, for instance, the most basal in a caulogram. Investigating the possibility of identification of an ancestral taxon as a node on a cladogram involves evaluating the amount (percent of taxa with exemplars exhibiting paraphyly) and extent of scatter (distance between heterophyletic exemplars) of paraphyly in the cladogram as a whole, and also data not in the phylogenetic data set, including discursive reasoning about direction of evolution involving Dollo’s law (Gould, 1970) and biogeographic considerations (Zander, 2008). Although many specimens have been sampled among taxa of higher rank, no direct, formal evaluation (e.g., Student’s t) of skewness or multimodalities among the molecular data has been done. Given that good sampling of taxa (e.g., many specimens from many localities and habitats that sample a possible multiplicity of intrataxon populations) is rare, we must use rules of thumb for the prevalence of paraphyly. In general, at least simple paraphyly is here considered extremely common in the past and mostly is unsampled. Extended paraphyly (or phylogenetic polyphyly) is less common but seems not uncommon judging from published molecular trees in the literature. In the case of extant paraphyly, support measures for inferred macroevolutionary events at the taxon level can be derived from support measures for exemplar specimen branch order on a molecular tree. (Note that paraphyly on a morphological tree is also possible and informative, although not much investigated nowadays.) In the contrived rooted cladograms (Fig. 1a, b), all clades are supported at 0.95 posterior probability, a common measure of good support. In simple paraphyly, as in Figure 1a, support for specimen B (representing taxon B) being derived from caulistic deep taxon A, implied by paraphyletic specimens A1 and A2, can be inferred from nearest neighbor interchanges (NNI). NNI between (B, A1) and A2 would not affect A . B (i.e., B derived from ancestor A) if A1 interchanged with A2, but would if B interchanged with A2. Because the support for (B, A1) is 0.95, we can estimate half the uncertainty, or a support value of 0.975 for A . B. This is a simplification done in lieu of evaluating all the most probable branching patterns. The chance of B interchanging lower in the cladogram (assuming more clades toward the root) is small, at most one half of 0.05 times 0.05, or 0.0013, which, though finite, does not much lower the support for A . B. In another scenario, that of extended paraphyly (Fig. 1a), both B and (C, D) are bracketed by A1 and A2, these last being two exemplar specimens of inferred ancestral taxon A. There are then two
SUPPORT MEASURES FOR MACROEVOLUTIONARY TRANSFORMATIONS AT TAXON LEVEL The present-day branch order of exemplar specimens is not in question because phylogenetic branch order is valuable to the extent it helps infer macroevolutionary transformation of taxa. Unsampled (e.g., extinct) paraphyly can affect the probability of
Volume 100, Number 1–2 2014
Zander Support Measures in Evolutionary Trees
105
lineages that apparently derive (descend from) the implied taxon A. The support for the macroevolutionary transformation A . B depends on NNI governed by support measures between A1 and B, and A2 and B. NNI between B and A2 eliminated support for A . B, but switching A2 with the other lineage ((C, D) A1) does not. Thus, 0.975 is support from this NNI analysis. Switching of A1 with B also eliminates support for A . B, but switching (C, D) with B does not, thus 0.975 is the other half of the analysis. Both must be true at the same time for A . B, so the joint probability of A . B is 0.975 times 0.975, or 0.95. The second apparent macroevolutionary transformation (in Fig. 1b) is then A . (C, D). The NNI analysis is that if (C, D) switches with B, there is support, but if A1 switches with B, there is no support, thus support for A . (C, D) is 0.975 (half the 0.05 uncertainty of the support value). The name of the implied caulistic taxon for the immediate shared ancestor of C and D would be the lowest ranking taxon that includes both C and D. A deep ancestral taxon may be inferred by crosstree heterophyly of a distal exemplar on a molecular cladogram and that same taxon more basal in a morphological cladogram of the same taxonomic group. This is done by postulating an unsampled (e.g., extinct) lineage inserted into the molecular cladogram in the same more basal position of the morphological cladogram (Element 4 of the framework above). An example is the position of the moss genus Erythrophyllopsis, very low in a morphological cladogram (Zander, 1993: 47) but rather high in a molecular cladogram (Werner et al., 2004) as a kind of bryological ‘‘coelacanth.’’ The level of clade support for the position of an inserted theoretical lineage must be high (say, 95% posterior probability) if the morphological cladogram otherwise roughly approximates the molecular cladogram and there are similar taxa nearby (implying a similar generalist ancestor, as in the case with Erythrophyllopsis) in the morphological cladogram. In addition, if there are no alternatives, Cohen’s (1994) arguments against unremitting calculation of superfluous support values then applies. Calculation of support for evolutionary transformations from an inferred deep ancestor can be based on the two heterophyletic branches. One must remember that the integrable molecular cladogram is an incomplete theory because it details (as a discovery process) only inferred genetic continuity and isolation events, not descent with modification of taxa. The addition of inductive nonintegrable inferences may limit certainty but is scientifically sound and theoretically complete.
One can point out here that the level of support for the existence of a deep ancestral taxon gauged from extant paraphyly also helps judge the level of existence of possible unsampled deep ancestral taxa that render non-paraphyletic lineages ambiguous as to branch order. Simple paraphyly implies a deep ancestral taxon that does not change cladistic branch order, assuming no name changes associated with the principle of holophyly, but extended paraphyly will change taxon branch order. As a rule of thumb from estimates of Aldous et al. (2011), unsampled simple paraphyly may be assumed to be about 50%, and from observed published cladograms of taxically fairly well-sampled studies, unsampled extended paraphyly may be about 10% of that, or 5%. A macroevolutionary transformation associated with extended paraphyly changes branch order if an unsampled lineage is two or more nodes below the extant lineage of the same taxon. Any monophyletic lineage then has a 5% chance that it is subtended by such an order-changing unsampled lineage. In the absence of any other information, each Bayesian support measure for a monophyletic branch must be reduced by 95%. DISCUSSION Evolutionary systematics promotes the use of all data and all analyses, both integrable and nonintegrable. In that Markov chain analysis is np-hard, Hastings–Metropolis sampling speeds the computation. Likewise, parsimony analysis has a heuristic sampling option for ‘‘large’’ (more than 20 OTUs) data sets. Although such analyses are valuable sources of particular evolutionary information, there is no direct inference of macroevolution, that is, derivation of one named taxon from another named ancestor at the same taxonomic level, or higher (e.g., species to species or species to genus). It is when the specimens that are analyzed molecularly are treated as exemplars (representatives) of taxa that a confusion of integrable and nonintegrable analyses begins. The taxa are determined by nonintegrable classical circumscriptions involving informal heuristics, i.e., scientifically informed intuition refined over 250 years of alpha taxonomy. The data used do fade with time of establishment, yet many data on different traits allow a kind of triangulation that well distinguishes taxa on the basis of one or another of several valid species concepts. Following Ekeland’s (2006) example of the rectangular pool table that yields nonintegrable predictions of a pool ball’s path, there are two paths that are in fact integrable, namely bouncing back and forth orthogonal to the sides. This periodicity is a
106
Annals of the Missouri Botanical Garden
source of long-term predictivity. An analogue in classical systematics is the conservative trait, which is apparently resistant to adaptive pressures or which mutates rarely. Thus, in combining integrable and nonintegrable analyses, we rely on the informational content of conservative traits to fade the least as time passes. When specimens used in molecular analysis are treated as taxa, the conservative traits are impressed on the analysis. But phylogeneticists should not rely on conservative traits to reflect phylogenetic monophyly of taxa and at the same time reject such traits in the case of paraphyly. Likewise, one should not postulate homoplasy or independent derivation with no further explanation when a theory (macroevolution) is available that explains such as joint derivation from an inferred deep ancestral taxon. When studies of molecular and morphological branch orders are quite dissimilar, the classical taxa are re-evaluated to see if they really belong in this study or group, or if they are too heterogeneous or homogeneous, or if a morphological cladogram is correctly weighted to reflect the relative importance of conservative traits. If the conclusion is that there is no reason to change morphologically based taxa, the molecular cladogram is then evaluated to see if insertion of a theoretical unsampled paraphyletic lineage may account for a deep ancestor that will explain the differences in branch order. The number of inferred unsampled paraphyletic lineages should not exceed 63% of the number of taxa represented by the exemplars plus all the unnamed shared ancestral nodes (see Aldous et al., 2011: 322), without a clear reason. Inferred empirically unsampled paraphyletic lineages should not be inserted farther from the extant lineage than is reasonable given the scatter of extended paraphyly in well-sampled (taxon-wise) molecular cladograms of at least related taxa. The goal is not necessarily forcing morphological and molecular cladograms to be congruent but to develop a theory of shared caulistic ancestral structure that explains both best. This is much like Haack’s (1993: 81) analogy of the crossword puzzle that is solved by mutual support from two rather different belief or experiential systems. Both morphological and molecular cladograms may be modified to meld with each other in sharing the same macroevolutionary transformation because each is vulnerable. Morphological data are difficult to weight without a thorough analysis; such weights may not be generalizable to a full cladogram; and trait parallelism or re-occurrence of ancestral traits is well known (Zander, 2007) though amenable to Dollo evaluation at the taxon level. Molecular analysis is of specimens, not taxa, and unsampled heterophyletic
lineages are doubtless common given the usual prevalence of paraphyly and extended paraphyly in well-studied densely sampled groups. Ho¨randl (2010) discussed incomplete sampling of specimens and sequences in the context of deep time markers and implied that morphological and molecular analyses must be expected to remain incongruent in some respects. These vulnerabilities, in fact, help triangulate shared caulistic transformations through application of macroevolutionary theory. Support measures for inferred deep ancestral taxa may be calculated from the estimated extent of present-day paraphyly in densely sampled groups, and NNI analysis of clade branch order of present-day and theoretical paraphyly. Literature Cited Aldous, D. F., M. A. Krikun & L. Popovic. 2011. Five statistical questions about the Tree of Life. Syst. Biol. 60: 318–328. Cohen, J. 1994. The world is round (p , .05). Amer. Psychol. 49: 997–1003. Dayrat, B. 2005. Ancestor-descendant relationships and the reconstruction of the Tree of Life. Paleobiology 31: 347– 353. Ekeland, I. 2006. The Best of All Possible Worlds: Mathematics and Destiny. University of Chicago Press, Chicago. Frey, J. K. 1993. Modes of peripheral isolate formation and speciation. Syst. Biol. 42: 373–381. Funk, D. J. & K. E. Omland. 2003. Species-level paraphyly and polyphyly: Frequency, causes, and consequences, with insights from animal mitochondrial DNA. Annual Rev. Ecol. Evol. Syst. 34: 397–423. Gigerenzer, G. 2007. Gut Feelings: The Intelligence of the Unconscious. Viking Penguin, New York. Gilder, L. 2008. The Age of Entanglement: When Quantum Physics Was Reborn. Alfred A. Knopf, New York. Gould, S. J. 1970. Dollo on Dollo’s Law: Irreversibility and the status of evolutionary laws. J. Hist. Biol. 3: 189–212. Gurushidze, M., R. Fritsch & F. Blattner. 2010. Specieslevel phylogeny of Allium subgenus Melanocrommyum: Incomplete lineage sorting, hybridization and trnF gene duplication. Taxon 59: 829–840. Haack, S. 1993. Evidence and Inquiry. Blackwell, Oxford. Hey, J. 2009. On the arbitrary identification of real species. Pp. 15–28 in R. K. Butlin, J. Bridle & D. Schluter (editors), Speciation and Patterns of Diversity. Cambridge University Press, Cambridge. Ho¨randl, E. 2010. Beyond cladistics: Extending evolutionary classifications into deeper time levels. Taxon 59: 345–350. Hudson, R. R. & J. A. Coyne. 2002. Mathematical consequences of the genealogical species concept. Evolution 56: 1557–1565. Hutchinson, J. M. C. & G. Gigerenzer. 2005. Simple heuristics and rules of thumb: Where psychologists and behavioural biologists might meet. Behav. Processes 69: 97–124. Kendall, M. G. & W. R. Buckland. 1971. A Dictionary of Statistical Terms, 3rd ed. Oliver & Boyd, Edinburgh.
Volume 100, Number 1–2 2014
Zander Support Measures in Evolutionary Trees
107
Kline, M. 1985. Mathematics and the Search for Knowledge. Oxford University Press, Oxford. Manzotti, R. 2011. Machine free will: Is free will a necessary ingredient of machine consciousness? Advances Exp. Med. Biol. 718: 181–191. Rannala, B. & Z. Yang. 2003. Bayes estimation of species divergence times and ancestral population sizes using DNA sequences from multiple loci. Genetics 164: 1645– 1656. Rieseberg, L. H. & L. Brouillet. 1994. Are many plant species paraphyletic? Taxon 43: 21–32. Santos, L. M. & L. R. Faria. 2011. The taxonomy’s new clothes: A little more about the DNA-based taxonomy. Zootaxa 3025: 66–68. Scotland, R. W., R. G. Olmstead & J. R. Bennett. 2003. Phylogeny reconstruction: The role of morphology. Syst. Biol. 52: 539–548. Sober, E. 1991. Core Questions in Philosophy: A Text with Readings. Macmillan Library Reference, New York. Werner, O., R. M. Ros, M. J. Cano & J. Guerra. 2004. Molecular phylogeny of Pottiaceae (Musci) based on
chloroplast rps4 sequence data. Pl. Syst. Evol. 243: 147– 164. Yoon, C. K. 2009. Naming Nature: The Clash Between Instinct and Science. W. W. Norton, New York. Zander, R. H. 1993. Genera of the Pottiaceae: Mosses of harsh environments. Bull. Buffalo Soc. Nat. Sci. 32: 1– 378. Zander, R. H. 2007. Nine easy steps for constructing reliable trees from published phylogenetic analyses. Ann. Missouri Bot. Gard. 94: 691–709. Zander, R. H. 2008. Evolutionary inferences from nonmonophyly of traditional taxa on molecular trees. Taxon 57: 1182–1188. Zander, R. H. 2010a. Taxon mapping exemplifies punctuated equilibrium and atavistic saltation. Pl. Syst. Evol. 286: 69–90. Zander, R. H. 2010b. Structuralism in phylogenetic systematics. Biol. Theory 5: 383–394. Zander, R. H. 2013. A Framework for Post-phylogenetic Systematics. Zetetic Publications, St. Louis; CreateSpace Independent Publishing Platform, Amazon.