Support Vector Machine Applied to Study on Quantitative Structure ...
Recommend Documents
a water pump under both, normal and abnormal ... the pump, while erroneous behaviour is placed in .... sets in pumping station \Buma" at Lemmer, The.
INTRODUCTION. The Support Vector Machine SVM is a relatively recent approach introduced by Boser, Guyon, and Vapnik. Boser et al., 1992 , Vapnik, 1995 ...
l(f(xi,α),yi) = Training Error where l is the zero-one loss function, l(y, Ëy)=1, if y = Ëy, and 0 otherwise. Remp is called the empirical risk. ⢠By doing this we are trying ...
Non-separable case: allow training errors min w,b,ξ. 1. 2 w. T w + C l. â i=1 ξi yi((w. T ..... So performance bette
Apr 1, 2014 - Eastman (TE) process is utilized with the SVM algorithm and PLS ...... [30] V. N. Vapnik, Statistical Learning Theory, John Wiley & Sons,.
Support Vector Machines (SVMs) in comparison with other well known .... classifying words into different concepts as defined in the Unified Medical Lan-.
opens the application of SVM regression to ... to begin from scratch with the whole data set (or data .... In order to build exact on-line support vector machines.
Sep 10, 2012 - 2Department of Electrical Engineering. 3Department .... Back Propagation Algorithm (BPA) is used to train the .... mth iteration is defined as. ( ).
esta possível de utilização para previsão volumétrica da produção de florestas plantadas. Palavras-chave: Volume equations; Machines Learning; Schumacher ...
Jun 13, 2014 - Citation: Yu X, Yu Y, Zeng Q (2014) Support Vector Machine Classification of ..... parameters (quantum number, bond indexes, etc.) [27].
wavelet kernel), by which we can construct a wavelet support vector machine (SVM), is presented. The wavelet kernel is a kind of multidimensional wavelet ...
Universitat Pompeu Fabra. Ocata 1, 08003 Barcelona, ..... Joan Serra, Cyril Laurier and Ferdinand Fuhrmann for their helpful suggestions. We also want to thank ...
unlearned data. This paper reviews how to enhance generalization in learning classifiers centering on the. SVM. Keywords: Perceptron, support vector machine, ...
Scanning laser polarimetry (SLP) is an optical imaging tech- nique used to .... sity of California, San Diego, Human Research Protection Program approved all ..... At the time of. SLP imaging, this eye had an abnormal short-wavelength auto-.
The parameters for SVM will be selected by a swarm intelligence algorithm (Particle ... The system security can be enhanced by Intrusion detection. ..... Denial of service (DoS), Remote-to-Local(R2L), User-to-Root(U2R) and .... Intelligence in securi
been applied to EEG analysis. In [11] was used the raw. EEG data as an input to a neural network while in [19] was used
physical processes, such as soil shrinking-swelling, soil crusting, and/or water ...... tention data at one or two points (at the field capacity and the wilting point).
ABSTRACT. In this paper, we propose using support vector machine (SVM) to refine the hypothesized phone transition boundaries given by the HMM-based ...
Jan 17, 2009 - CUSVM: A CUDA IMPLEMENTATION OF SUPPORT VECTOR ..... With cuSVM, it is now practical, on a retail desktop, to apply SVM ...
Jul 7, 2011 ... Numerals belonging to Gujarati script are shown in figure 1. ..... [2] Antani S. and
Agnihotri L.: (1999) Gujarati Character Recognition 5th ICDAR, ...
Computer Science and Information Systems ... Abstract â Principal component analysis and support ... forward, finding the best choices for the kernel function.
and Electronic Engineering, The University of Melbourne, Melbourne,. Australia (email: ...... Royal Holloway College, University of London, UK, Tech. Rep.
Sep 22, 2009 - remote sensing, support vector machines (SVMs). I. INTRODUCTION. HYPERSPECTRAL remote sensors acquire radiant flux data in typically ...
John Wiley & Sons, 1998. [8] V. N. Vapnik ... [25] L. Xin and R. Dan and S. Kevin, âThe role of semantic information in learning question classifiers,â. Proceedings ...
Support Vector Machine Applied to Study on Quantitative Structure ...
Quantitative structureâretention relationships (QSRR) models were constructed for the GC relative retention times (RRTs) of 126 polybrominated diphenyl ether ...
Chromatographia (2014) 77:1387–1398 DOI 10.1007/s10337-014-2735-4
ORIGINAL
Support Vector Machine Applied to Study on Quantitative Structure–Retention Relationships of Polybrominated Diphenyl Ether Congeners Xiaotong Zhang · Xin Zhang · Qiang Li · Zhaolin Sun · Lijuan Song · Ting Sun
Abstract Quantitative structure–retention relationships (QSRR) models were constructed for the GC relative retention times (RRTs) of 126 polybrominated diphenyl ether (PBDE) congeners. First, a number of topological and connectivity indices descriptors were derived from E-dragon software. In a further step, six molecular descriptors were extracted by genetic algorithm (GA) coupled with multiple linear regression (MLR) method. The QSRR model was established using a support vector machine (SVM) algorithm as regression tool. High training sets correlation coefficients R2 indicated that >99.6 % (except for stationary phase CP-Sil 19) of the total variation in the predicted RRTs is explained by the fitted models. It showed that we provided a more accurate model that was subsequently used to predict the RRTs of validation sets. The excellent statistical parameters Q2 loo (correlation coefficient of leave-one-out cross validation) and validation sets correlation coefficients R2 > 99.0 % reveal that the models are robust and have high internal and external predictive capability. According to sum of ranking differences (SRD) validation values, we concluded that DB-1 and DB-5 are the best two models.
X. Zhang · T. Sun (*) College of Sciences, Northeastern University, Shenyang, Liaoning, China e-mail: [email protected] X. Zhang · X. Zhang · Q. Li · Z. Sun · L. Song (*) Liaoning Key Laboratory of Petrochemical Engineering, Liaoning Shihua University, Fushun, Liaoning, China e-mail: [email protected] Q. Li College of Chemical Engineering, Beijing University of Chemical Technology, Beijing, China
Introduction Polybrominated diphenyl ethers (PBDEs) have been widely used as brominated flame retardants (BFRs), which have been manufactured in large quantities and widely used in a variety of consumer goods as computers, furniture, and automobiles [1]. They spread ubiquitously as environmental contaminants and have been found in the air, soil, sediment, and water of natural environments, in the buildings where we live and work, in the sewage we produce, and in the automobiles we drive [2–5]. It is known that PBDEs are persistent, bioaccumulative, endocrine disrupting, and possibly carcinogenic [6]. PBDEs can further interfere by altering liver function, leading to changes in thyroid hormones and vitamin A homeostasis, often resulting in over elimination of the thyroid hormone [7]. Hence, there is a need to characterize the PBDEs as prime types of emerging contaminants. Analysis of PBDEs in environmental samples is preferably conducted with gas chromatographic separation followed by identification using mass spectrometer or electron capture detector [8, 9]. Similar to polychlorinated biphenyls (PCBs), there are 209 possible PBDE congeners; however, only about a dozen congeners exist as major components in the commercial PBDEs mixtures [10]. Due to the lack of PBDE congeners standards, many previous PBDE studies facing the biggest obstacle is how to correctly identifying PBDE congeners. Therefore, quantitative structure–retention relationships (QSRR) models
13
1388
were developed to predict retention parameters efficiently by theoretical descriptors computed from chemical structure [11–14]. For PBDEs prediction, with Rayne and Ikonomou [15] using the available 46 PBDE standards with mono- to deca-bromination, a multiple linear regression equation was used to predict the RRTs of the remaining 163 PBDE congeners. Later, larger GC retention databases became available [8, 16]. Wang and Li [10] used heuristic method to build regression models for 126 PBDE congeners from the literature on seven individual GC capillary columns. Yi and Li [17] used a genetic algorithm with leave-multipleout cross validation (LMOCV) to select descriptors and got multiple-linear regression fitting correlation coefficients (R2) greater than 0.988. But all these previous works focus on the application of the more traditional methods like MLR, heuristic method or artificial neural network (ANN) [18, 19]. The purpose of this work was to develop novel models capable of predicting the PBDEs gas chromatographic relative retention times (RRTs) on various stationary phases using support vector machine (SVM) algorithm. A total of 151 topological and connectivity indices descriptors were derived from E-dragon software and GA coupled with MLR was used to select optimal subsets from large-size molecular descriptors. The models were evaluated by predicting the GC-RRTs of PBDE congeners in a validation set containing 13 molecules. We have also compared the statistical quality of the models using different chemometric tools like sum of ranking differences (SRD) validation method. Finally, we got a superior model with excellent statistical parameters to other reported literatures.
Materials and Methods Genetic Algorithm A major step in constructing the QSRR models is to find a set of molecular descriptors that represent variation in the structural properties of the molecules. However, the complexity of locating such a globally optimal subset of features is usually prohibitive, which motivates the use of more advanced search techniques, such as GA [20]. Genetic algorithm has been proposed by John Holland in the early 1970s [21]. GA is a stochastic method to solve the optimization problems, defined by fitness criteria by applying to the evolution hypothesis of Darwin and different genetic functions, i.e., crossover and mutation. Compared to the traditional search and optimization procedures, GA is global and generally more straightforward to apply to where little or no a priori knowledge about the process to be controlled [22–24].
13
X. Zhang et al.
Support Vector Machine Support vector machine is a new and very promising classification and regression technique developed by Vapnik [25]. Compared to traditional neural networks, SVM possesses the prominent advantages including high generalization capability, avoiding local minima, always having solution by a standard algorithm (quadratic programming), automatically obtaining network topology structure, and lower workload [26]. The SVM algorithm is based on estimating a linear regression function:
f (x) = w · φ(x) + b
(1)
where w and b represent the slope and offset for the regression line, x is a high-dimensional input space, ϕ is a kernel function that can map the input space x to a higher or infinite dimensional space. f(x) is the linear regression function. In case of SVM, the regression function is calculated by minimizing: n
1 1 T c(f (xi ), yi ) w w+ 2 n
(2)
i=1
where 1/2wTw is a term characterizing the model complexity and c(f(xi),yi) is a loss function, y is the target and n is the number of samples [27]. Multiple types of kernel functions are often used in SVM, including linear, polynomial, radial basis function and sigmoid function [28]. In this study, we construct the SVM models using the Gaussian radial basis function (RBF):
2 k(¯xi , x¯ j ) = exp(−r x¯ i − x¯ j )
(3)
As a new and powerful modeling tool, SVM has gained much interest in pattern recognition and function approximation applications recently. The more details of the theoretical background of SVM can be found in Ref. [29–31]. Here, we give only a brief introduction to its main principle. Model Building Data Set and GC Systems The GC relative retention times of 126 PBDE congeners on 7 stationary phases were taken from Ref. [16], and presented in Table 1. The specific chromatographic conditions of the capillary GC columns and temperature programs used to collect the retention data in the present work are shown in Table 2. To enable comparison between stationary phases, a similar oven temperature program was used for all columns. The data set was divided randomly into a training set containing 100 molecules, which was used for model generation, a test set which consisted of 13
1389
SVM Applied to Study on QSRR Table 1 Experimented and SVM predicted gas chromatographic relative retention time data for PBDEs on seven stationary phases PBDE
molecules was used to take care of the overtraining and a validation set, consisted of 13 molecules, was used to evaluate the produced models. Molecular Descriptors Generation All structures were drawn with the ChemBioDraw 2010 software. Then, the geometry optimizations were performed with the program package DMol3 in the Materials Studio (MS) of Accelrys Inc. The resulting geometry was transferred into the E-Dragon program (Talete srl, DRAGON for
Windows–Software for molecular descriptors calculation, Milano, Italy, 2007) to obtain 151 descriptors, grouped in topological and connectivity indices classes [32]. One of the challenging parts in developing models is to choose suitable parameters encoding different aspects of the molecular structure. First, any descriptor that had identical or zero values greater than 90 % of the compounds was eliminated. Furthermore, to decrease the redundancy existing in the descriptors data matrix, the correlations of descriptors with each other were examined, and collinear descriptors which showed high interrelation (i.e., r > 0.95) were detected.
13
1392
X. Zhang et al.
Table 2 GC conditions for PBDE retentions on different columns Column
Carrier gas: Inlet pressure 25 psi, except for CP-Sil19 35 psi, Average velocity 38.5 cm/s, except for HT-8 35.8 cm/s, CP-Sil19 33.4 cm/s
After this procedure, we identified 45 molecular descriptors to be considered in further analysis. For the selection of the most important descriptors, GA was run many times with different initial sets of population. At the end, a population of good models was obtained [33]. The descriptors, selected by this method, were used to construct some linear and nonlinear models with the employment of the MLR and SVM techniques [34, 35]. First, for each of the seven columns of the training set, a simple model was established by MLR using GA variable selection to identify, within the 45 molecular descriptors, a small subset encoding the effect of PBDE structure on RRT for the considered stationary phases. Finally, six molecular descriptors were chosen to build the QSRR model and their specific information is presented in Table 3. Specifically, four topological and two molecular connectivity indices descriptors were selected in the QSRR model. The topological descriptors describe the atomic connectivity in the molecule. And the idea behind the connectivity index is to use available information on some molecular property for their construction [36]. In this work, GAMLR analysis was performed using the Matlab (2010b) and SPSS software.
Table 3 The molecular descriptors selected by GA-MLR in QSRR model No. Descriptor
Abbreviate Class
1 2
W S3K
Topological descriptor Topological descriptor
TI2 CENT X5
Topological descriptor Topological descriptor Connectivity indices
Wiener W index 3-path Kier alpha-modified shape index Second Mohar index TI2 Centralization Connectivity index chi-5
3 4 5 6
Valence connectivity index X5v chi-5
Connectivity indices
to establish the QSRR model of PBDEs to obtain better predicted results. All the programs were achieved in matlab matrix laboratory. The goodness of the correlation of the training set was examined by the correlation coefficient (R2). The stability of the models was evaluated against the cross-validated coefficient, Q2 loo, which described the stability of an obtained model by focusing on the sensitivity of the model to the elimination of any single data point. Q2 loo is defined as follows: 2
n (yi − yˆ i )2 = 1 − i=1 n ¯ )2 i=1 (yi − y
(4)
SVM Model Building
Q
Support vector machine, a non-linear algorithm, was developed for regression and classification and gained popularity in QSPR studies for drug design and biological activity in recent years [37, 38]. Here, we used SVM method
where yi is the experimented value, yˆ i is the estimator of the dependent variable value obtained via iteration in leave-one-out cross validation; y¯ is the average of experimented value, n is the number of training set. The external
13
loo
1393
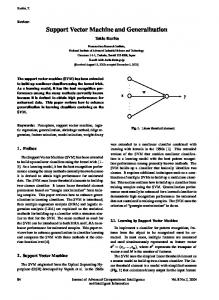
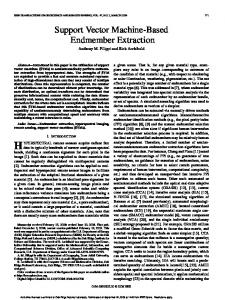
SVM Applied to Study on QSRR Fig. 1 Correlation coefficients R2 and root mean squared error RMS vs. number of descriptors
Table 4 GA-MLR regression equations listed on different stationary phases Column
predictive ability of the model was examined by the correlation coefficient (R2) of validation set. Also the root mean square error (RMS) function was employed to evaluate the performances of the SVM. It was computed using the following formula: n yi − yi )2 i=1 (ˆ (5) RMS = n where yˆ i is the target value, yi is the experimental value and n is the number of compounds in analyzed set.
Results and Discussion The Molecular Descriptors Selected By GA‑MLR By the GA-MLR method, regression equations were obtained using the GC-RRTs of the 100 PBDE congeners in the training set. To gain the optimum number among these molecular descriptors, plot of R2 and RMS values against the number of descriptors shown in Fig. 1 provide guidance
in deciding the number of descriptors to be retained in the QSRR models. As seen in Fig. 1a, for the former six GC stationary phases, the R2 increases gradually with number of descriptors until reaches a plateau while RMS declines until drops a lower limit value. However, for CP-Sil 19, the varieties of R2 and RMS with number of descriptors differ from the above GC columns as shown in Fig. 1b. Considering the seven columns, we selected optimal six molecular descriptors which have a large influence on improving correlation to build effectual models. The resulting regression equations and more specific information for individual GC stationary phases are summarized in Table 4. The descriptive performance of each GA-MLR model was evaluated by usual statistical parameters: correlation coefficient (R2), the relative standard error (SE) and the F test value (F), respectively. Correlation coefficients appeared in Table 4 show that R2 of GA-MLR are greater than 0.990, except for the CPSil 19 column. At the same time, correlation coefficient R2 of CP-Sil 19 column is 0.933. Therefore, the six molecular descriptors we chose can successfully represent RRT in a regression equation.
13
1394 Table 5 Comparison of the QSRR models developed in the present work and those previously published
X. Zhang et al. Column
DB-1
Model Wang [10]
Zhang [19]
Yi [17]
Angelo [18]
This work
n
100
126
126
126
100
m
4 0.990
5 0.9904
3 0.9934
5 0.9960
6 0.9983
0.988 100
0.9886 126
0.9938 126
0.9956 126
0.9970 100
4 0.990
5 0.9919
3 0.9947
5 0.9968
6 0.9980
0.989 100
0.9904 126
0.9945 126
0.9965 126
0.9970 100
4 0.985
5 0.9804
3 0.9917
5 0.9941
6 0.9962
0.983 100
0.9844 126
0.9910 126
0.9934 126
0.9949 100
4 0.986
5 0.9920
3 0.9924
5 0.9965
6 0.9977
0.985 100
0.9912 126
0.9915 126
0.9960 126
0.9969 100
4 0.992
5 0.9923
3 0.9925
5 0.9953
6 0.9978
0.991 100
0.9915 126
0.9917 126
0.9947 126
0.9970 100
4 0.991
5 0.9897
3 0.9890
5 0.9926
6 0.9969
0.990 100
0.9898 126
0.9875 126
0.9912 –
0.9957 100
R2
4 0.990
5 0.9321
3 0.9774
– –
6 0.9921
Q2 loo
0.988
0.9140
0.9661
–
0.9808
R2 Q2 loo DB-5
n m 2
R Q2 loo HT-5
n m R2 Q2 loo
DB-17
n m R2 Q2 loo
DB-XLB
n m R2 Q2 loo
HT-8
n m 2
R Q2 loo CP-Sil19
n m
n and m indicate the number of PBDE congeners and model descriptors, respectively
The Major Contributing Molecular Descriptors GC-RRTs of PBDEs on the seven stationary phases are strongly dependent on the Wiener index, the first topological index used in chemistry [39] as shown in Table 4. It is the sum of distances between all the pairs of vertices in a hydrogen-suppressed molecular graph. The correlations between RRTs of PBDEs and Wiener index show that the magnitude of intermolecular interactions between the compounds and the stationary phase is related to the degree of branching of the molecules. It is noticed that Wiener index tends to increase with increasing number of para bromines and to decrease with increasing ortho bromines, within individual homologs. Within a PBDE homolog, the positions of bromines determine the optimal molecular conformation and affect the GC retention. No doubt, the differences in RRTs among structural isomers may not be fully accounted for by Wiener index alone although plots of Ref. [16]. In addition, other
13
literatures also confirmed the influence of the RRT of Wiener index. For example, Wang and Li [10] concluded that the intermolecular interactions between PBDEs and the stationary phase are related to Wiener or Randic index. Wang and Yao [40] showed that there were significant relationships between retention indices of saturated esters on seven stationary phases of different polarity and the Wiener index. Influence of Different Stationary Phases By analyzing our correlation coefficients R2 and cross-validated coefficient Q2loo of PBDEs (Table 5) on similar stationary phases (DB-1, DB-5, DB-17, DB-XLB, HT-8 and CP-Sil 19), we can clearly find that correlation coefficients become lower (R2 = 0.9983–0.9921) for these stationary phases. As we all know that the different polarity of the stationary phases affected the elution order of compounds. Meanwhile, this point reflected in the model represents the
1395
SVM Applied to Study on QSRR
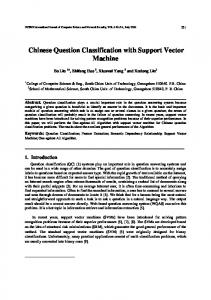
influence of correlation coefficients R2 and cross-validated coefficient Q2 loo. Therefore, we further confirmed that the polarity of the stationary phase increases, as the deviations from linearity between the set of RRTs increase. Further, the retention database for PCBs produced by Frame [41] also showed correlation of the elution orders of these two classes of pollutants. So the overall result is a further indication of the usefulness of the present approach of retention time prediction for various classes of polyhalogenated aromatic compounds. The Result of SVM Model The purpose of this work was to develop novel models capable of predicting PBDEs chromatographic relative retention times (RRTs) on various stationary phases using SVM algorithm. After the establishment of the GA-MLR model, SVM was used to develop a model by the training set compounds, based on the same subset of descriptors. The test set which consisted of 13 molecules was used to take care of the SVM overtraining. The SVM performance for regression is dependent on the combination of several factors, such as the kernel function type, the capacity parameter c, ε of the ε-insensitive loss function and its corresponding parameters [33]. The process of optimization of SVM parameters relied on Grid Search Method. The optimum values of c and ε of the ε-insensitive loss function in the SVM model were set at 16 and 0.0625, respectively. All programs’ implementation relies on the programs we have written on Matlab. Now, the results of external validation sets and test sets of 7 stationary phases are shown in Fig. 2. By observing the statistical parameters for SVMs (Table 6), we can draw that our SVM models’ validation sets correlation coefficients R2 are larger than 0.9903, except that for the CP-Sil 19 column it is 0.9556. The RMS of all validation sets is less than 0.014, except that for the CP-Sil 19 column it is 0.055. It indicated that our SVM models have external predictive abilities. By comparing the residual plots, we can conclude that all the validation sets and test sets PBDEs points on 7 stationary phases are distributed near the zero line, meaning that there are no systematic errors in our calculated results. These results verify that the SVM QSRR models of each column have good fitting abilities and statistical significance. Comparison of SRD of Different SVM Models The qualities of the models have also been checked by sum of ranking differences (SRD) validation method [42]. It described a recently developed novel method of ranking based on the sum of ranking differences to solve model
comparison task. The closer the SRD value to zero, the better is the model. Using the data of Table 1 and selecting the experimental seven columns data as reference, respectively, we calculated SRD of SVM predicted relative retention time data for PBDEs on seven stationary phases. The comparison between calculation results of SRD and model correlation coefficients R2 has been listed in Table 7. According to SRD values (Table 7), it is clearly seen that model DB-1 and DB-5 are the best two models. CP-Sil 19 is the relatively worse model. The order of the models according to the goodness of prediction is DB-1 > DB-5 > DB-17 > DBXLB > HT-5 > HT-8 > CP-Sil 19. The sign “>” means that the previous model is better than the later one. According to R2 values, the goodness of prediction is DB-1 > DB-5 > DB-XLB > DB-17 > HT-8 > HT-5 > CPSil 19. By comparing the R2 and SRD values between DB-17 and DB-XLB columns, similar performance of the model can be observed, the same can be observed in HT-5 and HT-8 columns. Finally, we compare our work with other QSRR models. Several authors have constructed QSRR models of PBDEs for prediction. Some statistical parameters are listed in Table 5. Our training sets correlation coefficients R2 and cross-validated coefficient Q2 loo including CP-Sil 19 column are all higher than the literature results. It is evident that our SVM models exhibit a better descriptive and predictive ability than the other QSRR models established so far.
Conclusions QSRR models between GC-RRTs of 126 PBDE congeners on 7 stationary columns and various topological and connectivity indices molecular descriptors were successfully established using SVM method. In this work, GA-MLR selected molecular descriptors Wiener index, although confirm the intermolecular interactions between PBDEs and the stationary phase are related to the degree of branching of the molecules. The SVM results show that the models have strong predictive abilities with high correlation coefficients R2 of both training and validation sets, and robust stability with excellent statistical parameters Q2 loo. Acceptable values of the models in terms of different validation parameters such as internal prediction, external prediction and sum of ranking differences confirm reliability of the models. Finally, our SVM QSRR models of 126 PBDE congeners provided a more accurate and reliable model than those existing in the literature. In addition, we expect that our QSRR models may have some guiding significance for the rapid analysis of PBDE congeners in the complex environmental samples.
13
1396
X. Zhang et al.
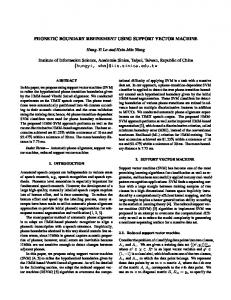
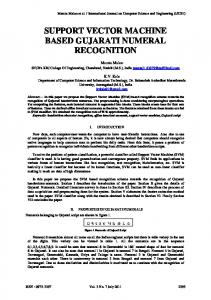
Fig. 2 Experimented vs. predicted RRTs of PBDE congeners in the validation sets and test sets on different columns and distribution of residuals
13
1397
SVM Applied to Study on QSRR
Fig. 2 continued Table 6 The statistical parameters for SVM
Table 7 SRD values compared with model correlation coefficients R2 of seven GC columns Column
R2
SRD
DB-1 DB-5 HT-5 DB-17 DB-XLB HT-8
0.9983 0.9980 0.9962 0.9977 0.9978 0.9969
266 266 300 282 288 368
CP-Sil19
0.9921
608
Acknowledgments The corresponding author is grateful for the financial support from the National Natural Science Foundation of China (21376114), and Department of Education of Liaoning Province, which made this work possible.
References 1. Renner R (2000) Environ Sci Technol 34:452–453 2. Hale RC, La Guardia MJ, Harvey E, Gaylor MO, Mainor TM (2006) Chemosphere 64:181–186 3. Hazrati S, Harrad S (2006) Environ Sci Technol 40:7584–7589 4. Lundstedt-Enkel K, Karlsson D, Darnerud PO (2010) J Chemometrics 24:710–718 5. Cunha S, Kalachova K, Pulkrabova J, Fernandes J, Oliveira M, Alves A, Hajslova J (2010) Chemosphere 78:1263–1271 6. Meerts IA, Van Zanden JJ, Luijks EA, van Leeuwen-Bol I, Marsh G, Jakobsson E, Bergman Å, Brouwer A (2000) Toxicol Sci 56:95–104 7. Vonderheide AP, Mueller KE, Meija J, Welsh GL (2008) Sci Total Environ 400:425–436 8. Wei H, Yang R, Li A, Christensen ER, Rockne KJ (2010) J Chromatogr A 1217:2964–2972 9. Vonderheide AP (2009) Microchem J 92:49–57 10. Wang Y, Li A, Liu H, Zhang Q, Ma W, Song W, Jiang G (2006) J Chromatogr A 1103:314–328 11. Zhang X, Ding L, Sun Z, Song L, Sun T (2009) Chromatographia 70:511–518 12. Zhang XT, Ren C, Guo JJ, Song LJ, Sun T (2012) Adv Mater Res 347:1769–1773 13. Fatemi MH, Ghorbanzad’e M, Baher E (2010) Anal Lett 43:823–835
13
1 4. Fatemi MH, Malekzadeh H (2012) J Sep Sci 35:2088–2094 15. Rayne S, Ikonomou MG (2003) J Chromatogr A 1016:235–248 16. Korytár P, Covaci A, de Boer J, Gelbin A, Brinkman UAT (2005) J Chromatogr A 1065:239–249 17. Yi Z, Li L, Zhang A, Wang L (2011) Chin J Chem 29:2495–2504 18. D’Archivio AA, Giannitto A, Maggi MA (2013) J Chromatogr A 1298:118–131 19. Zhang YH, Liu SS, Liu HY (2007) Chromatographia 65:319–324 20. Goodarzi M, Jensen R, Vander Heyden Y (2012) J Chromatogr B 910:84–94 21. Cai W, Xia B, Shao X, Guo Q, Maigret B, Pan Z (2001) J Mol Struct: THEOCHEM 535:115–119 22. Noorizadeh H, Farmany A (2010) Chromatographia 72:563–569 23. Whitley D (1994) Stat Comput 4:65–85 24. Jalali Heravi M, Kyani A (2007) Eur J Med Chem 42:649–659 25. Vapnik V (1998) Statistical learning theory. Wiley, New York 26. Luan F, Xue C, Zhang R, Zhao C, Liu M, Hu Z, Fan B (2005) Anal Chim Acta 537:101–110 27. Zhang J, Wang B, Zhang X, Huang DS, Zhang X, Reyes García C, Zhang L (2010) Advanced intelligent computing theories and applications. Springer, Berlin, pp 83–90 28. Cong Y, Li BK, Yang XG, Xue Y, Chen YZ, Zeng Y (2013) Chemom Intell Lab Syst 29. Vladimir VN, Vapnik V (1995) The nature of statistical learning theory. Springer, Heidelberg 30. Scholkopf B, Sung KK, Burges CJ, Girosi F, Niyogi P, Poggio T, Vapnik V (1997) Signal Proces, IEEE T 45:2758–2765 31. Smola AJ, Schölkopf B (2004) Stat Comput 14:199–222 32. Tetko IV, Gasteiger J, Todeschini R, Mauri A, Livingstone D, Ertl P, Palyulin VA, Radchenko EV, Zefirov NS, Makarenko AS (2005) J Comput Aid Mol Des 19:453–463 33. Riahi S, Pourbasheer E, Ganjali MR, Norouzi P (2009) J Hazard Mater 166:853–859 34. Pourbasheer E, Riahi S, Ganjali MR, Norouzi P (2009) Eur J Med Chem 44:5023–5028 35. Pourbasheer E, Riahi S, Ganjali MR, Norouzi P (2010) Eur J Med Chem 45:1087–1093 36. Randic´ M (2001) J Mol Graph Model 20:19–35 37. Moskovkina M, Bangov I, Patleeva AZ (2013) Bulg Chem Commun 45:9–23 38. Bangov I, Moskovkina M, Patleeva A (2010) Bulg Chem Commun 42:338–342 39. Dobrynin AA, Entringer R, Gutman I (2001) Acta Appl Math 66:211–249 40. Wang Y, Yao X, Zhang X, Zhang R, Liu M, Hu Z, Fan B (2002) Talanta 57:641–652 41. Frame GM (1997) Fresen J Anal Chem 357:714–722 42. Héberger K, Kollár-Hunek K (2011) J Chemometrics 25:151–158