International Journal of Computational Intelligence Systems, Vol.1, No. 4 (December, 2008), 299-303
SUPPORT VECTOR REGRESSION WITH INTERVAL-INPUT INTERVAL-OUTPUT Wensen An1,2†, Cecilio Angulo2, Yanguang Sun1 1 2
R&D Center, Automation Research and Design Institute of Metallurgical Industry, 100071 Beijing,China Knowledge Engineering Research Group, Universitat Politècnica de Catalunya, 08800 Vilanova i la Geltrú, Barcelona, Spain
Received: 18-04-2008 Revised: 02-06-2008 Support vector machines (classification and regression) are powerful machine learning techniques for crisp data. In this paper, the problem is considered for interval data. Two methods to deal with the problem using support vector regression are proposed and two new methods for evaluating performance for estimating prediction interval are presented as well. Keywords: Support vector regression, Interval-input interval-output, Uncertainties, Quadratic programming
1. Introduction In machine learning, we usually hope that the obtained sample data are as precise as possible in order to construct an exact model. For example, the system model often guides real applications in complex industrial process. And the success of the model-based applications generally depends on how exactly models reproduce the behavior of the real industrial process that they represent1. However, the sample data is usually imprecise and may be in some case missing, due to the various limitations. For example, even under the same experimental conditions with the same measuring tools, the obtained data usually differ from one to another because the measuring tools are never perfectly precise and environmental condition changes in industrial measurements2. Moreover, discretization is utilized to describe qualitatively the sample data in order to speed up learning process when existing large-scale training dataset3, 4.This is to say, the data often has the feature of uncertainty in real life. Generally, interval is a common tool to describe the data with uncertainty5, 6. Currently, little work has been done to study support vector machines (SVM)7, 8 with interval information. Interval-based support vector classification problems are discussed in literatures4, 9, 10, while Chuang and Hwang11, 12, 13, 14, 15 paid attention to regression problems with interval output. However, the methods of †
Chuang and Hwang were not completely based on interval because the input data they used were still crisp, not interval, that is, their methods were based on crispinput interval-output (CIIO) in their research. In this paper, the interval-input interval-output (IIIO) problems based on support vector regression (SVR) are discussed. Moreover, we give two definitions of prediction accuracy in order to evaluate the differences between predicted outputs and real outputs. The rest of the paper is organized as follows. In section 2, we discuss the decomposed approach to deal with IIIO problems based on SVR technique. First, we give the basic idea, and then the simulation results are demonstrated. Finally, two definitions of prediction accuracy to evaluate the differences between predicted outputs and real outputs are presented. Following that section 3 studies quadratic programming (QP) based SVR method to solve IIIO problems. Section 4 concludes the paper with a brief summary.
2.
Decomposed approach
Let the dataset of intervals I D be: I
D = {( I X i , I Yi ) i = 1,L , n} ∈ I m × I.
with interval input I X i and associated targets interval output I Yi , respectively. where
Corresponding author. Tel: +86 10-63812255, Fax: +86 10-63851580. E-mail:
[email protected]
Published by Atlantis Press Copyright: the authors 299
(1)
International Journal of Computational Intelligence Systems, Vol.1, No. 4 (December, 2008), 299-303
W.S. An, C. Angulo and Y.G. Sun m
I I
denotes m-dimensional closed interval;
X i = ( I X i1 , I X i 2 ,L , I X im )T ; I
X ij = ( xij ; sij ), I Yi = ( yi ; ri );
(2) I
xij , sij denotes center and radius of interval X ij ; yi , ri denotes center and radius of interval I Yi ; xij , sij , yi , ri ∈ ; sij , ri ≥ 0
Suppose the function, which approximates the relations between the interval input and interval output, is expressed as: I (3) Y = f (IX) Moreover, by denoting cY , rY center and radius of the interval output I Y , i.e. IY = (cY ; rY ) , we can obtain: I (4) Y = f ( I X ) = cY ± rY = g(xij ; sij ) ± h(xij ; sij ) This means that standard SVR technique can be utilized to solve regression problems with interval by decomposing interval to its center and radius.
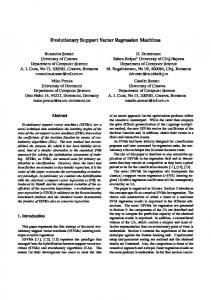
Fig. 1. This is Sinc function and generated sample data.
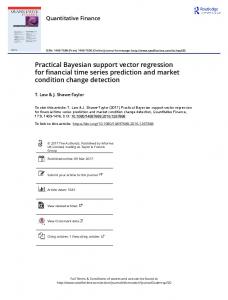
Fig.2. This is comparisons between predicted intervals and real ones used by Sinc function.
Published by Atlantis Press Copyright: the authors 300
International Journal of Computational Intelligence Systems, Vol.1, No. 4 (December, 2008), 299-303
Support Vector Regression with Interval-Input Interval-Output
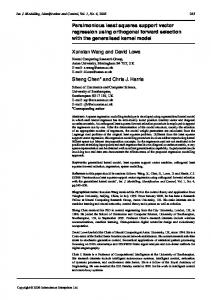
Now we demonstrate the results of the method through two experiments. In order to get some sample data, we first generate 150 points from Sinc function, whose expression is as f ( x) = Sinc( x) = sin x x , and 2dimensional Gabor function16, whose expression is as f ( x) = 0.5π * exp(−2 x 2 ) cos(2π x 2 ) , respectively; then create 150 pairs of interval by selecting two points randomly among them each time. Finally, we randomly select one of the 120 pairs of interval as the training data, the rest as the test data. In the experiments, LIBSVM17 is utilized and Guassian RBF is selected as the kernel of SVR. Moreover, 10-fold cross-validation method is used to obtain the parameters of kernel functions. The Sinc function and generated sample data from it are shown in figure 1, while figure 2 shows the prediction results between predicted intervals and real interval. In figure 2, the dotted line denotes the real intervals and the real line denotes the predicted intervals. The symbols of “plus” and “star” denote the centers of real intervals and predicted intervals, respectively. The 2-dimensional Gabor function and generated sample data from it are shown in figure 3, while figure 4
Fig. 3. This is Gabor function and generated sample data.
Fig.4 This is comparisons between predicted intervals and real ones used by Gabor function.
Published by Atlantis Press Copyright: the authors 301
International Journal of Computational Intelligence Systems, Vol.1, No. 4 (December, 2008), 299-303
W.S. An, C. Angulo and Y.G. Sun
shows the prediction results between predicted intervals and real interval. In figure 4, the dotted line denotes the real intervals and the real line denotes the predicted intervals. The symbols of “plus” and “star” denote the centers of real intervals and predicted intervals, respectively. In order to evaluate the differences between predicted intervals and real intervals, we define two expressions of prediction accuracy as follows. Suppose real interval output and predicted interval output corresponding with the same interval input I X i are denoted by I Yi and I Y%i . The area of rectangle by interval I X i and I Yi is denoted by Aireal , the area of rectangle constructed by interval I X i and I Y%i is denoted by Aipred , and the overlapped area between the above rectangles is denoted by Ailap . Then we have the following definitions:
Accu _1 =
1 N
2 Ailap real + Aipred i
N
∑A i =1
Accu _ 2 =
(5)
i =1
N
∑A
real i
i
where X i 0 = ( xi 0 ; si 0 ) = (1;1) , and a0 , a1 ,L am ∈ are regression coefficients. According to the interval analysis5, 6, the expression (6) can be formulated: I Yi = a0 ( xi 0 ; si 0 ) + a1 ( xi1 ; si1 ) + L + am ( xim ; sim ) m
N
+ ∑ Aipred i
According to the expression (5), the accuracy rates on the two experiments are as follows: i) for the sample data generated from Sinc function, Accu _1 =0.81221 and Accu _ 2 =0.96736; ii) for the sample data generated from 2-diminsional Gabor function, Accu _1=0.88778, Accu _ 2 =0.97547. From the results of the experiments, the accuracy rate in the second form is higher than the first one, and this fact is easy to understand because that, when the overlapped rectangle constructed by predicted interval output is big on the big interval input and small on the small interval input, the big overlapped rectangles will “weaken” the influences of the small ones according to the second formulation of prediction accuracy. 3. QP-based approach As we know, the standard algorithm of SVR can be realized via solving a quadratic programming (QP) problem, and then utilizes the kernel trick. So now a problem comes across, i.e. can we construct an intervalbased SVR model by solving a QP problem like standard SVR?
m
= (∑ a j xij ; ∑ a j sij ) j =0
(7)
j =0
= (a xi ; a si ) T
where
T
a = ( a0 , a1 ,L , am )T
s i = ( si 0 , si1 ,L , sim ) . T
,
x i = ( xi 0 , xi1 ,L , xim )T ,
In a similar way to build the standard quadratic loss function based SVR algorithm, the QP-based interval SVR model can be constructed as follows: min
N
2∑ Ailap
Suppose we have the datasets of intervals like expression (1) and expression (2), and the non-linear regression model can be described as follows: I Yi = ψ ( I X i ) = a0 I X i 0 + a1 I X i1 + L + am I X im (6)
n 1 2 C⎡ n 2 n 2 ⎤ a + ⎢ ∑ ξ1i + ∑ (ξ 2i + ξ 2∗i2 ) + ∑ (ξ32i + ξ3∗i2 ) ⎥ 2 2 ⎣ i =1 i =1 i =1 ⎦ ⎧ aT si ≤ ξ1i ⎪ ⎪ yi − aT xi ≤ ξ 2i ⎪ T ∗ ⎪a xi − yi ≤ ξ 2i , i = 1, 2,L , n s.t. ⎨ T T ⎪a x + a si ≤ yi − ri + ξ3i ⎪ T ∗ T ⎪a x − a si ≥ yi − ri − ξ3i ⎪ ∗ ∗ ⎩ξ1i , ξ 2i , ξ 2i , ξ3i , ξ3i ≥ 0
(8)
However, the formulation (8) is the primal model of interval SVR. How to efficiently solve its dual problem and make good use of kernel trick, or realize it directly in the primal problem18 is still a further research topic. 4. Conclusions We have presented the approaches to deal with problem with interval-input interval-output using support vector regression algorithm in this paper. We have also proposed two ways to evaluate the prediction accuracy, that is, the differences between predicted values and real values. In future work, we intend to solve the proposed QP-based interval SVR model and employ them to the industrial applications. Acknowledgements Wensen An acknowledges the helpful discussions with Prof. Andreu Català and Dr. Xavier Parra. The authors would like to thank anonymous reviewers for their
Published by Atlantis Press Copyright: the authors 302
International Journal of Computational Intelligence Systems, Vol.1, No. 4 (December, 2008), 299-303
Support Vector Regression with Interval-Input Interval-Output
valuable comments that have helped to improve the quality of this paper. References 1. M. Rebolledo, Rough Intervals--Enhancing Intervals for Qualitative Modeling of Technical Systems, Artif. Intell., 170(8) (2006): 667 685. 2. P. Nivlet, F. Fournier and J. Royer, Interval Discriminant Analysis: An Efficient Method to Integrate Errors in Supervised Pattern Recognition, in 2nd Int. Symp. Imprecise Probabilities and Their Applications, eds. G. de Cooman, T. Fine and T. Seidenfeld, (Ithaca, New York , 2001), pp.284 292. 3. H. H. Bock and E. Diday, Analysis of Symbolic Data: Exploratory Methods for Extracting Statistical Information from Complex Data, Series: Studies in Classification, Data Analysis, and Knowledge Organization (Springer-Verlag, NY, 2000). 4. C. Angulo, D. Anguita and L. Gonzalez-Abril, Support Vector Machines for Interval Discriminant Analysis, Neurocomputing, 71(7-9) (2008): 1220 1229. 5. R. E. Moore, Interval Analysis, (Prentice-Hall, Englewood, NJ, 1966). 6. L. Jaulin, M. Kieffer, O. Didrit and E. Walter, Applied Interval Analysis (Springer-Verlag, Berlin, 2001). 7. V. N. Vapnik, The Nature of Statistical Learning Theory (Springer, NY, 1999). 8. V. N. Vapnik, Statistical Learning Theory (Wiley, NY, 1998). 9. P. Lingras and C. J. Butz, Interval Set Classifiers Using Support Vector Machines, Proc. 2004 Conf. North American Fuzzy Information Processing Society (NAFIPS04), 2: 707 710, 2004. 10. Y. G. Zhao, Q. M. He and Q. Chen, An Interval Set Classification Based on Support Vector Machines, Proc. the Joint Int. Conf. Autonomic and Autonomous Systems and Int. Conf. Networking and Services (ICAS/ICNS 2005), 2005. 11. J. T. Jeng, C. C. Chuang andS. F. Su, Support Vector Interval Regression Networks for Interval Regression Analysis, Fuzzy Sets Syst., 138(2) (2003): 283 300. 12. D. H. Hong and C. H. Hwang, Support Vector Machine for Interval Regression, Proc. the Autumn Conf., Korean Statistical Society, 67 72, 2004. 13. D. H. Hong and C. H. Hwang, Interval Regression Analysis Using Quadratic Loss Support Vector Machine, IEEE T. Fuzzy Syst., 13(2)(2005): 229 237. 14. C. H. Hwang, D. H. Hong, E. Na, H. Park and J. Shim, Interval Regression Analysis Using Support Vector Machine and Quantile Regression, Springer Lect. Notes Artif. Int., 3613 (2005): 100 109. 15. C. H. Hwang, D. H. Hong and K. H. Seok, Support Vector Interval Regression Machine for Crisp Input and Output Data, Fuzzy Sets Syst., 157 (2006): 1114 1125. 16. Z. H. Zhou, J. X. Wu and W. Tang, Ensembling Neural Networks: Many Could Be Better Than All, Artif. Intell., 137(1-2) (2002): 239 263.
17. C. C. Chang, C. J. Lin, LIBSVM: A Library for Support Vector Machines (Version 2.3), Department of Computer Science, National Taiwan University, 2001, http://www.csie.ntu.edu.tw/~cjlin/libsvm. 18. O. Chapelle, Training A Support Vector Machine in The Primal, Max Planck Institute for Biological Cybernetics Technical Report, No.TR-147, April 2006, http://www.kyb.mpg.de/publications/attachments/tr_3597 [1].pdf.
Published by Atlantis Press Copyright: the authors 303