Dec 31, 1996 - 0.2 A Short Review of Approximation and Regression Estimation . . 7 ... 2.3.2 Piecewise Polynomial and Linear Loss Function . . . . . . 25.
Regression Estimation with Support Vector Learning Machines Alexander Smola1 in collaboration with Chris Burges2 Harris Drucker3 Steve Golowich4 Leo van Hemmen5 Klaus-Robert Muller6 Bernhard Scholkopf7 Vladimir Vapnik8 December 31, 1996 Version 1.01
1 Physik Department, Technische Universitat Munchen 2 Lucent Technologies, Holmdel 3 Lucent Technologies, Holmdel 4 Princeton University, Princeton 5 Physik Department, Technische Universitat Munchen 6 GMD First, Berlin 7 Max Planck Institut fur biologische Kybernetik 8 AT&T Research, Holmdel
1 Support Vector Learning Machines (SVLM) have become an emerging technique which has proven successful in many traditionally neural network dominated applications. This is also the case for Regression Estimation (RE). In particular we are able to construct spline approximations of given data independently from the number of input-dimensions regarding complexity during training and with only linear complexity for reconstruction - compared to exponential complexity in conventional methods. I would like to thank Yann LeCun, Patrick Ha�ner, Martin Hasler, Darshyang Lee, Noboru Murata, Craig Nohl, Patrice Simard, Charles Stenard and Pascal Vincent for many inspiring discussions. This project was made possible through funding by ARPA and the GNSF.
This text was created with LATEX 2" using the document class article and the german package. It can be downloaded from http:/www. rst.gmd.de/~ smola
Contents 0 A Roadmap
0.1 How to read this Thesis . . . . . . . . . . . . . . . . . . . . . . . 0.2 A Short Review of Approximation and Regression Estimation . . 0.3 The Reason for Support Vectors . . . . . . . . . . . . . . . . . . .
1 Introduction
1.1 The Regression Problem . . . . . . . . . . 1.2 A Special Class of Functions . . . . . . . . 1.2.1 Least Mean Square Fitting . . . . . 1.2.2 Ridge Regression . . . . . . . . . . 1.3 Linear Support Vectors . . . . . . . . . . . 1.4 The Lagrange Function and Wolfe's Dual 1.5 Karush-Kuhn-Tucker theorem . . . . . . . 1.6 The Dual Support Vector Problem . . . .
. . . . . . . .
. . . . . . . .
. . . . . . . .
. . . . . . . .
. . . . . . . .
. . . . . . . .
. . . . . . . .
2 Loss Functions
2.1 Maximum Likelihood Estimators . . . . . . . . . . . . 2.2 Common Density Models . . . . . . . . . . . . . . . . . 2.2.1 Gauss . . . . . . . . . . . . . . . . . . . . . . . 2.2.2 Laplace . . . . . . . . . . . . . . . . . . . . . . 2.2.3 Huber . . . . . . . . . . . . . . . . . . . . . . . 2.2.4 �-insensitive Loss Function . . . . . . . . . . . . 2.3 Solving the Optimization Equations . . . . . . . . . . . 2.3.1 Polynomial Loss Functions . . . . . . . . . . . . 2.3.2 Piecewise Polynomial and Linear Loss Function 2.3.3 Local Loss Functions . . . . . . . . . . . . . . .
3 Kernels 3.1 3.2 3.3 3.4 3.5
Nonlinear Models . . Mercer's Condition . . Some Useful Kernels . Intermediate Mapping Tensor Products . . .
. . . . .
. . . . .
. . . . .
. . . . .
. . . . . 2
. . . . .
. . . . .
. . . . .
. . . . .
. . . . .
. . . . .
. . . . .
. . . . .
. . . . .
. . . . .
. . . . .
. . . . .
. . . . .
. . . . . . . .
. . . . . . . .
. . . . . . . .
. . . . . . . .
. . . . . . . .
. . . . . . . .
. . . . . . . . . .
. . . . . . . . . .
. . . . . . . . . .
. . . . . . . . . .
. . . . . . . . . .
. . . . . . . . . .
. . . . .
. . . . .
. . . . .
. . . . .
. . . . .
. . . . .
6 6 7 8
10 10 11 11 12 13 14 16 16
18 18 19 19 19 20 20 21 24 25 27
28 28 29 30 30 31
CONTENTS
3
3.6 Direct Mapping into Hilbert Space . . . . . . . . . . . . . . . . . 32
4 Optimizer
4.1 A Class of QP-Problems . . . . . . . . . 4.2 An Equivalent Formulation . . . . . . . . 4.3 Classical Optimizers . . . . . . . . . . . 4.3.1 Projected Gradient Descent . . . 4.3.2 Conjugate Gradient Descent . . . 4.4 Interior Point Methods . . . . . . . . . . 4.4.1 Primal Problem . . . . . . . . . . 4.4.2 Dual Problem . . . . . . . . . . . 4.4.3 Central Path . . . . . . . . . . . 4.4.4 Predictor / Corrector . . . . . . . 4.4.5 Modi ed Levinson Decomposition 4.4.6 Computing � and other updates .
5 Experiments
5.1 Approximation . . . . . . . . . . . . 5.1.1 Number of Support Vectors . 5.2 Regression / Estimation . . . . . . . 5.2.1 Number of Support Vectors . 5.2.2 Optimal Choice of Parameters 5.2.3 Asymptotic E�ciency . . . . 5.3 Future Perspectives . . . . . . . . . .
6 Summary A Implementation
A.1 Choice of a programming language A.2 Class Libraries . . . . . . . . . . . A.2.1 Linear Algebra Package . . A.2.2 Data Visualization . . . . . A.2.3 Optimization . . . . . . . .
B MPS Format
B.1 The Problem . . B.2 The File . . . . . B.2.1 Keywords B.2.2 Listing . .
. . . .
. . . .
. . . .
. . . .
. . . .
. . . .
. . . .
. . . .
. . . .
. . . .
. . . . . . . . .
. . . . . . .
. . . . . . . . .
. . . . . . .
. . . . . . . . .
. . . . . . . . . .
. . . . . . . . . . . ..
. . . . . . .
. . . . . . . . .
. . . . . . .
. . . . . . . . .
. . . . . . . . . . . . . . . . . . .
. . . . . . . . .
. . . . . . . . . . . . . . . . . . .
. . . . . . . . .
. . . . . . . . . . . . . . . . . . .
. . . . . . . . .
. . . . . . . . . . . . . . . . . . .
. . . . . . . . .
. . . . . . . . . . . . . . . . . . .
. . . . . . . . .
. . . . . . . . . . . . . . . . . . .
. . . . . . . . .
. . . . . . . . . . . . . . . . . . .
. . . . . . . . .
. . . . . . . . . . . . . . . . . . .
. . . . . . . . .
. . . . . . . . . . . . . . . . . . .
. . . . . . . . .
. . . . . . . . . . . . . . . . . . .
. . . . . . . . .
. . . . . . . . . . . . . . . . . . .
. . . . . . . . .
. . . . . . . . . . . . . . . . . . .
. . . . . . . . .
37 37 38 39 39 40 40 41 41 42 42 44 46
48 48 51 51 53 54 59 61
65 66 66 67 67 68 69
71 71 71 72 72
List of Figures 1.1 2.1 2.2 2.3 2.4 3.1 3.2 4.1 5.1 5.2 5.3 5.4 5.5 5.6 5.7
sample data and corresponding attest t . . . . . . . . . . . . . L2 loss function and corresponding density . . . . . . . . . . . . . L1 loss function and corresponding density . . . . . . . . . . . . . Huber loss function and corresponding density . . . . . . . . . . . �-insensitive loss function and corresponding density . . . . . . . . B-Splines of degree 0 up to 5 . . . . . . . . . . . . . . . . . . . . . Autocorrelation Function for an audio signal: \Fischers Fritz scht frische Fische" . . . . . . . . . . . . . . . . . . . . . . . . . . . . . Boundary Constraints on � and . . . . . . . . . . . . . . . . . . sinc x, datapoints with �-precision and approximations with 0:1, 0:2, 0:5 and 1:0 precision using a spline kernel of degree 3 . . . . . sinc jjxjj measured at 100 iid locations with a spline approximation of degree 1 and precision 0.1 . . . . . . . . . . . . . . . . . . . . . forces (red) exerted by the �-tube (green) on the approximation (blue) . . . . . . . . . . . . . . . . . . . . . . . . . . . . . . . . . approximation with 1.0, 0.5, 0.2, 0.1, 0.05 and 0.02 precision precision using a B-spline kernel of degree 3, the solid dots are support vectors . . . . . . . . . . . . . . . . . . . . . . . . . . . . . . . . . Number of Support Vectors vs. precision of the approximation (spline approximation of degree 1 with 100 nodes) for 100 datapoints (note that the maximum number of points is 100) . . . . . regression / estimation of 0:9 sinc (10x) on [0; 1]2 for 100 samples with gaussian noise of standard deviation 0.1, 0.2, 0.5 and 1.0 and the corresponding �-insensitive loss-zone of width 0.1, 0.2, 0.5 and 1.0 (black dots are support vectors) . . . . . . . . . . . . . . . . . Number of Support Vectors depending on the �-margin for xed noise level and probability of a point to lie outside the margin for an unbiased estimator and noise level � = 0:2 . . . . . . . . . . .
4
14 20 21 22 23 35 36 39 49 50 51 52 53 54 55
LIST OF FIGURES 5.8 Number of Support Vectors for di�erent noise levels and xed �margin of 0:2 (splines of degree 1, 100 points, 100 nodes, gaussian noise, 25 trials) and probability of a point to lie outside the margin for an unbiased estimator . . . . . . . . . . . . . . . . . . . . . . . 5.9 Number of Support Vectors depending on the regularization and the �-margin (splines of degree 1, 100 points, 100 nodes, gaussian noise with standard deviation 0.1, 26 trials) . . . . . . . . . . . . 5.10 �-insensitive cost function depending on the regularization and the �-margin (splines of degree 1, 100 points, 100 nodes, gaussian noise with standard deviation 0.1, 26 trials) . . . . . . . . . . . . . . . . 5.11 L1-error of the approximation depending on the regularization and the �-margin (splines of degree 1, 100 points, 100 nodes, gaussian noise with standard deviation 0.1, 26 trials) . . . . . . . . . . . . 5.12 minimal L1 -error (optimal choice of the regularization) depending on the �-margin (splines of degree 1, 100 points, 100 nodes, gaussian noise with standard deviation 0.1, 26 trials) . . . . . . . 5.13 L2-error of the approximation depending on the regularization and the �-margin (splines of degree 1, 100 points, 100 nodes, gaussian noise with standard deviation 0.1, 26 trials) . . . . . . . . . . . . 5.14 minimal L2 -error (optimal choice of the regularization) depending on the �-margin (splines of degree 1, 100 points, 100 nodes, gaussian noise with standard deviation 0.1, 26 trials) . . . . . . . 5.15 Asymptotic e�ciency for an �-insensitive model and data with gaussian noise. See equation (5.13). . . . . . . . . . . . . . . . . . 5.16 L1, L2 and �-insensitive loss functions in comparison. One can see that the �-insensitive approximates the L2 function better than the L1 does (piecewise linear t with one more parameter). . . . . . . 5.17 L1 and L2 -error of the approximation for di�erent noise levels and xed �-margin of 0:2 (splines of degree 1, 100 points, 100 nodes, gaussian noise, 25 trials) . . . . . . . . . . . . . . . . . . . . . . . 5.18 L1-error for di�erent noise levels . . . . . . . . . . . . . . . . . . . 5.19 L2-error for di�erent noise levels . . . . . . . . . . . . . . . . . . . 5.20 Optimal choice of � for di�erent noise levels (100 samples) and theoretically best value for the asymptotic unbiased case . . . . . A.1 Structure of a matrix / vector object . . . . . . . . . . . . . . . . A.2 main control window . . . . . . . . . . . . . . . . . . . . . . . . . A.3 a typical session for 1D-regression . . . . . . . . . . . . . . . . . .
5
55 56 56 57 57 58 58 60 61 62 62 63 63 67 68 69
Chapter 0 A Roadmap The purpose of this text is threefold: First it should be a documentation of the research done at Bell Laboratories, Holmdel. Secondly it should serve as an introduction to Support Vector Regression-Estimation and nally it is written in order to obtain the degree of a \Diplomingenieur der Physik" at the Technische Universitat Munchen. Of course these goals may sometimes not be consistent. Hence the reader may skip some chapters and focus on other ones to get the information he needs. I tried to make the chapters as self contained as possible without repeating tedious details.
0.1 How to read this Thesis Chapter 1 contains a short overview over some basic regression techniques and explains the fundamental ideas of linear Support Vector function approximation including basic knowledge about convex programming necessary for solving the optimization equations involved. The reader may skip the parts not directly concerning Support Vectors as these are just for giving a motivation for the setting of the problem. In chapter 2 I will show how Support Vector Machines can be extended to the case of Regression/Estimation with noisy data. A set of di�erent loss functions and their implications on the robustness of the estimation will be presented with an explicit derivation of the corresponding optimization functionals. For a brief overview it may su�ce to read the section about �-insensitive loss functions only. The next chapter describes a way of porting the ideas on Linear Support Vector Regression to nonlinear models. The approach is similar to nonlinear Support Vector pattern recognition following the concept of [ABR64] and [BGV92] of mapping to a highdimensional space where linear calculations are performed. For a reader already familiar with this concept and for a quick review of the methods employed the sections 3.4 and 3.5 may be enough. A general method of constructing nonlinear regression systems is given in 3.6. 6
CHAPTER 0. A ROADMAP
7
Chapter 4 describes the more implementation speci c solutions of the support vector system. Basically any quadratic programming algorithm could be used for solving the problem although di�erent methods may show varying performance due to the setting of the problem. An exemplary solution is shown for interior point methods following the ideas of [Van94]. Furthermore this chapter contains a method for e�ciently solving Toeplitz-like systems by a modi ed Levinson method. Experimental results on the performance of Support Vector Regression are given in chapter 5. Further information may be obtained from [VGS96] and [DBK+96]. Finally appendix A concludes this work by describing some of the implementation issues of Support Vector learning machines. This may be relevant for somebody trying to model a similar system only. Hence most of the readers will want to skip it. Appendix B contains a brief de nition of the industry standard MPS le format.
0.2 A Short Review of Approximation and Regression Estimation The simplest way of approximating a function (and the crudest one, too) would be to approximate it by its mean in the domain of interest. A more sophisticated approach would be to choose linear functions or more complicated bases of functions to achieve this goal. Increasing the complexity of the base seems to be the solution to obtain better results. But this is not really true as one will encounter the well known e�ect of 'over{ tting', which means that the complexity of the system of functions used is too high. Since Schoenberg's pioneering paper [Sch46] on spline approximation consisting of l-times di�erentiable piecewise polynomial functions combined with a set of smoothness (and regularity) constraints have been investigated in great detail [PTVF92], [SB93]. This approach has proven to be e�ective in the case of lowdimensional functions only as the number of coe�cients increases exponentionally with dimensionality thereby virtually imposing a limit of four dimensions in real world applications. Decompositions into orthogonal systems [Tim60], [Wal94] like Legendre{, Laguerre{, Chebyche�{, Hermite{, Haar{bases and the family of Fourier Transforms, Windowed Fourier Transforms, Wavelets with tight frames or orthogonal systems [Dau92] were investigated in order to achieve e�cient ways for true and/or fast function approximation and data compression. All of the approaches described above (except approximation by nonseparable wavelet bases) share the problem of exponentional increase in the number of coe�cients with the dimensionality of the problem. A solution was the way to nonseparable expansions, e.g. ANOVA{decompositions [SHKT95], Neural Net-
CHAPTER 0. A ROADMAP
8
works and other methods like CART [BFOS84], MARS [Fri91] . . . These methods stem from regression estimation and allow tractable solutions of high dimensional problems. This brings us to the crucial question: Why do we need another method for function approximation or regression if there's already such a large variety of concepts available that should suit everyone's need?
0.3 The Reason for Support Vectors The reason is that all of these methods have some shortcomings which we tried to overcome in this approach. Neural Networks which are probably the most popular way of doing high dimensional regression estimation have two drawbacks. Their architecture has to be determined a priori or modi ed while training by some heuristic which results in a non necessarily optimal structure of the network and can become a di�cult combinatorial problem for multilayer networks. Still they are universal approximators [Cyb88], [Mur96b]. Secondly ways of regularization (besides the selection of the architecture) are rather limited. They consist of early stopping [DH74], training with noise [Bis95b], weight decay [SL92a] and similar methods. Unfortunately Neural Networks can get stuck in local minima while training. For some methods of training (early stopping) it is not even desired for the network to obtain its minimum. Hence a part of the capacity of the network is (sometimes deliberately) wasted in order to obtain better generalization performance. Howewer this gives only a very indirect way of controlling the capacity of the system and is far from being optimal. Only for the asymptotic case (which in reality rarely occurs, still there are some results hinting that speech recognition might be such a case) [MYA94], [Aka74] and for the case of known prior probabilities (which is not a realistic assumtion) optimal selection criteria have been obtained. Only recently good bounds on the complexity of Neural Networks have been computed by McIntyre and Karpinski [KM95] and Hole [Hol96]. Still the problem of e�ectively controlling the capacity after having selected the architecture remains. Moreover after training it is rather hard to nd a meaningful interpretation of the weights. CART conversely uses a purity functional for pruning instead of more directly motivated regularization techniques. It also neglects the loss function speci c to the problem to be solved. Moreover it is quite restrictive in terms of the admissible models. Instead it would be desirable to have a great liberty in choosing the type of functions one would like to approximate the data with and thereby adding prior knowledge to the way the approximation is constructed. But instead of giving a de nition by exclusion the advantages of Support Vector Regression Estimation can be summed up easily. The architecture of the system doesn't have to be determined before training. Input data of any arbitrary dimensionality can be treated with only linear cost in the number of
CHAPTER 0. A ROADMAP
9
input dimensions. A unique solution is found after training as solution of a quadratic programing problem. The modeling functions may be chosen among a great variety having to satisfy only some condition from Hilbert-Schmidt theory. Capacity can be controlled e�ectively through the regularization functional used (some more research will have to be done on this point) by the same method that was applied to Support Vector Pattern Recognition [GBV93].
Chapter 1 Introduction Before any calculus is done one should consider the basic problem we are dealing with in its fundamental setting: to approximate a function from given data and/or to estimate a function from given data. There is an important di�erence between these two problems. In the rst case we know that our data is correct, viz. our measurements were taken without noise and we would like to obtain a function that assumes the same values (up to a given precision) as our measurements did. Hence this is a setting closely related to the standard interpolation problems. Conversely in the problem of function estimation we can not trust our data completely as it may have been generated with some additional noise. In most of the cases we do not even know the noise model but only have some clues what it might be alike. Still both of these two problems can be treated with just one formalism, the distinction between them being the choice of an appropriate cost function (cf. chapter 2).
1.1 The Regression Problem Suppose we are given a set of observations generated from an unknown probability distribution P (~x; y)1
X = f(~x1 ; y1); (~x2 ; y2); : : : (~xl ; yl)g with ~xi 2 R n; yi 2 R
(1.1)
and a class of functions
F = ff jf : R n 7?! R g (1.2) then the basic problem is to nd a function f 2 F that minimizes a risk functional R[f ] = 1
Z
l(y ? f (~x);~x) dP (~x; y)
Sometimes the sampling points are xed and ( ) is known, too, e.g. audio data. P x
10
(1.3)
CHAPTER 1. INTRODUCTION
11
l is a loss function, i.e. it indicates how di�erences between y and f (~x) should be penalized. A common choice is l(�;~x)�= j�jp for some positive number p (for �=0 interpolation one could require l(�;~x) = 10 for for � 6= 0 . As P (~x; y) is unknown one cannot evaluate R[f ] directly but only compute the empirical risk Xl 1 (1.4) Remp = l l(yi ? f (~xi);~xi) i=1
and try to bound the risk R by Remp + Rgen where Rgen is an upper bound of the generalization error [Vap79] depending on the class of functions used to approximate the data given.
1.2 A Special Class of Functions A simple choice of F is
F = spanf�1(~x); �2(~x); : : : �n(~x)g with �j (~x) : R n 7?! R
(1.5)
Here F is the space spanned by the linear combination of a set of functions. For simplicity we will assume that these are linearly independent hence constitute a base of F . Then the basic regression problem consists of nding a set of scalars
A = f�1; �2; : : : �ng with f (~x) =
n X j =1
�j �j (~x)
(1.6)
such that R[f ] = R[�~ ] is minimized.
1.2.1 Least Mean Square Fitting
As described above R[f ] is unknown. A very naive approach would be to minimize Remp only with l(�) = �2 or in other words to minimize the L2 {norm2. Denote �ij = �j (~xi) (1.7) and ~y = (y ; y ; : : : y )
P �P
then
1 2
l
Remp = li=1 nj=1 �j (~xi)�j ? yi = k��~ ? ~yk22
denotes the {norm, hence jjxjj = ( ?R � p1 for 2 j ( )j 2 jj:jj
x
~
p
p
p
dx
Lp
p
Pn
i=1
1
jxi jp ) p
�2
for x ~
(1.8) 2
R n and jj (x)jjp =
CHAPTER 1. INTRODUCTION
12
min with The minimum of the quadratic function Remp is obtained for �~ LMS min ? �t ~y = 0 �t � �~ LMS (1.9) min () �~ LMS = (�t �)?1 �t~y In the eigensystem of �t �, f�i;~ai g we get P min �~ LMS = Pi ki~ai (1.10) min = t =) �t � �~ LMS i �i ki~ai = � ~y This method does not contain any means of capacity control (besides choosing a smaller set of functions) which makes it very sensitive to over tting and noisy data. Epecially for the case of l < n when we have more functions at hand than measurements the problem is ill posed as rank (�t �) � l. Therefore (�t �)?1 is not well de ned in this case. One may add a term of the form k�~ k22 or use a Singular Value Decomposition. This constitutes a regularizer in the sense of Arsenin and Tikhonow [TA77] and brings us to the case of Ridge Regression.
1.2.2 Ridge Regression
(1.11) Rridge = Remp + k�~ k22 For the case of the Least Mean Square Fit (l(�) = �2) this yields Rridge = k��~ ? ~yk22 + k�~ k22 (1.12) = �~ t (�t � + 1) �~ ? 2~yt��~ + ~yt~y min in the eigenmin and express them in terms of � ~ LMS As in (1.8) we solve for �~ ridge system of �t �, (�i;~ai). So we get X �i min = ki~ai (1.13) �~ ridge � +
i i
Proof:
For the minimum we need @Rridge @~�
ridge into Substituting �~ min @Rridge @~�
P The term
�i i �i +
= 2 (�t � + 1) �~ ? 2�t~y = 0
@Rridge @~�
we get
P�
�
(1.14)
� �
= 2 i (�i + ) ki �i�+i ~ai ? 2�t~y P = 2 ( i (�iki~ai) ? �t~y) = 0
(1.15)
2
is often called the e�ective number of free parameters (cfr. [Bis95a]) and used for a Bayesian regularization argument.
CHAPTER 1. INTRODUCTION
13
1.3 The �-Precision Approximation Problem: Linear Support Vector Regression Now let us consider a very simple cost function 8 1 if � < ?� < l(�)� = : 0 otherwise 1 if � > �
(1.16)
This cost function stems from Support Vector Pattern Recognition [BGV92], [CV95] where a similar function lSV PR(�;~x) had been used � 0 if � > 1 lSV PR (�;~x) = 1 otherwise : (1.17) In this case � is the output of a binary classi er (for a positive sample - the signs change accordingly for negative samples). The modi cation for regression estimation lies in the fact that we get an upper and a lower constraint on the output of the system. Secondly let us consider a simple class of functions F namely the set of linear functions. F = ff j f (~x) = (~!;~x) + b; ~! 2 R ng (1.18) We would like to nd the function with the smallest steepness among the functions that minimize the empirical risk functional. (1.19) RSV = Remp + k~!k22 The functional RSV minimizes the empirical risk functional for (1.16) indeed as Remp only may assume the values 0 and 1. So e�ectively its solution is the
attest linear function for which Remp = 0. In general nding the \ attest" linear function corresponds to minimizing k~!kp with some suitable p 2 R +. For p = 2 this optimization problem becomes a quadratic one which is much more tractable with standard optimization techniques. Also from the equivalence of all norms in R n follows that an optimal solution for p0 will be a good solution for p~ as well. Hence for the rest of this text we will assume p = 2. In the case of a loss function of type (1.16) the functional (1.19) gives the following quadratic optimization problem. minimize L(~!; b) = 21 k~!k22 subject to " ? (f (~xi) ? yi) � 0 8 i 2 [1::l] " ? (yi ? f (~xi)) � 0 where f (~x) = ~!t~x + b
(1.20)
CHAPTER 1. INTRODUCTION
14
5 "f(x)" "data"
4
3
2
1
0 0
1
2
3
4
5
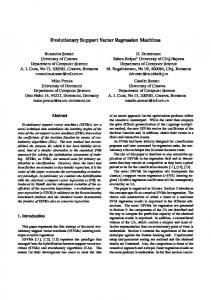
Figure 1.1: sample data and corresponding attest t
Example 1 (Hard Margin Approximation) Figure 1.1 shows an approxi-
mation of some datapoints with xed precision (indicated by the errorbars). Among the admissible functions that would satisfy these constraints the attest one is selected. In order to solve (1.20) we need some basic knowledge from optimization theory which will be presented here without great detail. For the reader who is interested in getting a greater insight into these problems any book on operations research and mathematical programming will suit his needs, e.g. [Fle89].
1.4 The Lagrange Function and Wolfe's Dual The basic setting of convex programming is the following problem.
Optimization Problem:
minimize f (~x) subject to ci (~x) � 0 for i 2 [1::mineq ] (1.21) subject to ci (~x) = 0 for i 2 [mineq + 1::m] Both f (~x) and ci(~x) are required to be convex functions. Hence the constraints ci(~x) de ne a convex domain, the primal feasible region. It can be shown that the system (1.21) has a unique solution if f is strictly convex and the equality
CHAPTER 1. INTRODUCTION
15
constraints are linear (or in other words both the equality constraints ci(~x) and ?ci (~x) are convex for in 2 [mineq + 1::m]).
Proof:
By contradiction: Suppose we have two points ~x1 and ~x2 being an optimal solution, then obviously f (�~x1 + (1 ? �)~x2) < �(f (~x1) + (1 ? �)f (~x2) (1.22) but by the convexity of the feasible region �~x1 + (1 ? �)~x2 is feasible, too, hence ~x1 and ~x2 can't be optimal. 2 Analogously to the well known methods in classical mechanics (cfr. [Gol86]) we de ne the Lagrange function
L(~x; �1; : : : �m) = f (~x) ?
m X i=1
ci (~x)�i
(1.23)
where �i are the so called Lagrange multipliers, also called dual variables. The feasible region for �i is R +0 for i 2 [0::mineq ] and R for i 2 [mineq + 1::m] Now we want to obtain the dual problem (Wolfe's Dual) from L namely the optimization problem in the dual variables ~� which results to be a maximization problem. Notemthat i� L(~x; ~�) has a saddle{point (~x0 ; ~�0) in the admissible domain n R R +0 ineq R m?mineq then this point is the global optimum of 1.21. A saddle{ point is characterized by L(~x; ~�0) � L(~x0; ~�0) � L(~x0 ; ~�) (1.24) for all ~x and ~�. Hence in order to compute (~x0 ; ~�0) we will solve L for ~x. @L(~x; ~�) = 0 (1.25) @~x This yields the corresponding dual problem in ~�: g(~�) := L(~x(~�); ~�) (1.26) maximize g(~�) (1.27) subject to �i � 0 for i 2 [1::mineq ] �i 2 R for i 2 [mineq + 1::m] The saddle{point conditions also can be written as follows f (~x) = g(~�) (1.28) and (~x; ~�) feasible We will use this equality in chapter 4 for determining the duality gap between the primal and dual set of variables in order to measure the convergence of an interior point algorithm.
CHAPTER 1. INTRODUCTION
16
1.5 Karush-Kuhn-Tucker theorem From (1.24) it can be seen that �ici(~x) = 0 8 i 2 [1::m] (1.29) In other words this means that only active constraints may result in Lagrange multipliers not equal to zero which is a well known fact from classical mechanics. There the multipliers represent the virtual forces resulting from the constraints of the problem. This is of great importance for the solution of the Support Vector problem as it allows a signi cant simpli cation of the regression - only the datapoints with nonvanishing Lagrange multipliers have to be taken into account.
1.6 The Dual Support Vector Problem Solving (1.20) with the methods described above we get (for the future we will use �~ , �~ � instead of ~� in order to be consistent with the existing literature on Support Vectors) L(~!; b; �~ ; �~ �) = RSVP(~!; b) ? Pli=1 �i(" ? (yi ? f (~xi)) (1.30) l � ? i=1 �i (" ? (f (~xi) ? yi))): Now we compute the partial derivatives of L wrt. the primal variables l Xl � @L = ~! ? X �i~xi + �i ~xi (1.31) @~! i=1 i=1 = 0 =)
(�i ? �i�) ~xi
(1.32)
l @L = ? X (�i ? �i�) @b i=1
(1.33)
~! =
=)
Xl
0 =
i=1
Xl i=1
(�i ? �i�)
(1.34)
substituting (1.32) and (1.34) back into (1.30) yields: Xl 1 � (� ? �� )(� ? ��)(~x ;~x ) maximize g(�~ ; �~ ) = ? 2 i;j=1 i i j j i j + with
Xl i=1
(�i + �i�)yi
�~ ; �~ � 2 R n
(1.35)
CHAPTER 1. INTRODUCTION
17
Unfortunately this model breaks down when we encounter a non-realizable case (or data with noise) as the primal feasible region becomes zero. This means that there would be no function that could approximate the given data with �{ precision. For instance consider the pathological case of ~xi = ~x^i and jyi ? y^ij > 2�. Additionally it does not provide any means for capacity control. A way to cope with both issues is to modify the loss function l(�). This will be done in the next chapter.
Chapter 2 Loss Functions For the case of data with noise we will have to consider replacing the loss function (1.16) with another one that doesn't have singularities. Moreover it is required to be convex in order not to spoil the convexity of the optimization problem which guarantees the uniqueness of the solution. Another point to consider is that the goals we would like to achieve are twofold: either we have to minimize a cost function which is given by the problem itself. This can be the tolerance allowed for a device to be manufactured, the penalty for an incorrect prediction or whatever else. On the other hand we have the system generating the data we're dealing with. The output is subject to noise generated wrt. an internal noise model (e.g. roundo� errors, gaussian noise ...). In this case we can use the corresponding cost function for getting low bias and variance.
2.1 Maximum Likelihood Estimators We will show the connection between a ML-estimator and the cost-function as discussed in many statistics textbooks (cfr. [Vap79]). Assuming that the data has been generated according to the following model
P (~x; y) = P (yj~x)P (~x) = P (y ? f (~x))P (~x)
(2.1)
we can write the likelihood of the estimation as follows
P (~x1; y1; : : :~xl ; yl) = writing
Yl i=1
P (yi ? f (~xi))P (~xi)
P (y ? f (~x)) = e?l(y ? f (~x)) 18
(2.2) (2.3)
CHAPTER 2. LOSS FUNCTIONS
19
for some function l(�) we arrive at
P (~x1; y1; : : :~xl ; yl ) = e
?
Xl i=1
l(yi ? f (~xi)) Y l i=1
P (~xi)
(2.4)
hence maximizing the likelihood P (~x1; y1; : : :~xl ; yl) results in minimizing
RML =
Xl i=1
l(yi ? f (~xi))
(2.5)
Minimizing RML does not necessarily minimize the cost we have to pay due to external constraints on the system, e.g. we may be able to tolerate a deviation by � without extra cost and pay only linear cost for further excess although the data we're dealing with may be normally distributed. Or in an even more extreme case the penalty for predictions may be asymmetric (l(�) 6= l(?�)). In this case choosing an unbiased estimator is de nitely a bad choice as we are not supposed to estimate a function but to minimize a risk functional.
2.2 Common Density Models We will discuss four common density models and calculate the appropriate Support Vector Regression for them. Note that these models stem from the estimation of a location parameter context. Howewer the distribution of errors for function estimation also depends on the function and the estimator used. Therefore the distribution of errors may di�er from the distribution of the noise. The loss functions presented are robust in the corresponding class of densities [Vap79].
2.2.1 Gauss
Probably the most popular density model is the one of Gaussian noise (see Figure 2.1), i.e. l(�) = �2 =) P (�) / e?� (2.6) 2
2.2.2 Laplace
For systems with normal distributed variance of the data we get Laplacian noise (see Figure 2.2): l(�) = j�j =) P (�) / e?j�j (2.7)
CHAPTER 2. LOSS FUNCTIONS
20
3 loss function density 2.5
2
1.5
1
0.5
0 -3
-2
-1
0
1
2
3
Figure 2.1: L2 loss function and corresponding density
2.2.3 Huber
A robust estimator in the class of mixtures between a given Gaussian density and an arbitrary density symmetric w.r.t. the origin is given by the Huber loss function [Hub72], (see Figure 2.3)
8 ?� ? 0:5 < 1 2 l(�)� = : 2� � ? 0:5
for � < ?� for ?� � � � � for � > �
2.2.4 �-insensitive Loss Function
(2.8)
The loss function shown here will result in a biased estimator (unlike the ones before) when combined with a regularization term. In the realizable case it will behave like the loss function discussed in chapter 1.3, which results in an estimator like in Figure 1.1. But it has the advantage that we will not need all the input patterns for describing the regression vector ~! thereby providing a computationally more e�cient way of computing the regression afterwards (see Figure 2.4).
CHAPTER 2. LOSS FUNCTIONS
21
3 loss function density 2.5
2
1.5
1
0.5
0 -3
-2
-1
0
1
2
3
Figure 2.2: L1 loss function and corresponding density
8 ?� ? � < l(�)� = : 0 �?�
for � < ?� for ?� � � � � for � > �
(2.9)
2.3 Solving the Optimization Equations We will modify equation 1.20 in a very general way to cope with indivitual loss functions li(�) for each sample (~xi; yi). This can be useful for data that has been obtained by di�erent methods or measurements that have been speci ed with relative precision. Our general model of a loss function l(�) will cover functions that are zero on [0; �] and convex continuous di�erentiable functions for (�; 1) (note: we do not require di�erentiability at �). For the sake of simplicity of notation we will use l(� + �) = � (�) in the following.
CHAPTER 2. LOSS FUNCTIONS
22
3 loss function density 2.5
2
1.5
1
0.5
0 -3
-2
-1
0
1
2
3
Figure 2.3: Huber loss function and corresponding density minimize R(~!; b; ~�; ~��) = 21 k~!k22 + C
f (~xi) ? yi subject to yi ? f�(;~x�i�) i i where
� � � f (~x)
Pl (� (� ) + � (��)) i i i=1 i i
� i + �i �i� + ��i 8 i 2 [1::l] 0 = ~!t~x + b
(2.10)
As in section 1.4 we can compute the Lagrange function L (with dual variables �~ , �~ � corresponding to the constraints on f (~xi) ? yi and ~ , ~ � corresponding to the ones on ~�, ~��. This will allow an e�cient solution of the problem in the dual set of variables, especially when solving the problem in the primal set of variables will become quite intractable due to further generalizations (cfr. chapter 3).
P
L(~!; b; �~ ; �~ �; ~�; ~��;~ ;~ �) = 21 k~!Pk22 + C li=1 (�i(�i) + �i(�i�)) ? Pli=1 �i(�i + �i + yi ? f (~xi)) ? Pli=1 �i�(�i� + ��i ? yi + f (~xi)) ? li=1 �i i + �i� i�
(2.11)
CHAPTER 2. LOSS FUNCTIONS
23
3 "loss function" density 2.5
2
1.5
1
0.5
0 -3
-2
-1
0
1
2
3
Figure 2.4: �-insensitive loss function and corresponding density computing the partial derivatives of L
l Xl � @L = ~! ? X ~ � x + �i ~xi i i @~! i=1 i=1 = 0
=)
=)
Xl
(2.12)
(�i ? �i�) ~xi
(2.13)
l @L = ? X � ( � i ? �i ) @b i=1
(2.14)
~! =
0 =
i=1
Xl i=1
(�i ? �i�)
@L = C d � (� ) ? � ? i i @�i d�i i i @L = C d � (��) ? �� ? � i i @�i� d�i� i i
(2.15) (2.16) (2.17)
CHAPTER 2. LOSS FUNCTIONS
24
and substituting the partial derivatives back into (2.11) yields
W (�~ ; �~ �; ~�; ~��)
Xl 1 (�i ? �i�)(�j ? �j�)(~xi ;~xj ) = ? 2 i;j=1 +
Xl i=1
+C
(�� ? � )y i
Xl � i=1
i i?
Xl i=1
(�i�i + �i���i )
� (� ) + � (��) ? � i i
i i
(2.18)
d � d � i �i (�i ) ? �i � �i (�i ) d�i d�i
�
Our aim is to simplify the part depending on �i(�)(�i(�) ) and to substitute back the corresponding choices. Without loss of generality (but helping to get rid of a lot of tedious calculus) we will only consider the terms d � (�) T (�) = � (�) ? � d� (2.19) and d � (�) = � + C d� (2.20) with
�; �; � 0:
(2.21)
2.3.1 Polynomial Loss Functions
Let us assume the general case of functions with �-insensitive loss zone (which may vanish) and polynomial loss of degree p > 1. This contains all Lp loss functions as a special case (� = 0). The case of p = 1 will be treated in the following section. � (�) = p1 �p with p > 1 (2.22) � 1� 1 p p ? 1 (2.23) =) T (�) = � ? �� = ? 1 ? �p p p C�p?1 = � +� � (2.24) p p =) T (�; ) = ? 1 ? p1 C ? p? (� + ) p? (2.25) 1
1
We want to nd the maximum of L in terms of the dual variables. Hence we obtain = 0 as T is the only term where appears and T is maximal for that value. This yields � 1� p p T (�) = ? 1 ? p C ? p? � p? with � 2 R +0 (2.26) 1
1
CHAPTER 2. LOSS FUNCTIONS
25
Moreover from � we can infer how large the deviation is:
� = C ? p? � p? 1
1
1
(2.27)
1
Now for the special case of a L2 loss function:
Example 2 (� = 0, p = 2) maximize W (�~ ; �~ � ) = ?
+ subject to
l 1X (� ? ��)(� ? ��)(~x ;~x ) 2 i;j=1 i i j j i j
Xl i=1
Xl i=1
(�� ? � )y i
i
(2.28)
Xl 2 �2 1 (� + �i ) i? 2C i=1 i
(�i ? �i�) = 0
(2.29)
�i; �i� 2 [0; 1) Of course one could have obtained the solution more easily as solution of an unconstrained optimization problem which also would be computationally more e�cient. The problem couldPbe greatly simpli ed by combining � and �� into = � ? �� with 2 R and li=1 i = 0.
2.3.2 Piecewise Polynomial and Linear Loss Function
We will use a loss function � (�) that has polynomial growth for [0; �], a linear one for (�; 1) and is C 1 (one time di�erentiable) and convex. A consequence of the linear growth for large � is that the range of the Lagrange multipliers becomes bounded, namely by the derivative of � . Therefore we will have to solve box constrained optimization problems.
� (�) = =) T (�) =
�+ =
( �1?p 1 �p �p 1 � for � < � � + ? 1 � for � � � 8 1?pp � 1 � p < ?� 1 ? p � for � < � : ?� �1 ? p1 � for � � � � C �1?p �p?1 for � < � C
for � � �
(2.30) (2.31) (2.32)
By the same reasoning as above we nd that the optimal solution is obtained for
= 0. Furthermore we can see by the convexity of � (�) that � < � i� � < C .
CHAPTER 2. LOSS FUNCTIONS
26
Hence we may easily substitute � for C in the case of � > �. � 2 [0; C ] is always true as � 0. � 1� p ? p ? 1 ? p � � p? for all � 2 R +0 (2.33) =) T (�) = ?C Analogously (if � 2 [0; C ) we can determine the error by (2.34) � = � C ? p? � p? Example 3 (�-insensitive Loss Function (� = 0)) For this setting T (�) vanishes independently from p (left aside the case p = 1). This leads to the following optimization problem [Vap95]. Xl 1 � � � ~ maximize W (�~ ; �~ ) = ? (2.35) 2 i;j=1(�i ? �i )(�j ? �j )(xi;~xj ) 1
1
1
1
+
Xl i=1
1
1
1
(�i� ? �i)yi ?
X l
subject to
i=1
Example 4 (L1 Loss Function)
Xl i=1
(�i�i + �i���i )
(�i ? �i�) = 0
(2.36)
�i ; �i� 2 [0; C ]
An even more special case is (� = 0, � = 0) which we get from the equations above by removing the terms in �.
Example 5 (Relative Precision)
Another special case are measurements carried out with relative precision �rel . Here we set �i = ��i = �rel � jyij (2.37) Example 6 (Huber Loss Function (� = 0; p = 2)) T (�) = 21C � �2 (2.38) which results in an optimization problem of the form: Xl 1 � � � maximize W (�~ ; �~ ) = ? ( � (2.39) i ? �i )(�j ? �j )(~xi ;~xj ) 2 i;j=1
+ subject to
Xl i=1
X l
i=1
Xl (�i� ? �i)yi ? 21C (�i2�i + �i�2�i� )
(�i ? �i�) = 0
�i; �i� 2 [0; C ]
i=1
(2.40)
CHAPTER 2. LOSS FUNCTIONS
2.3.3 Local Loss Functions
27
One can see easily that the loss functions described above may be combined into a local loss function. This means that when describing the regression problem one doesn't need to know the loss function over the whole domain (this may be relevant for process control systems, e.g. a vapor deposition device where for some deposition densities the accuracy may be more critical than for other ones). Instead one may de ne it pointwise for each sampling point. As shown there is a rich variety of functions to choose from (constant{linear, quadratic, quadratic{ linear, absolute constraints on the deviation, etc.) which should provide a good approximation of the reality. One also should observe that there is no increase in computational complexity by the mixture of several cost functions, it essentially stays a quadratic programming problem.
Chapter 3 Kernels 3.1 Nonlinear Models The problem the regression models discussed so far is that they are only linear. Instead one would like to nd a general way of representing nonlinear functions in an arbitrary number of dimensions e�ciently in the way described in the previous chapters. This can be achieved by a map � into a highdimensional space and constructing a linear regression function there. The procedure is analogous to what has been done in pattern recognition [BGV92], [ABR64].
Φ n
N
R
R
Example 7 (quadratic features) �:
7 ! R3 p ? (x1 ; x2) 7?! (x21 ; 2x1 x2 ; x22) R2
(3.1)
� is carried out before all other steps of the regression method described so far. The only modi cation due to this procedure is exchanging the dot products (~xi;~xj ) by (�(~xi); �(~xj )). Hence we get p p (~x;~x�) = ((x1 ; x2 ); (x�1; x�2 )) 7?! ((x21; 2x1 x2 ; x22); (x�1 2; 2x�1 x�2 ; x�2 2)) = (~x;~x� )2 This is a symmetric function K in ~x and ~x�. Note that in all the previous calculations ~xi appeared only in the form of dot products. Therefore for all the previous calculations we can easily replace (~x;~x� ) by K (~x;~x�). This gives rise to the question which general class of functions K might be admissible. 28
CHAPTER 3. KERNELS
29
3.2 Mercer's Condition Using Hilbert Schmidt theory this issue can be settled in a de nitive manner [CH53]: A function is called a positive Hilbert-Schmidt kernel i� Mercer's Condition holds: with K (~x;~x�) 2 L2 (R n) L2 (R n) ZZ K (~x;~x�)g(~x)g(~x�)d~xd~x� � 0 (3.2) L2 L2
8g(~x) 2 L2 (R n)
I� (3.2) holds true we can nd an eigensystem of K (�i(~x); �i) with positive eigenvalues �i such that K may be rewritten in the following way:
K (~x;~x� ) = with �i(~x� ) =
X �i�i (~x)�i(~x� ) Zi
(3.3)
K (~x;~x�)�i (~x)d~x
In this context we may regard �i (~xj ) as a (potentially) in nite number features i of the vector ~xj . On the other hand any 'feature extracting'{mapping corresponds to a positive Hilbert-Schmidt kernel (proof by writing (3.2) with the 'feature extractor' as an argument). Note that the Kernel{approach is much more powerful than just running a plain ordinary 'feature extractor' on the data as the dimensionality of the space achieved by the latter approach is only very limited whereas in the case of mapping to high dimensional spaces the implicit dimensionality may be in the order of several millions of features. Analogously as described in section 3.1 we can substitute the dot products by the corresponding values of the kernel. One can easily see that the resulting optimization problem is still convex - this is equivalent to proving that the matrix K (~xi;~xj )(ij) is positive semide nite for any choice of f~xig.
Proof:
= =
Xl i;j =1 l
X
i;j =1
K (~xi ;~xj )�i�j �i�j
X
X Xl k
�k
i=1
k
(3.4)
�k �k (~xi)�k (~xj )
�i�k (~xi)
Xl j =1
�j �k (~xj )
change of the summation order allowed as
Pl
i;j =1
is just a nite sum
CHAPTER 3. KERNELS =
X k
30
�k ��k ��k � 0 since �k � 0 8k
3.3 Some Useful Kernels
� polynomial regression of order p K (~x;~x�) = (1 + (~x;~x� ))p � RBF-kernels jj~x?~x� jj ? � ~ K (x;~x ) = e � � two layer feed forward neural network K (~x;~x�) = tanh(�(~x;~x�) ? �) 2 2
(3.5)
2 2
(3.6) (3.7)
These methods work pretty well for pattern recognition. In regression estimation the number of input dimensions is much lower though (compare approx. 700 pixels of an image for OCR to 3 dimensions for video data). Furthermore one would like to control the type of functions used for approximation / regression directly, e.g. one would like to construct splines. Therefore we need another method for nding a suitable kernel.
3.4 Intermediate Mapping We will use an intermediate map to increase dimensionality just like in the 'preprocessing step' described in section 3.1 (this is done in contrast to Bellman's often cited curse of dimensionality). For the beginning let us suppose n = 1, i.e. we are operating in R 1
ψ n
R
N
R
I
R
Φ
Given a set of functions k : R 7?! R and an admissible Hilbert-Schmidt Kernel Ks on L2 (R m) L2 (R m) we construct the following kernel: K (x; x� ) = Ks(( 1 (x); : : : ; m (x)); ( 1 (x� ); : : : ; m (x� ))) (3.8) By construction this kernel ful ls Mercer's condition as Ks does.
CHAPTER 3. KERNELS
31
Example 8 (Splines of Degree p) Given a set T = ft1 ; : : : tm g with ti < tj for i < j de ne � (x ? t )p for x > t p k k k (x) := (x ? tk )+ = 0 for x � tk
(3.9)
By doing this the ti de ne a one-dimensional grid on which spline interpolation is done. Now set Kx ( : ; : ) = ( : ; : ). This yields
X K (x; x� ) = (x ? t )p (x� ? t )p m
k +
k=1
(3.10)
k +
therefore also the regression f (x) becomes a spline of degree p
f (x) = = =
Xl i=1 l
(�i ? �i�)K (x; xi ) + b
X i=1 m
(�i
X k=1
X ? ��) (x ? t )p (x m
i
(x ? tk )p+
p k + i ? tk )+ + b
(3.12)
(�i ? �i�)(xi ? tk )p+ + b
(3.13)
k=1
Xl i=1
(3.11)
!
Instead of splines we might use any other set of functions. So in a more general fashion we would have to deal with i(x) = (x ? ti ). Choosing such a set of special functions may be convenient when solving operator equations [VGS96]. Here one could use a special such that A^?1 becomes a simple function.
3.5 Tensor Products A shortcoming of this approach is that the number of functions would increase exponentionally with the dimensionality of the input space in order to provide a resolution enough for approximating given data. Remembering that R n = Nn R wegood will use tensor products of suitable kernels for each input dimension: i=1
K (~x;~x� ) =
Yn i=1
Ki(xi; x�i )
(3.14)
This means that we can get an n-dimensional spline expansion at only linear cost instead of an exponentional one in the number of input dimensions. Another way of describing splines would be an ANOVA-decomposition [SHKT95]. The sets Tj = ftj ; : : : tjm g form the grid corresponding to the tensor product kernel. Note that the choice of gridpoints is independent for each dimension. 1
CHAPTER 3. KERNELS
32
Example 9 (Grid in Two Dimensions)
x2 t 26
t 21 t 11
t 15
x1
3.6 Direct Mapping into Hilbert Space Although linear in the number of dimensions the computational cost still may be very high especially for the case of choosing a very ne grid. This problem can be solved by taking the number of gridpoints per dimension to in nity thereby generating an in nitely ne grid and computing the limit analytically which yields an integral over the mapping-function.
Proof:
Q
Let K be normalized by the number of gridpoints ni=1 mi . Setting tik = ti +k ��ti and Ti = ti + ni � �ti we get: mi Yn X 1 � Q K (~x;~x ) = n m (3.15) (xi ? tik ) (x�i ? tik ) i=1 i i=1 k=1 mi Yn X = Qn 1m �t �ti (xi ? ti ? k � �ti) (x�i ? ti ? k � �ti ) i=1 i i i=1 k=1 taking the limit ni ?! 1 with ni �ti = const: yields the de nition of the Riemann{integral:
K (~x;~x� )
Yn Z Ti 1 (xi ? �i ) (x�i ? �i)d� ! Qn T ? t i i=1 ti i=1 i
(3.16)
CHAPTER 3. KERNELS
33
An easier way to derive this result is to use a map into some Hilbert space H
7! H ? ~x 7?! ~x
Rn
=) K (~x;~x� ) = ( ~x;
~x� )
(3.17) (3.18) (3.19)
By construction this kernel satis es Mercer's condition. For simplicity we will assume n = 1 and omit the normalization
Example 10 (Splines) ( : ) = ( : )p+; with t � x � y � T
ZT (x ? � )p+(y ? � )p+ d� Zt x
=) K (x; y) =
(x ? � )p(y ? � )pd� t substituting � := x ? � , � := y ? x yields Z x?t X p � � p � p+j �p?j d� = j 0 j =1
=
p X
1 = j =1 p + j + 1
�p�
p+j +1 (y ? x)p?j j (x ? t)
(3.20) (3.21) (3.22) (3.23) (3.24)
This expression can be evaluated several hundred times faster than summing up the single spline coe�cients1.
Example 11 (B-Splines)
We de ne B-Splines in a recursive manner (� denotes the convolution operation and 1 the indicator function) [UAE91]:
B0 = 1[?0:5;0:5] Bn = Bn?1 � B0 for n � 1 = ni=1B0
(3.25) (3.26) (3.27)
One can easily see that Bn -Splines (for n odd) are symmetrical positive functions in C n?1 with compact support [? n2 ; n2 ] (see gure 3.1). For convenience we will choose the interval [t; T ] su�ciently large such that for all samples xi the translated support of Bn is contained in the integration interval. This is a For sume settings also the sum may be expressed in closed form thereby decreasing computation time. 1
CHAPTER 3. KERNELS
34
reasonable choice as it corresponds to a translation invariant model of function approximation.
K (x; y) =
ZT Bn(x ? � )Bn (y ? � )d� Zt
= Bn(x ? � )Bn (� ? y)d� R = B2n+1(y ? x)
(3.28) (3.29) (3.30)
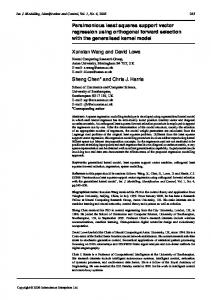
Kernels of the K (x; y) = f (x ? y) type can reduce the algorithmic complexity drastically. See section 4.4.5 how the computational cost can be reduced from O(l3) to O(l2) for equidistant data and a kernel of the form described above. Moreover kernels for which f has bounded support can reduce the computational e�ort even further by rendering the dot product matrix more diagonal. The far o�{diagonal elements vanish. These kernels take into account only local correlations. This can be advantageous in the case of images [UAE91] or any other similar data (e.g. audio). See gure 3.2 for the autocorrelation function of an audio signal. One can observe that the correlation decays with the temporal distance between the measurements. Hence a kernel with support containing the alternating part of the autocorrelation could be used to approximate this kind of data. Still the generalization ability decreases until for the case that supp f is contained in the distance between any two adjoint points the number of nonzero Lagrange multipliers (i.e. Support Vectors) becomes equal to the number of samples (the dot product matrix Kij is diagonal in this case).
CHAPTER 3. KERNELS
35
Order 0
Order 1
Order 2
1
1
1
0.8
0.8
0.8
0.6
0.6
0.6
0.4
0.4
0.4
0.2
0.2
0.2
0
−2
0
2
0
−2
Order 3
0
2
0
Order 4 1
1
0.8
0.8
0.8
0.6
0.6
0.6
0.4
0.4
0.4
0.2
0.2
0.2
−2
0
2
0
−2
0
0
2
Order 5
1
0
−2
2
Figure 3.1: B-Splines of degree 0 up to 5
0
−2
0
2
CHAPTER 3. KERNELS
36
100
80
60
40
20
0
−20
−40 0
0.2
0.4
0.6
0.8
1
1.2
1.4
1.6
1.8
2 4
x 10
Figure 3.2: Autocorrelation Function for an audio signal: \Fischers Fritz scht frische Fische"
Chapter 4 Optimizer In this chapter we will have a closer look at optimization algorithms suitable for solving the problems posed in chapter 2. Two methods are discussed, namely a combined Conjugate Gradient and Projection method by More & Toraldo [MT91] and a special type of Interior Point Primal{Dual Path{Following algorithms in the spirit of Vanderbei [Van94]. It will be shown how for the special case of equidistant data and a restricted class of kernels the complexity of these algorithms can be reduced quite drastically by dealing with a modi ed Levinson algorithm. Therefore it is convenient to de ne a general class of optimization problems which contains the several Support Vector problems as subcases.
4.1 A Class of QP-Problems �
� �
minimize fp(�~ ; �~ �) = ~t; (�~ � ? �~ ) + ~t�; (�~ � + �~ ) + 21 (�~ � ? �~ )tD(�~ � ? �~ ) + 1 (�~ � + �~ )t D�(�~ � + �~ ) 2
�
(4.1)
(~c; (�~ � ? �~ )) = 0 0 � �i; �i� � U 8i 2 f1: :lg where D and D� are positive (semi)de nite matrices, ~t is an arbitrary vector and ~t� contains only non negative entries. The previously (in Chapter 2) described optimization problems with box constraints fall into that class of QP-problems (the other problems can be solved in a quite straightforward manner by simpler methods or by specializing the methods described here and removing the constraints in U which drastically reduces the number of dual variables1). Additionally in subject to
1 coincides with of the chapters above. Still I decided to call the boundary to be consistent with the current implementation. U
C
37
U
in order
CHAPTER 4. OPTIMIZER
38
all the cases described D� only contains diagonal elements. For convenience we will make use of this fact in the following (but the reader should be aware that the corresponding statements also hold for non-diagonal D� ).
4.2 An Equivalent Formulation For practical (and performance) reasons it is not convenient to solve the problem as is. Solving it this way would result in having to deal with a quadratic part of the type: (�~ � ? �~ )t D(�~ � ? �~ ) + (�~ � + �~ )tD� (�~ � + �~ ) � �~ �t � D� + D D� ? D �� �~ � = �~ � �~ � D� ? D D� + D This matrix is highly degenerate | half of its eigenvalues are zero, the other half is twice the eigenvalues of D. Hence we (block) diagonalize this system by switching to: ~ = �~ � ? �~ (4.2) ~ � = �~ � + �~ This improves the condition of the problem as we don't have to rely on automatic pivoting but can perform the critical steps beforehand. The problem transforms to: minimize fp( ~ ; ~ �) = (~t; ~ ) + (~t�; ~ �) + 21 ~ tD ~ + 21 ~ �t D� ~ � (4.3) subject to (~c; ~ ) = 0 0 � ( i� + i); ( i� ? i) � 2U 8i 2 f1: :lg Now we arrived at a sipler functional form at the cost of a more complicated combination of constraints (cf. Figure 4.1) which will be simpli ed now: (4.4) 0 � i� + i and 0 � i� ? i () j ij � i� � � i + i � 2U and i ? i � 2U =) j ij � U (4.5) We will show that choosing i� = j ij is an optimal choice: case 1: Dii� = 0 and t�i = 0 i� does not appear neither in fp nor in the regression itself. Therefore it may take any value and i� = j ij is the best choice as it leaves [?U; U ] as admissible interval for i. case 2: Dii� � 0 or t�i � 0 Here the optimal solution is obtained for the smallest i� possible, j ij.
CHAPTER 4. OPTIMIZER
39 β
α
∗
∗
α
U
U
-U
U
β
Figure 4.1: Boundary Constraints on � and All other cases have been excluded already in the de nition of equation (4.1). So we can simplify the boundary conditions to: (4.6) i 2 [?U; U ] and i� = j ij Note: this formulation is equivalent to �i�i� = 0 which is obvious when looking at the formulation of the initial optimization problem (we can't exceed both the upper and the lower boundary at the same time). This form is being used for interfacing the Support Vector Machine with an external optimizer (cf. Appendix B).
4.3 Classical Optimizers The rst optimizer to be used was a classical constraint based one (viz. an optimizer that is aware of the set of active / inactive boundary conditions) by More & Toraldo [MT91]. It had been successfully deployed for Support Vector Pattern Recognition problems (it is one of the fastest classical optimization currently known). I will give a short overview of the basic ideas. Its main loop consists of two alternating algorithms: projected gradient descent and conjugate gradient descent. Each of these two algorithms is iterated until no su�cient progress is made. Convergence in a nite number of steps can be proven for positive de nite matrices.
4.3.1 Projected Gradient Descent For the problem
mininize ffp(~x)jli � xi � uig
(4.7)
CHAPTER 4. OPTIMIZER
40
we de ne a projected gradient
� @f (~x) � 8 if xi 2 (li; ui) < @ifp(~x) p min(@i fp(~x); 0) if xi = li @xi := : max( @i fp(~x); 0) if xi = ui
(4.8)
in other words: restrict the gradient so that it does not point outside the feasible region. Now perform a line search in this direction until the minimum is found or another constraint is hit. This is guaranteed to lower the value of fp as we are dealing with a quadratic function. The advantage of this method is that more than one constraint may change per iteration thereby allowing a potentially faster convergence. When little progress is made search for the minimum on the face of the hypercube:
4.3.2 Conjugate Gradient Descent
Now we consider the original problem restricted to the set of variables with inactive constraints. There nding the minimum reduces to an unconstrained optimization problem (the projection on the constraints is performed afterwards) which is guaranteed to converge in at most n steps (where n is the dimensionality of the space): Recursively we choose f~p1; ~p2 ; : : :g, f~x1 ;~x2; : : :g and ~gi = grad~xf (~xi+1 ) with ~xi+1 = ~xi + �i~pi (4.9) such that (~pj ;~gi) = 0 j < i (4.10) This means setting ~xi so that the gradient is orthogonal to the previous direction of descent p~ i . One can easily see (after some calculus) that the set of f~p1 ; ~p2; : : :g is linearly independent. Therefore it spans the whole space after n steps and by enforcing orthogonality we get ~gn+1 = 0 which is a solution. In the algorithm described above not all n steps are used: when the relative improvement decreases the system will resume with projected gradient descent. Unfortunately the algorithm was designed to work for for box constrained problems | additional constraints were taken into account by adding a large penalty term for their violation which contributed to additional computational errors. Moreover convergence had been proven for positive de nite matrices only. In the regression estimation case this meant adding a (su�ciently large to ensure rapid convergence) additional diagonal regularization term which drastically deteriorated results. Hence we decided to use an interor point method instead.
4.4 Interior Point Methods Interior Point methods come in three basic avors:
CHAPTER 4. OPTIMIZER
41
barrier methods: Here the constraints are added as a penalty term (e.g. the
logarithm of the constraints) and relaxed on convergence a�ne scaling methods: On approaching the constraints the metric is changed. Thereby one avoids violating them. primal-dual path following methods: The fact that satisfaction of the primal + dual constraints and the KKT-conditions yields the optimal solution is exploited by transforming the optimization problem into one of solving a set of equations. In our further discussion we will only consider the latter but before doing so we will have to reformulate the optimization problem in a way that we only have positivity and linear constraints on the primal set of variables in order to e�ciently obtain the dual problem.
4.4.1 Primal Problem
We will use the setup of equation (4.1) with a small modi cation of the constraints: instead of 0 � �i; �i� � U (4.11) we will introduce a new set of slack variables �i; �i� and write 0 � �i; �i�; �i; �i� and �i(�) + �i(�) = U
(4.12)
4.4.2 Dual Problem
Now we can write down the Lagrange function and compute the dual. Following the lines of [Van94] and [VDY94] we get.
�
� �
�
L = ~t; (�~ � ? �~ ) + ~t�; (�~ � + �~ ) + 1 (�~ � ? �~ )tD(�~ � ? �~ ) 2 + 21 (�~ � + �~ )t D�(�~ � + �~ ) ?(�~ ;~a) ? (�~ �;~a� ) ? (~�; ~n) ? (~��; ~n�) ? (~c; (�~ � ? �~ )) y ? ((�~ + ~� ? U );~z) ? ((�~ � + ~�� ? U );~z� )
(4.13)
Di�erentiating wrt. the primal variables and backsubstitution yields (after some tedious algebra): fd = ? 21 (�~ � ? �~ )t D(�~ � ? �~ ) (4.14)
CHAPTER 4. OPTIMIZER
42
? 21 (�~ � + �~ )tD�(�~ � + �~ ) ?(U; ~n) ? (U; ~n�) subject to ~t� + ~t = y~c ? ~n� + ~a� + (D� + D)�~ � + (D� ? D)�~ (4.15) ~t� ? ~t = ?y~c ? ~n + ~a + (D� ? D)�~ � + (D� + D)�~ (4.16)
4.4.3 Central Path
Finding a set of primal and dual feasible variables that ful l the KKT-conditions is equivalent to solving (4.1). The di�erence between the primal and dual objective function is a measure for the quality of the current set of variables as fd = f only for the optimal solution. Unfortunately solving this system directly is a badly conditioned problem due to the KKT-conditions, hence one resorts to a method called path following which substitutes the KKT conditions with relaxed ones viz. requires them to be satis ed only approximately (4.21), (4.22) and improves the approximation iteratively. The set of equations looks as follows: (~c; (�~ � ? �~ )) = 0 (4.17) ( � ) ( � ) �i + �i = U (4.18)
y~c ? ~n� + ~a� + (D� + D)�~ � + (D� ? D)�~ = ~t� + ~t ?y~c ? ~n + ~a + (D� ? D)�~ � + (D� + D)�~ = ~t� ? ~t
(4.19) (4.20)
a(i�) �i(�) = � 8i n(i�) �i(�) = � 8i
(4.21) (4.22)
and �~ ; �~ �;~a;~a� ; ~�; ~��; ~n; ~n� � 0 (y is a free variable as it corresponds to an equality constraint)
4.4.4 Predictor / Corrector
(4.23)
Now we apply Newton's method for solving this system - not exactly but as a predictor/corrector algorithm [LMS90], [MS92] with computation of nite di�erences (e.g. ai ?! ai + �ai) and thereby linearizing the system of equations. The only problem is to decrease � in a suitable manner such that we stay in the cone of quadratic convergence. But for the beginning let us assume that we already found a suitable value for it. Predictor: compute the appropriate �predictor for a linearized set of equations (2nd order terms are neglected) with � = 0
CHAPTER 4. OPTIMIZER
43
Corrector: compute a suitable value for � (cf. 4.4.6), substitute �predictor back into the 2nd order terms and compute the corrector values �corrector Hence we have to solve the following system: (~c; (��~ � ? ��~ )) ? (~c; (�~ � ? �~ )) ��i(�) + ��i(�) U ? �i(�) ? �i(�)
= =: c = =: u �
(4.24)
�y~c ? �~n� + �~a� + (D� + D)��~ � + (D� ? D)��~ ~t� + ~t ? y~c + ~n� ? ~a� ? (D� + D)�~ � ? (D� ? D)�~ ?�y~c ? �~n + �~a + (D� ? D)��~ � + (D� + D)��~ ~t� ? ~t + y~c + ~n ? ~a ? (D� ? D)�~ � ? (D� + D)�~
= =: �� = =: �
(4.26)
�a(i�) + ��i(�) a(i�) �i(�) ?1 ��i(�) ?1 ? a(i�) ? ��i(�) �a(i�) �i(�) ?1 �n(i�) + ��i(�) n(i�) �i(�) ?1 ��i(�) ?1 ? n(i�) ? ��i(�) �n(i�) �i(�) ?1
= =: a � = =: n �
(4.28)
(4.25)
( )
(4.27)
( )
(4.29)
( )
In order to avoid additional tedious notations we de ne2 :
n(�) := diag(n(1�) ; : : : n(l �) ); (a, � and � are de ned analogously) ( � ) � := n(�)�(�) ?1 + a(�)�(�) ?1 �c := ? c �� � := ? � � + a � ? n � + u � n(�) �(�) ?1 ( )
( )
( )
( )
( )
(4.30) (4.31) (4.32) (4.33)
Equation (4.25) can be solved for �i(�) directly. Substituting (4.28) and (4.29) into (4.27) and (4.26) yields:
0 ��~ � 1 0 � � 1 � M @ ��~ A = @ �� A �y
with
0 D� + D + �� D� ? D ?~c 1 M = @ D� ? D D� + D + � ~c A t ?~c
2
(4.34)
�c
~c
0
(4.35)
The abbreviation (�) means that the equation holds for the variables with and without �.
CHAPTER 4. OPTIMIZER
44
we can simplify the system further by applying: 0 1 ?1 0 1 0 1 1 0 2 2 T = @ 1 1 0 A hence T?1 = @ ? 12 21 0 0 0 1 0 0 1
1 A
(4.36)
0 4D� + �� + � � ? �� 1 0 TtMT = @ � ? �� 4D + �� + � 2~c A t
(4.37)
0 2~c 0 The di�cult part is to diagonalize 4D + �� + �, the rest of the blocks is easy as these contain only diagonal terms (that was the condition we imposed on D� before). Note that these blocks have full rank as the �� + � terms are guaranteed to be positive by de nition. Usually D will be a symmetric positive matrix without any further properties. For the case of input data ~xi with equal spacing
~xi ? ~xj = (i ? j )�~x (4.38) and a translation invariant Kernel (e.g. B-Splines) K (~x;~x�) = K (~x ? ~x�) (4.39) D becomes a Toeplitz matrix. Unfortunately the �� + � terms partly spoil the symmetry. So one has to modify the standard diagonalization algorithms:
4.4.5 Modi ed Levinson Decomposition
We will follow the reasoning in [PTVF92] with some modi cations: Denote R0 + dii the varying diagonal elements of the (otherwise) Toeplitz matrix and Rj the side diagonal elements with Rj = R?j , viz. we have a symmetric matrix. Note that the following reasoning is valid for non symmetric matrices, too but we will not comment on that any further. We want to solve: 10 x 1 0 y 1 0 R +d R1 � � � Rn?1 0 11 1 BB y2 CC BB R1 R0 + d22 � � � Rn?2 CC BB x12 CC BB � CC (4.40) BB � CC = BB � � � C C B � C C B � C B � � �
B@ � CA B@
�
CB
C
� � A@ � A xn � � � R0 + dnn
Rn?1 Rn?2 yn dii are the additional diagonal terms stemming from the interior point method whereas Ri = K (~xj ;~xj+i) are the regular entries of the dot product matrix. The key idea is to nd a recursive way of diagonalizing the matrices and compute the updates M 7?! M + 1 with only O(M ) computational cost.
CHAPTER 4. OPTIMIZER
45
Recursion over M (RHS solutions): xMi indicates an element of the solution vector xi for the M -th step. start (M ): yi =
diixMi
+
M X
j =1 M
recursion (M + 1): yi = diixMi +1 + =) Ri?(M +1) xMM +1 +1
=
dii(xMi
Ri?j xMj
X
(4.41)
Ri?j xMj +1 + Ri?M ?1 xMM +1 +1 (4.42)
j =1
? xMi +1) +
M X j =1
Ri?j (xMj ? xMj +1) (4.43)
now we divide by xMM +1 +1 and substitute
GMj
xMj ? xMj +1 := xMM +1 +1
this yields
Ri?(M +1) = diiGMi
+
M X j =1
(4.44)
Ri?j GMj
(4.45)
specializing (4.42) for i = M + 1 and substituting x for G (4.44) we get
yM +1 = xMM +1 +1
=
M X
RM +1?j xMj +1 + (R0 + dM +1;M +1)xMM +1 +1
(4.46)
PM R GM ? (R + d 0 M +1;M +1) j =1 M +1?j M +1?j
(4.47)
j =1
PM R xM ? y M +1 j =1 M +1?j j
This is a recursive relation in x and G. If we could express x by G only we would have achieved our goal. Now we write the same set of equations for the left hand side solutions (using z instead of x):
yi = diiziM +
M X j =1 M
=) RM +1?i = diiHiM + with
HjM =
Rj?izjM
X j =1
Rj?iHjM
+1 zMM+1?j ? zMM+1 ?j M +1 zM +1
(4.48) (4.49) (4.50)
CHAPTER 4. OPTIMIZER
46
as HM +1 obeys to the same type of equations as x (and GM +1 corresponds to z) we can write a system of recursion equations: PM R H M ? R 0 j =1 M +1?j j M +1 (4.51) HM +1 = PM M j =1 RM +1?j GM +1?j ? (R0 + dM +1;M +1) PM R GM ? R 0 j =1 j ?M ?1 j M +1 GM +1 = PM (4.52) M j =1 Rj ?M ?1 HM +1?j ? (R0 + dM +1;M +1) M GMj +1 = GMj ? GMM +1 (4.53) +1 HM +1?j M +1 M M +1 M Hj = Hj ? HM +1 HM +1?j (4.54) With the initial values y1 1 = R?1 G (4.55) x11 = R + 1 R +d 0 d00 0 00 y1 R1 1= z11 = R + H (4.56) 1 d R +d 0
00
0
00
we can start solving the system iteratively. As Ri = R?i we only need G and can forget about H for the solution. This gives a method that scales only O(M 2 ) for inverting the matrix compared to O(M 3) for standard diagonalization methods for arbitrary symmetric matrices. A further performance improvement might be obtained by modifying the O(M log M ) methods of Bunch, Parlett and de Hoog [Bun85], [dH87], [BBdHS95].
4.4.6 Computing � and other updates
After obtaining the update rules by the predictor / corrector steps one has to determine the length of the update steps. So far we did not care about the positivity constraints of the variables - now we will have to restrict the steplength s such that no variable becomes negative:
!
1 = ?1 min ��i(�) ; �a(i�) ; ��i(�) ; �n(i�) ; ?(1 + ") (4.57) s 1+" �i(�) a(i�) �i(�) n(i�) Setting " = 0:05 is a good choice. Another heuristic is applied to the choice of �. First we have to nd a value corresponding to the current set of variables �; a; �; n for the case that the current set of variables does not lie on the central path3. Using equations (4.21) and (4.22) and summing up over them we get � � � � (4.58) � = (�~ ;~a) + (�~ ;~a ) 4+l (~�; ~n) + (~� ; ~n ) 3 The central path is the set of primal and dual feasible points for which the modi ed KKT{ conditions hold.
CHAPTER 4. OPTIMIZER
47
As we want to decrease � after each iteration we choose �new according to [Van94]
� 1 ? s �2 �new = �old
(4.59)
1 + 10s
This ensures slow decrease of � when the problem becomes di�cult (i.e. we're hitting the positivity constraints). For monitoring the progress of the optimizer it is convenient to de ne some feasibility criteria Ip and Id for the primal and dual set. The violation of the constraints is stored in the temporary variables c and u � for the primal constraints and in � � for the dual ones. These have to become zero (or at least close to it) for a feasible point to be found. Hence we set ( )
( )
Ip :=
p 2 + jj jj2 + jj � jj2 c
u 2
pjj jj2 +2lUjj � jj2 � 2 � 2 Id := 2jj~cjj2 + 1
u 2
(4.60) (4.61)
and declare a solution primal / dual feasible if I is smaller than 10?6. Moreover we would like to measure the feasibility gap, the di�erence between primal and dual objective function and call the logarithm of the relative di�erence number of signi cant gures ns: ns := ? log10 jjffp j?+f1dj (4.62) p We stop if ns > 6. The starting point is chosen such that the feasibility conditions are ful lled as well as possible. This is done in one step by solving the primal and dual feasibility conditions (4.17 - 4.20) and restricting the solution to the domain [0:1U; 1).
Chapter 5 Experiments We will show the properties of Support Vector Regression Estimation using a simple function to be approximated f (x) = sinx x + � (5.1) with � as additional noise term of variable strength and distribution. For convenience set [0; 1]2 as domain of interest and apply a scaling to f so that we're e�ectively dealing with 0:9 � sinc( 10� x).
5.1 Approximation There are several criteria with respect to which an approximation for some given dataset could be chosen. Common choices are the Lp-norms with p 2 f1; 2g. Still this is not a safe choice as these norms are not equivalent, hence convergence in Lp doesn't imply convergence in Lp� (for p 2 R +). The only norm that implies convergence in all other norms is L1. This may be a serious issue in practical applications such as predicting the stock market: besides maximizing revenues one would like to keep the maximum loss (e.g. by an erroneous prediction of the system) bounded (viz. to bound it in the L1 -norm). Therefore we choose
jjf ? fapproxjj1 � �
(5.2)
and among this class of functions satisfying (5.2) the attest one for which this equation holds. See chapter 1 for more details. This approach corresponds to the graphs in gure 5.1. One may observe that the approximations become atter as the margin widens until they result in the constant function which is the attest function available. Unfortunately in reality we are not given f itself but only measurements at positions f~x1 ; : : :~xl g for which we try to ful l the condition stated above. E�ectively we have to nd the attest function that ts through the errorbars shown in the graph. 48
CHAPTER 5. EXPERIMENTS
49
1
1 sinc x
sinc x
0.8
0.8
0.6
0.6
0.4
0.4
0.2
0.2
0
0
-0.2
-0.2
-0.4
-0.4
-0.6
-0.6
-0.8
-0.8
-1
-1 -1
-0.8
-0.6
-0.4
-0.2
0
0.2
0.4
0.6
0.8
1
1
-1
-0.8
-0.6
-0.4
-0.2
0
0.2
0.4
0.6
0.8
1
1 sinc x + 0.1 sinc x - 0.1 approximation
0.8
sinc x + 0.2 sinc x - 0.2 approximation
0.8
0.6
0.6
0.4
0.4
0.2
0.2
0
0
-0.2
-0.2
-0.4
-0.4
-0.6
-0.6
-0.8
-0.8
-1
-1 -1
-0.8
-0.6
-0.4
-0.2
0
0.2
0.4
0.6
0.8
1
1
-1
-0.8
-0.6
-0.4
-0.2
0
0.2
0.4
0.6
0.8
1
1 sinc x + 0.5 sinc x - 0.5 approximation
0.8
sinc x + 1 sinc x - 1 approximation
0.8
0.6
0.6
0.4
0.4
0.2
0.2
0
0
-0.2
-0.2
-0.4
-0.4
-0.6
-0.6
-0.8
-0.8
-1
-1 -1
-0.8
-0.6
-0.4
-0.2
0
0.2
0.4
0.6
0.8
1
-1
-0.8
-0.6
-0.4
-0.2
0
0.2
0.4
0.6
0.8
1
Figure 5.1: sinc x, datapoints with �-precision and approximations with 0:1, 0:2, 0:5 and 1:0 precision using a spline kernel of degree 3
CHAPTER 5. EXPERIMENTS
50 Approximation Datapoints
1
0.5
0
-0.5
1 0.5
-1
0
-0.5 -0.5
0 0.5 1
-1
Figure 5.2: sinc jjxjj measured at 100 iid locations with a spline approximation of degree 1 and precision 0.1 Of course such an approximation can be carried out for more than one dimension (see gure 5.2) but we will stick with just one dimension in the following as the results can be visualized much more easily. Figure 5.4 shows the decomposition of the approximation in support vectors. One can observe that the number of support vectors increases with the quality of approximation required. This e�ect can be understood by a simple physical reasoning - keeping in mind that the lagrange multipliers can be regarded as forces and the approximation corresponds to a exible rod one would like to t into the �-tube it is clear that by narrowing the width of the tube the number of points where the rod hits the tube increases. In other words: by narrowing the constraints on the approximation more and more of them are likely to become active. The action of the Lagrange multipliers can be observed directly in gure 5.3. Only at the points where the approximation hits the boundary Support Vectors appear. This is a restatement of the Karush{Kuhn{Tucker conditions (cf. section 1.5). This e�ect also can be seen in the context of data compression: for representing the approximation we only have to store the Support Vectors and the corresponding Lagrange multipliers and may forget about the other datapoints. As already shown before approximation is possible with computational cost scaling only in the number of samples for any dimension. This is much better than direct approximation by splines as the latter scales exponentionally in
CHAPTER 5. EXPERIMENTS
51
1 sample interpolation alpha
0.8 0.6 0.4 0.2 0 -0.2 -0.4 -0.6 -0.8 -1 -1
-0.8
-0.6
-0.4
-0.2
0
0.2
0.4
0.6
0.8
1
Figure 5.3: forces (red) exerted by the �-tube (green) on the approximation (blue) the number of input-dimensions (viz. the number of coe�cients for the function representation).
5.1.1 Number of Support Vectors
In gure 5.4 one can see once more the increase in the number of Support Vectors for increasing approximation quality, this time for an approximation with BSplines. One can see that the quality of the approximation does not depend strongly on the kernels used. This is a similar nding to what is the case in pattern recognition. See [SBV95] for more details on this topic. Figure 5.5 nally is an explicit compression diagram for our dataset. For approximating the 100 points given up to a certain precision � we need as much data as we get Support Vectors.
5.2 Regression / Estimation Regression / Estimation means trying to infer the correct functional dependency from noisy data. Hence we will turn on � in (5.1) in the following experiments. Figure 5.6 shows the approximation properties for di�erent noise strength. It is interesting to see how the number of support vectors for a xed margin increases with increasing noise. In a data compression context this means that
CHAPTER 5. EXPERIMENTS
52
1.2 Figure 5.4: approximation with 1.0, 0.5, 0.2, 0.1, 0.05 and 0.02 precision precision using a B-spline kernel of degree 3, the solid dots are support vectors
CHAPTER 5. EXPERIMENTS
53
80
70
60
50
40
30
20
10
0 0.0001
0.001
0.01
0.1
1
Figure 5.5: Number of Support Vectors vs. precision of the approximation (spline approximation of degree 1 with 100 nodes) for 100 datapoints (note that the maximum number of points is 100) the more noisy data becomes the less it can be compressed. Moreover P (j� j � �) is the probability of a point to exceed the �-margin for an unbiased estimator.
5.2.1 Number of Support Vectors
This increase also can be understood by a di�erent reasoning. As the number of support vectors corresponds to the number of samples that lie on or outside the given margin one can relate this to the probability that for an unbiased estimator with sample size l ?! 1 the deviation between the data and the estimate is greater or equal to �:
P (jyi ? fapprox(~xi )j � �) =
Z
(?1;?�][[�;1)
= 2
Z1
p(� )d �
p 1 2 e? �� d � 2 2 2
(5.3)
2�� = 1 ? erf( �� ) (5.4) R � Here erf(x) := 2 p21�� 0� e? � d � . Figure 5.7 shows the good agreement between (5.3) and the experimental results for xed noise and varying �-margin. In gure 2
2 2 2
�
CHAPTER 5. EXPERIMENTS
54
Figure 5.6: regression / estimation of 0:9 sinc (10x) on [0; 1]2 for 100 samples with gaussian noise of standard deviation 0.1, 0.2, 0.5 and 1.0 and the corresponding �insensitive loss-zone of width 0.1, 0.2, 0.5 and 1.0 (black dots are support vectors) 5.8 the same e�ect can be observed for xed �-margin and varying gaussian noise (�). Here howewer the number of Support Vectors does not converge to 0 for � ?! 0 because the function without noise still carries information. This is the reason for the discrepancy between P(SV) and the measured number of Support Vectors. The same is true for the region � 2 [0:5; 1] for gure 5.7.
5.2.2 Optimal Choice of Parameters
The approach described so far leaves two questions unanswered: The choice of � and the choice of the regularization. It can be seen from the gures 5.11, 5.12, 5.13, 5.14 that there is (not surprisingly) an optimal choice for both variables. Moreover one will notice that the smallest error is not obtained for � = 0 but for some value greater than zero. This means that the �-insensitive loss function that corresponds to a biased estimator performs better than the unbiased L1 counterpart for gaussian noise.
CHAPTER 5. EXPERIMENTS
55
SV number of SV P(SV)
80
60
40
20
0 1e-05
0.0001
0.001
0.01
0.1
epsilon
Figure 5.7: Number of Support Vectors depending on the �-margin for xed noise level and probability of a point to lie outside the margin for an unbiased estimator and noise level � = 0:2 SV number of SVS P(SV) 80
70
60
50
40
30
20
10
0 1e-05
0.0001
0.001
0.01
0.1
sigma
Figure 5.8: Number of Support Vectors for di�erent noise levels and xed �margin of 0:2 (splines of degree 1, 100 points, 100 nodes, gaussian noise, 25 trials) and probability of a point to lie outside the margin for an unbiased estimator
CHAPTER 5. EXPERIMENTS
56
Support Vectors 90 80 70 60 50 40 30 20 10 0
100
50
0 Regularization 1000 Margin
100
0.001
10
0.01 0.1 1
1
Figure 5.9: Number of Support Vectors depending on the regularization and the �-margin (splines of degree 1, 100 points, 100 nodes, gaussian noise with standard deviation 0.1, 26 trials)
eps-error 0.18 0.16 0.14 0.12 0.1 0.08 0.06 0.04 0.02 0
20 15 10 5 0
Regularization 1000 Margin
100
0.001
10
0.01 0.1 1
1
Figure 5.10: �-insensitive cost function depending on the regularization and the �-margin (splines of degree 1, 100 points, 100 nodes, gaussian noise with standard deviation 0.1, 26 trials)
CHAPTER 5. EXPERIMENTS
57
L1 error 0.219 0.200 0.182 0.166 0.151 0.138 0.126 0.115
100
10
1
0.1 Regularization 1000 Margin
100
0.001
10
0.01 0.1 1
1
Figure 5.11: L1-error of the approximation depending on the regularization and the �-margin (splines of degree 1, 100 points, 100 nodes, gaussian noise with standard deviation 0.1, 26 trials) 0.7 L1 error
0.6
0.5
0.4
0.3
0.2
0.1 1e-05
0.0001
0.001
0.01
0.1
1
Figure 5.12: minimal L1 -error (optimal choice of the regularization) depending on the �-margin (splines of degree 1, 100 points, 100 nodes, gaussian noise with standard deviation 0.1, 26 trials)
CHAPTER 5. EXPERIMENTS
58
L2 error 0.195 0.182 0.170 0.158 0.148 0.138 0.128 0.120 0.112 0.105 0.098
100
10
1
0.1 Regularization 1000
0.01 Margin
100
0.001
10
0.01 0.1 1
1
Figure 5.13: L2-error of the approximation depending on the regularization and the �-margin (splines of degree 1, 100 points, 100 nodes, gaussian noise with standard deviation 0.1, 26 trials) 0.55 L2 error 0.5 0.45 0.4 0.35 0.3 0.25 0.2 0.15 0.1 0.05 1e-05
0.0001
0.001
0.01
0.1
1
Figure 5.14: minimal L2 -error (optimal choice of the regularization) depending on the �-margin (splines of degree 1, 100 points, 100 nodes, gaussian noise with standard deviation 0.1, 26 trials)
CHAPTER 5. EXPERIMENTS
59
Clearly for gaussian noise an L2 loss function would be the best choice. Hence an �-insensitive loss function with nonzero � is a better approximation of the L2 loss than a L1 loss is (see gure 5.16). For the realizable asymptotic case one can compute the optimal � exactly depending on the variance of the gaussian noise model.
5.2.3 Asymptotic E�ciency
Although no statement can be made so far about the optimal choice of the �margin for nite sample size still one can compute the asymptotic e�ciency for loss functions (under the assumption of realizability). This one is given by [Vap79], [MYA94], [Mur96a] 1 (5.5) e = Var(1�)I = Q?1 GQ ?1 I where � are the parameters of the density model and
G := E (�l� (�))2; and Q := E (��l� (�))
(5.6)
In our case we are dealing with a one-parametrical model hence denoting � �(� ) = p 1 e? � (5.7) 2�� 8